
The Role of Aloe vera L. Extract in Modulating Oxidative Stress and Inflammation in Wistar Rats on a High-Fat Diet: Insights from In Vivo and In Silico Studies


The Role of Aloe vera L. Extract in Modulating Oxidative Stress and Inflammation in Wistar Rats on a High-Fat Diet: Insights from In Vivo and In Silico Studies
Roy Sukbir Singh1, Jekson Martiar Siahaan2,3*, Endy Juli Anto4, Syafruddin Ilyas5, Putri Eyanoer6, Hendrika Andriani7,8
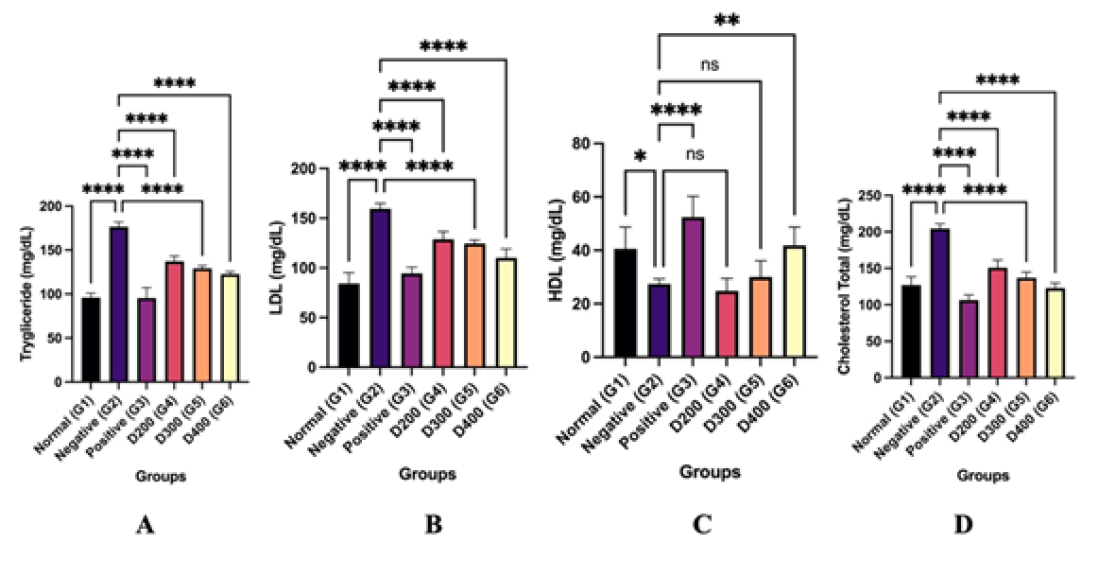
Figure 1.
Lipid Profile Concetration. A. Triglyceride, B. LDL, C. HDL, D. Cholestrol Total. Asterisk *P ≤ 0.05, **P ≤ 0.01, *** P ≤ 0.001, ****P ≤ 0.0001 represents significant differences to negative control group and NS represents not significant (P > 0.05).
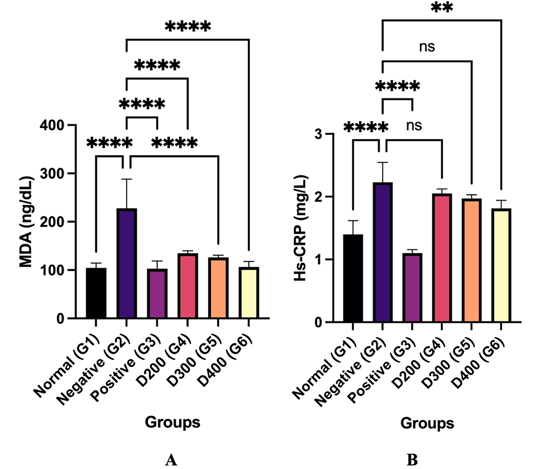
Figure 2.
Level of A. MDA and B Hs-CRP . Asterisk *P ≤ 0.05, **P ≤ 0.01, *** P ≤ 0.001, ****P ≤ 0.0001 represents significant differences to negative control group and NS represents not significant (P > 0.05).
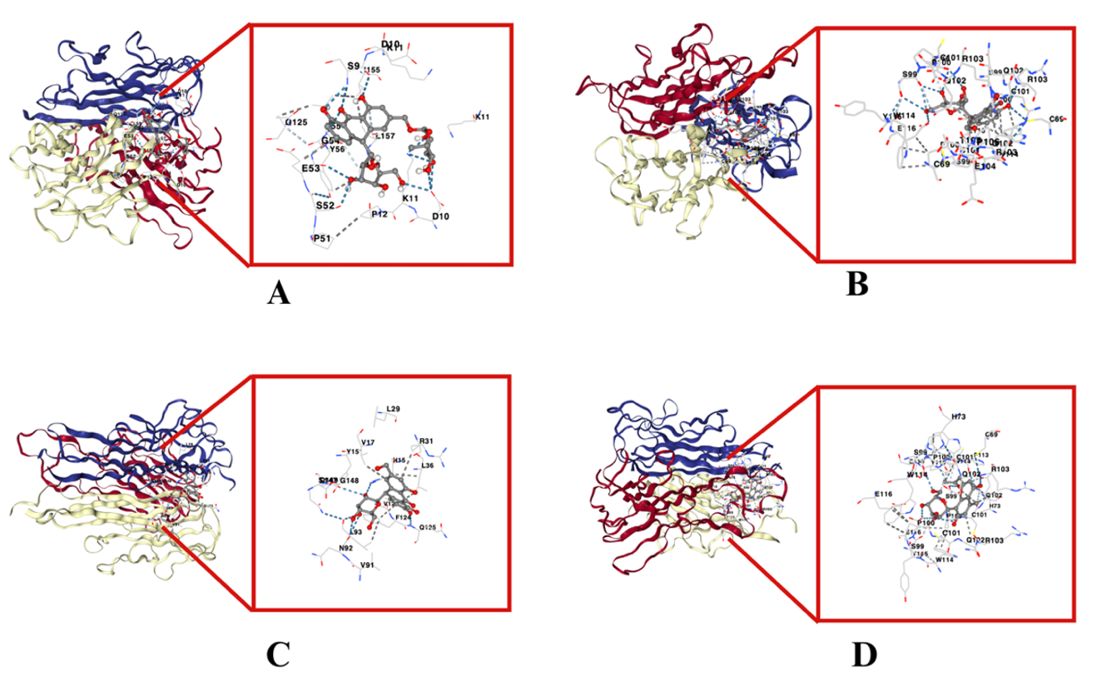
Figure 3.
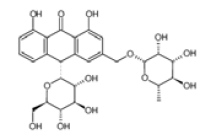
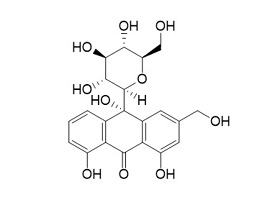
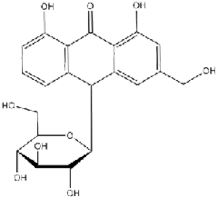
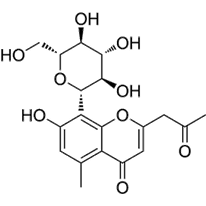
Docking Visulization with TNF-α. A. Aloinoside, B. Aloin, C. Hydroxyaloin, D. Aloesin.
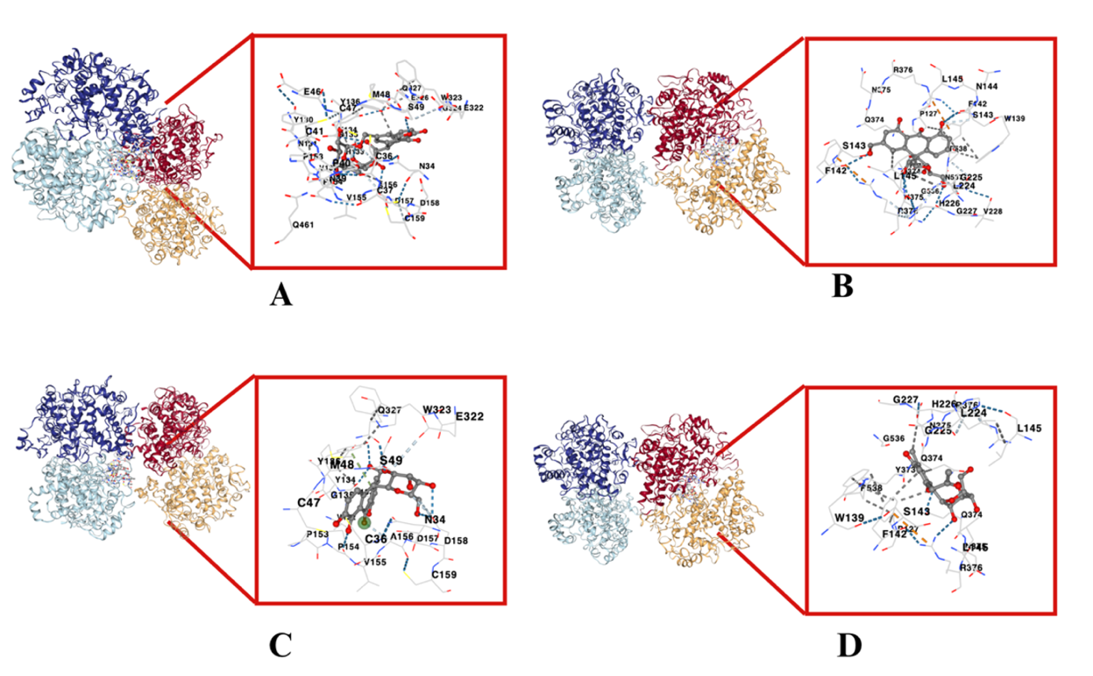
Figure 4.
Docking Visulization with COX-2. A. Aloinoside, B. Aloin, C. Hydroxyaloin, D. Aloesin.

October 2024
Vol. 12, Iss. 10, pp. 1846-2061

