

Lipopolysaccharide Induced Oxidative Stress and DNA Damage in Bovine Mammary Epithelial Cells


Lipopolysaccharide Induced Oxidative Stress and DNA Damage in Bovine Mammary Epithelial Cells
Yawang Sun, Yongjiang Wu, Jingbo Chen, Zili Wang, Juncai Chen, You Yang and Guozhong Dong*
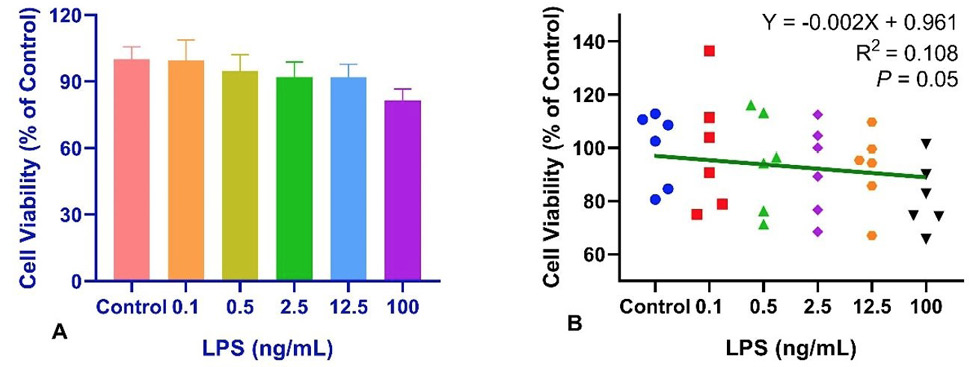
Effects of different LPS levels on the cell relative viability (A) and correlation analysis between LPS levels and cell viability (B) in MAC-T cells.
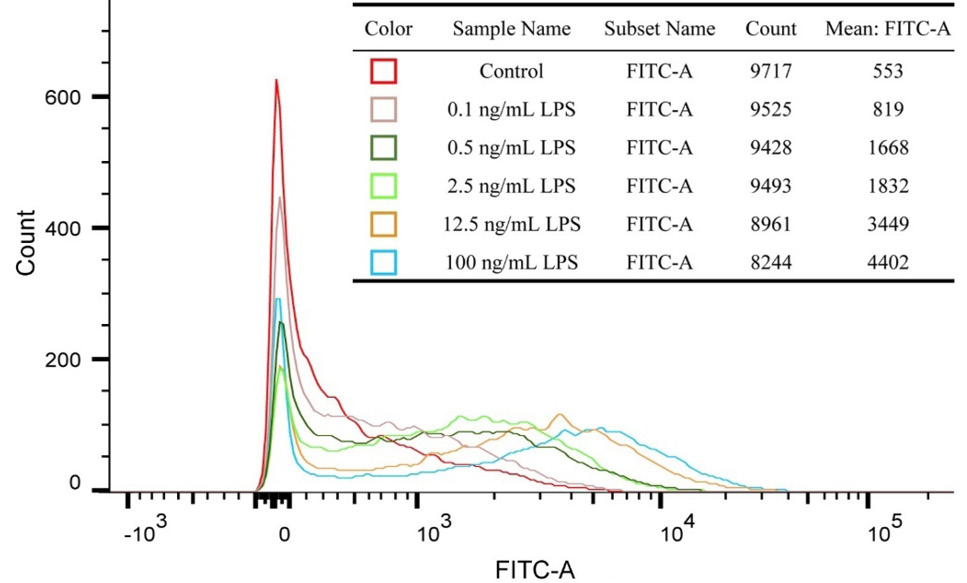
Effects of different LPS levels on the cellular ROS production in MAC-T cells. The representative flow cytometric results are showed in the histogram, and the line color and its corresponding sample name, total cell count, and mean fluorescence intensity are showed in the upper right table. Mean fluorescein isothiocyanate-A (FITC-A) values represent ROS concentrations.
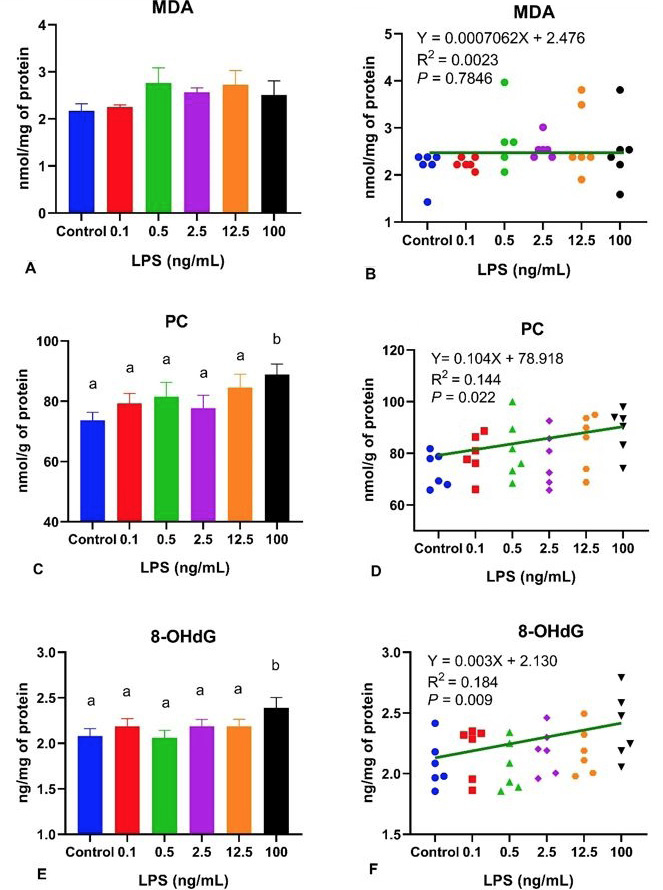
Effects of different LPS levels on oxidative damage markers’ concentrations (A, C, and E), and the correlation between LPS and markers’ levels (B, D, and F) in MAC-T cells. Columns without a common lowercase letter (a, b) indicate significant difference among treatments (P < 0.05). MDA, malondialdehyde; PC, protein carbonyl; 8-OHdG, 8-hydroxy-2’-deoxyguanosine.
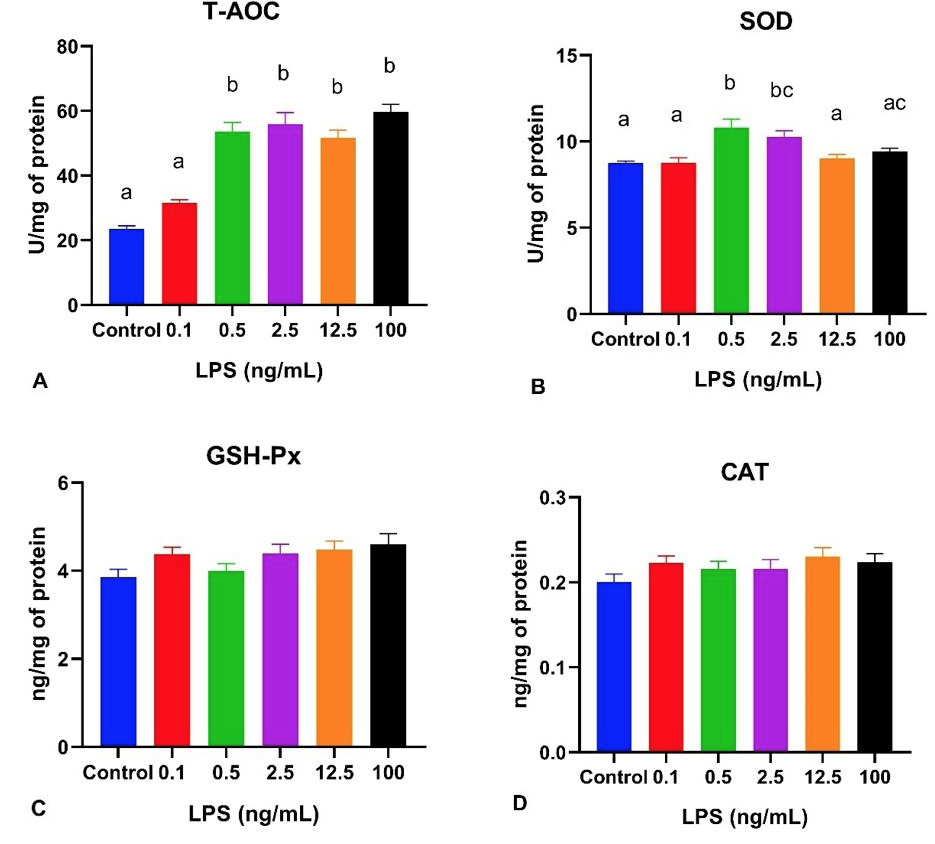
Effects of different LPS levels on the activities of antioxidants in MAC-T cells. Columns without a common lowercase letter (a, b, c) indicate significant difference among treatments (P < 0.05). T-AOC, total antioxidant capacity; GSH-Px, glutathione peroxidase; CAT, catalase; SOD, superoxide dismutase.
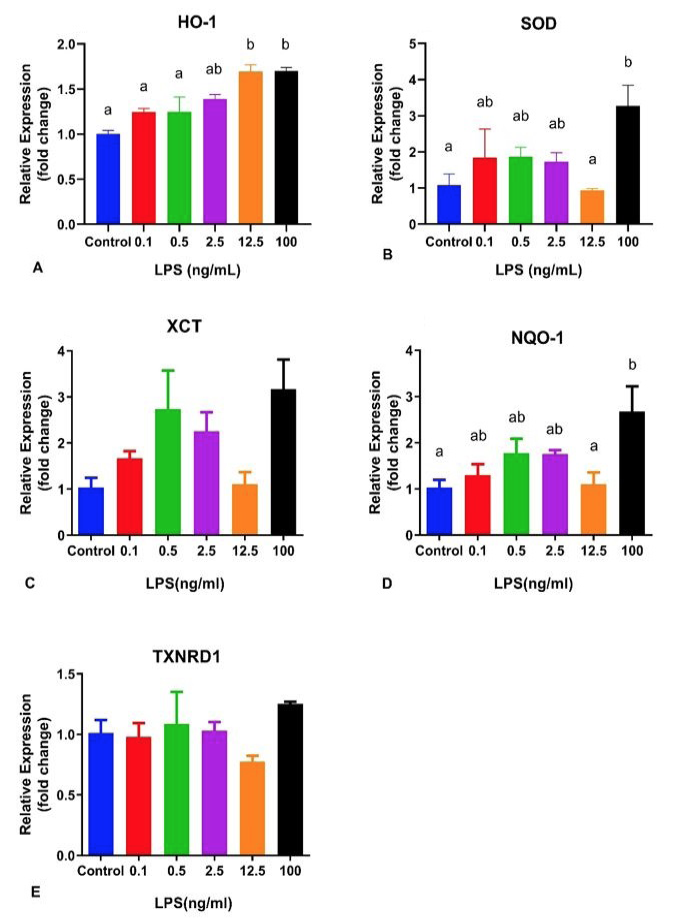
Effects of different LPS levels on the relatively expression of antioxidative genes in MAC-T cells. Columns without a common lowercase letter (a, b) indicate significant difference among treatments (P < 0.05). HO-1, hemeoxygenase 1; SOD, superoxide dismutase; XCT, cysteine uptake transporter; NQO-1, NADPH-quinone oxidoreductase; TXNRD1, thioredoxin reductase 1.
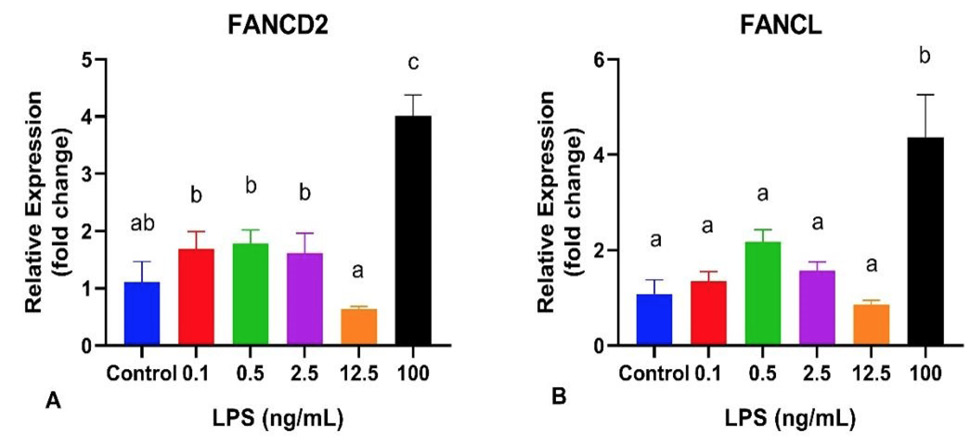
Effects of LPS on the relatively expression of DNA repair genes in MAC-T cells. Columns without a common lowercase letter (a, b, c) indicate significant difference among treatments (P < 0.05). FANCD2, Fanconi Anemia complementation group D2 protein; FANCL, Fanconi Anemia complementation group L.

Effects of different LPS levels on γH2AX protein expression in MAC-T cells. Columns without a common lowercase letter (a, b) indicate significant difference among treatments (P < 0.05). γH2AX, phosphorylated histone 2AX.


