Dose-Dependent Effects of Subchronic Exposure to Glyphosate-Based Herbicide on Behavior and Biochemical Alterations in Adult Rats
Dose-Dependent Effects of Subchronic Exposure to Glyphosate-Based Herbicide on Behavior and Biochemical Alterations in Adult Rats
Abdelghafour El-Hamzaoui*, Mouloud Lamtai, Laila Ibouzine‑Dine, Sofia Azirar, Mohamed Yassine El-Brouzi, Ayoub Rezqaoui, Aboubaker El-Hessni, Abdelhalem Mesfioui
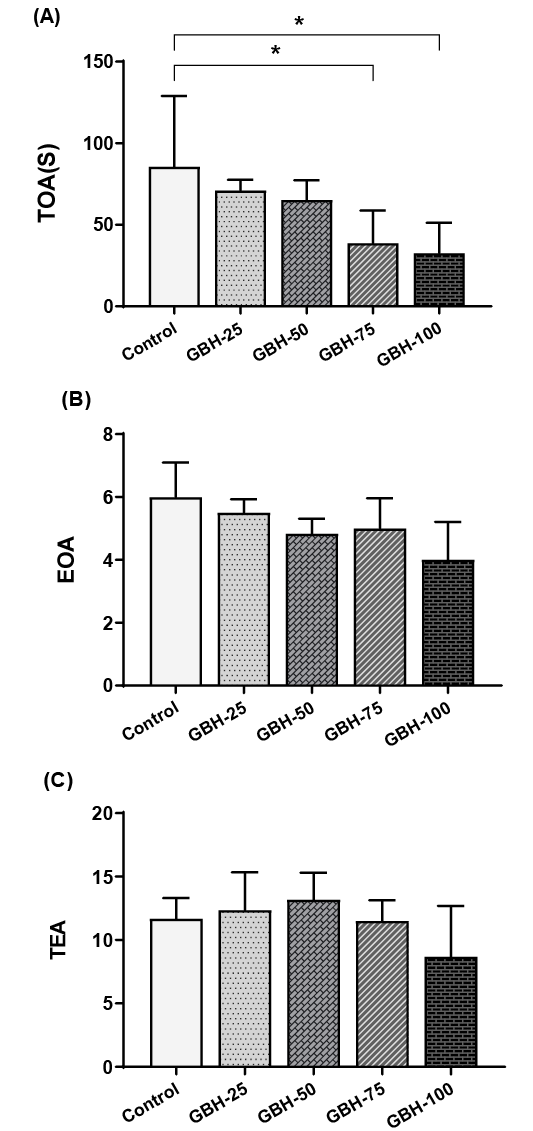
Effects of GBH (25, 50, 75 and 100 mg/kg) administration on anxiety associated behaviors in male rats. (A) Number of entries in exposed arms (EOA); (B) Total amount of time spent in exposed arms (TOA); and (C) Total number of arms entries (TEA) in elevated plus maze. Results are expressed as mean ± SEM. * p < 0.05, ** p < 0.01, *** p < 0.001.
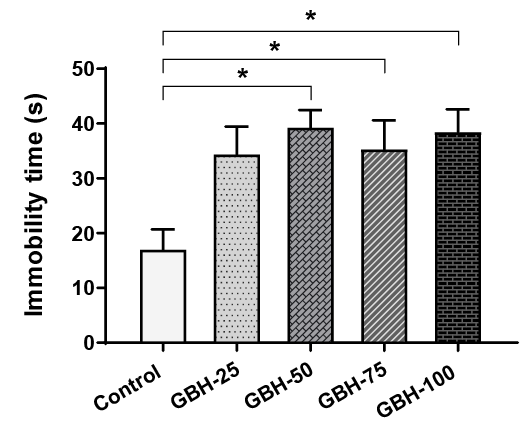
Effects of GBH (25, 50, 75 and 100 mg/kg) administration on depression-related behavior of male rats subjected to the forced swimming test, immobility time expressed in seconds. Results are expressed as mean ± SEM. * p < 0.05, ** p < 0.01, *** p < 0.001.
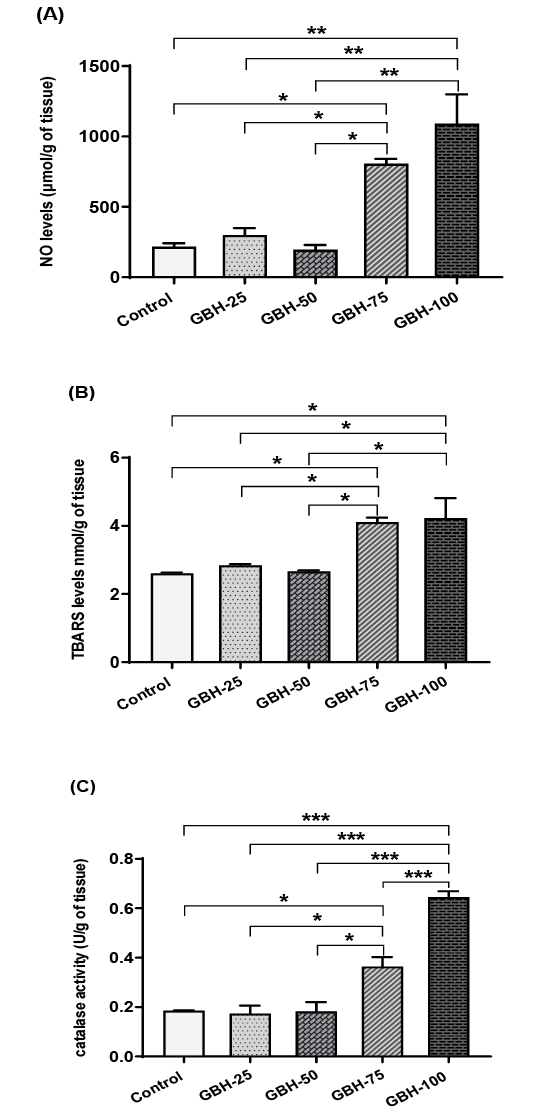
Measurement of oxidative stress parameters in the hippocampus after 2 months of GBH exposure (25, 50, 75 and 100 mg/kg). (A) the nitric oxide (NO) levels, (B) Changes in catalase activity, (C) Determination of the lipid peroxidation levels. Results are represented as mean ± SEM. The significance level is 0.05. *p < 0.05, **p < 0.01, ***p < 0.001.


