
Characterization of Bacterial Microbiota in the Gastrointestinal Tract (GIT) of Buffaloes Using PCR-Based Analysis


Characterization of Bacterial Microbiota in the Gastrointestinal Tract (GIT) of Buffaloes Using PCR-Based Analysis
Phoebe Lyndia Tolentino Llantada1,2*, Midori Umekawa2, Shuichi Karita2
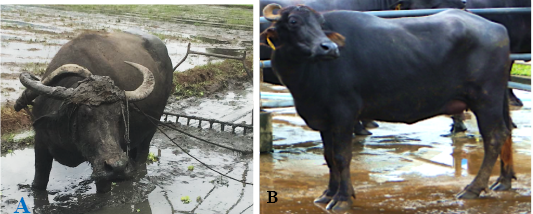
Major types of buffalo in the Philippines (A) swamp buffalo or the Philippine native carabao and (B) riverine buffalo or the dairy type.

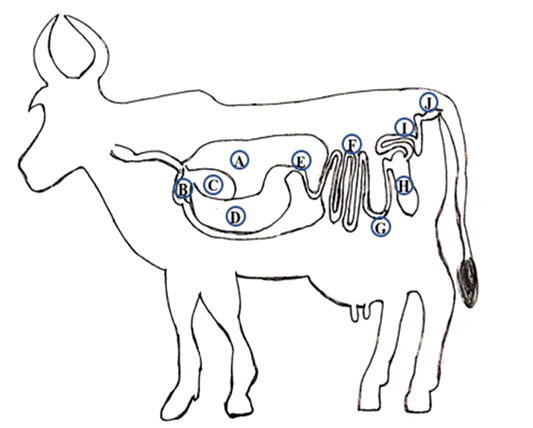
Sampling locations along gastrointestinal tract of a dairy buffalo: A: Rumen, B: Reticulum, C: Omasum, D: Abomasum, E: Duodenum, F: Jejunum, G: Ileum, H: Cecum, I: Colon and J: Rectum.

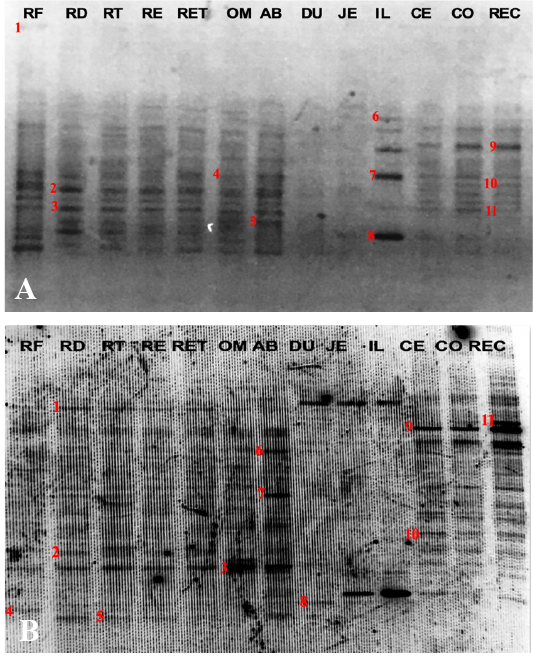
PCR-DGGE profiles of the gastrointestinal bacterial community of Buffalo 1 (A) and Buffalo 2 (B); marked with numbers are the selected bands for DNA sequence analysis. RF: Rumen fluid samples; RD: Rumen digesta samples; RT: Rumen Tissue samples; RE: Reticulum digesta samples; RET: Reticulum tissue samples; OM: Omasum samples; AB: Abomasum samples; DU: Duodenum samples; JE: Jejunum samples; IL: Ileum samples; CE: Cecum samples; CO: Colon samples and REC: Rectum samples.
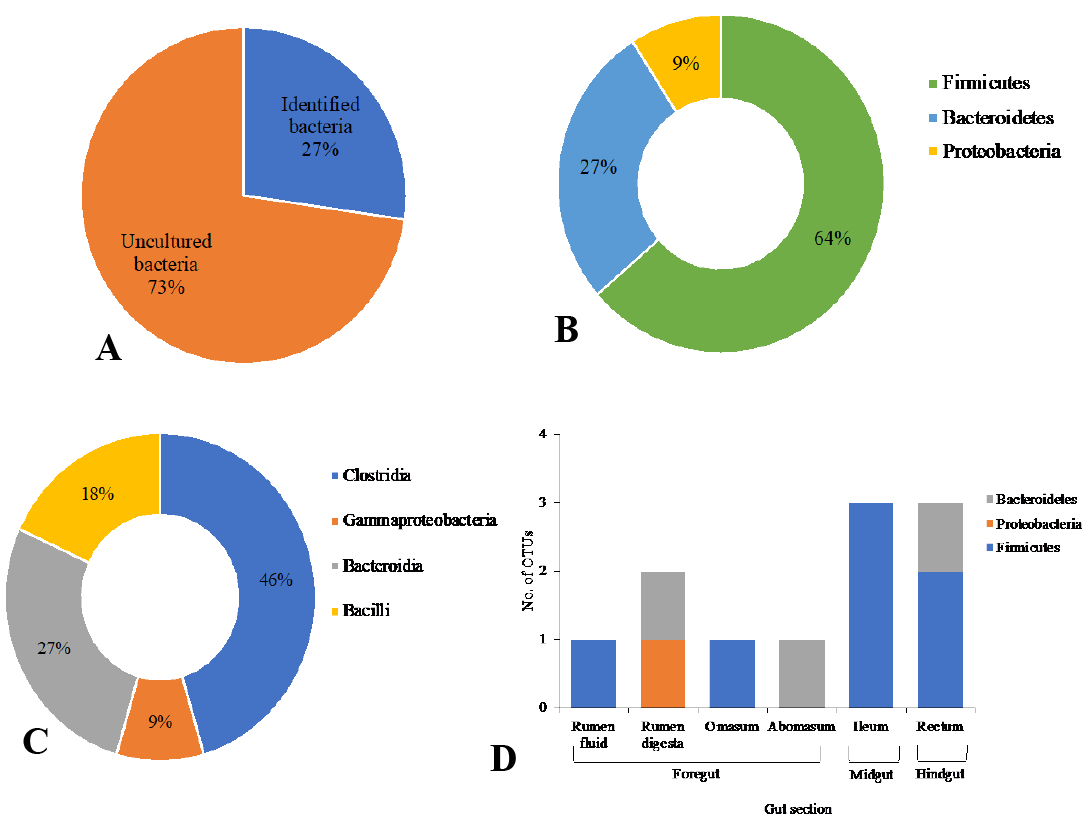
Distribution of 16S rRNA sequences from the GIT of riverine buffalo (Buffalo 1); Percentage of identified and uncultured bacteria (A); Percentage of the total relative abundances of phyla; Percentage of relative abundances of class (C) and relative abundances in phyla at the different locations in the GIT (D).
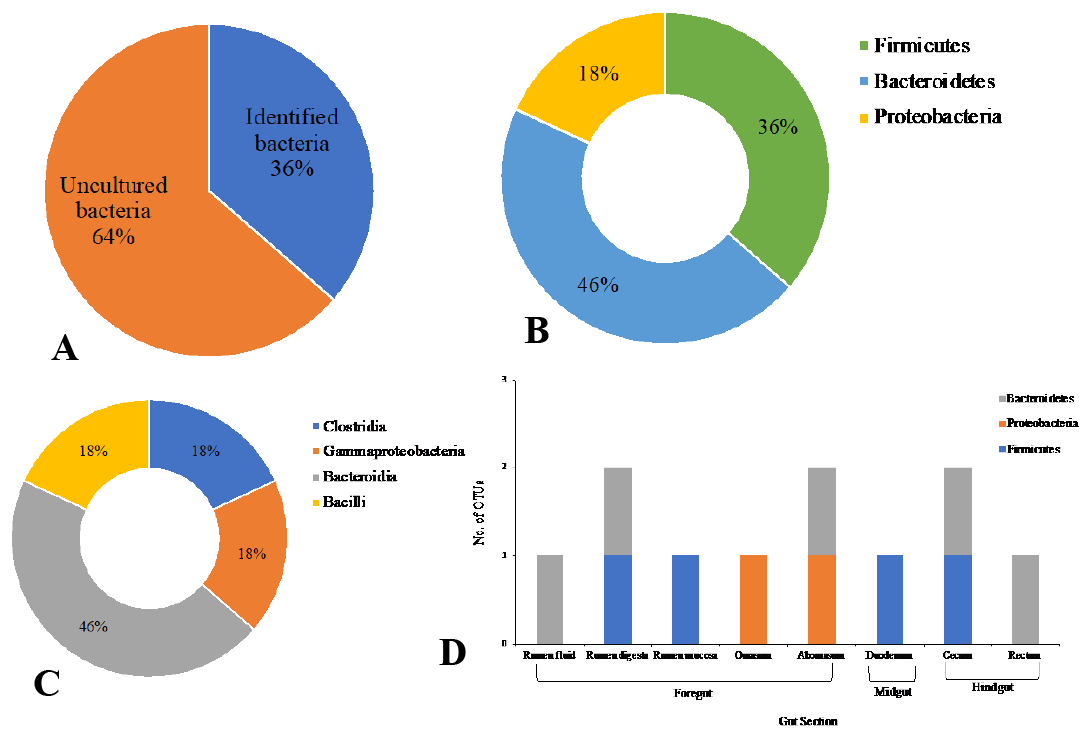
Distribution of 16S rRNA sequences from the GIT of riverine buffalo (Buffalo 2); Percentage of identified and uncultured bacteria (A); Percentage of the total relative abundances of phyla; Percentage of relative abundances of class (C) and relative abundances in phyla at the different locations in the GIT (D).


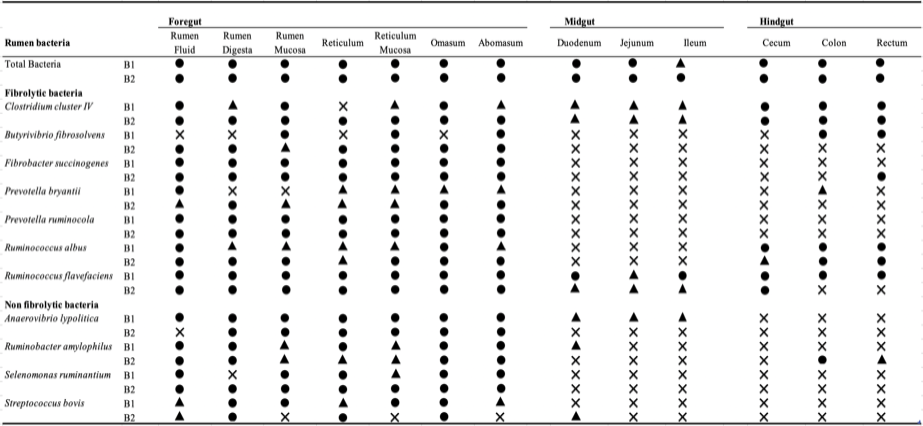
Detection of fibrolytic and non-fibrolytic bacteria in the different gut sections of dairy buffaloes using species specific primer sets.

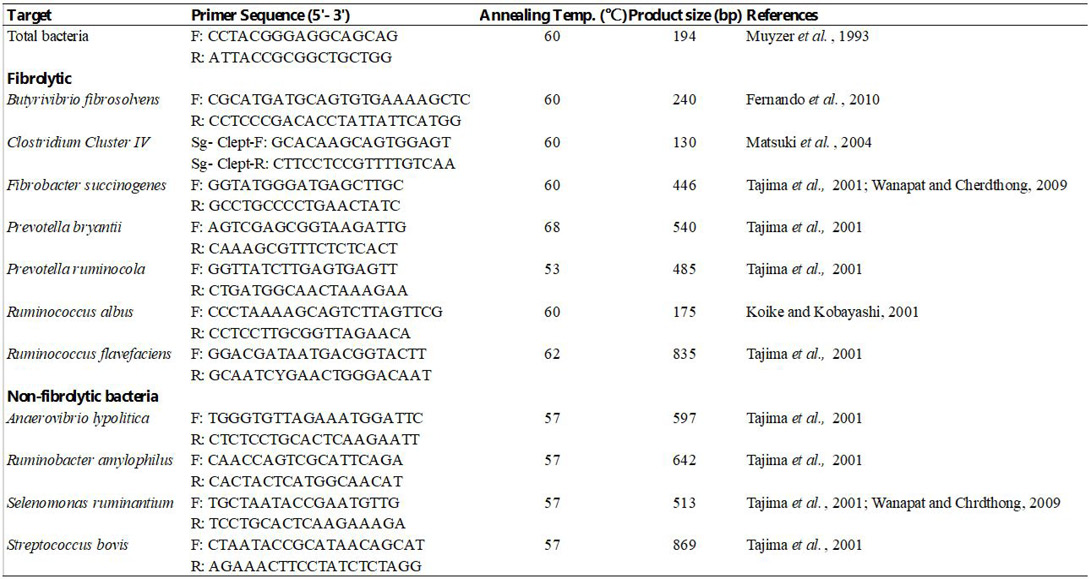
Species specific primer set for the detection of fibrolytic and nonfibrolytic bacteria.

