
Textural and Sensorial Characterization of Selected Fruit and Vegetable Purees as Impacted by the Addition of Microcrystalline Invert Sugar (MIS) as a Texturizing Agent


Textural and Sensorial Characterization of Selected Fruit and Vegetable Purees as Impacted by the Addition of Microcrystalline Invert Sugar (MIS) as a Texturizing Agent
Imran Ahmad

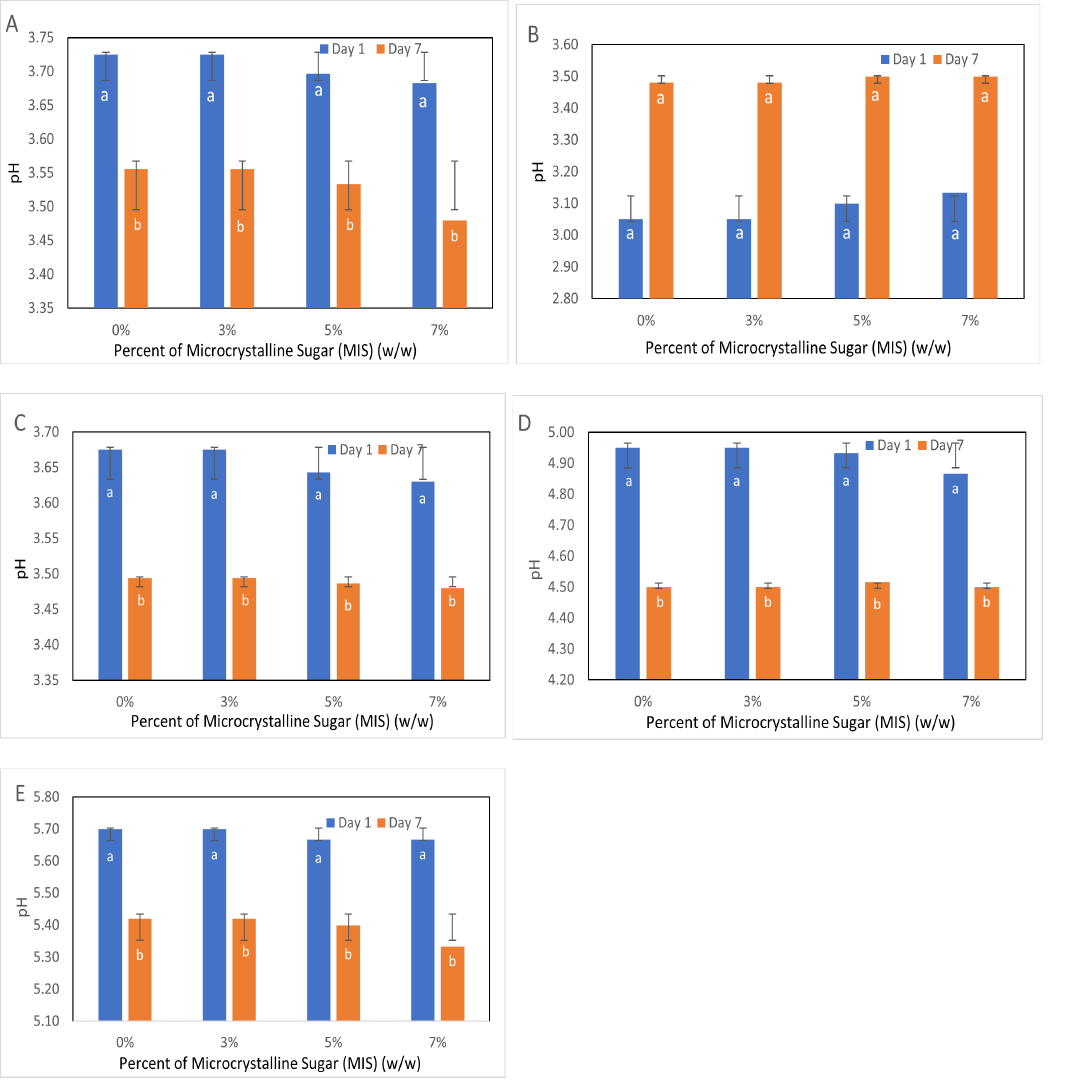
Figure 1:
Change in pH after the addition of MIS in (A) strawberry (B) banana (C) Apple (D) beetroot, and (E) carrot. A two-factor ANOVA (95% C.I) was conducted where factor 1 was MIS levels (0, 3, 5 and 7%) and factor 2 was day 1 and day 7. Factor 1 (MIS level): no significant difference was observed. Factor 2 (storage days): the statistical difference was observed in all samples except for (B) banana.
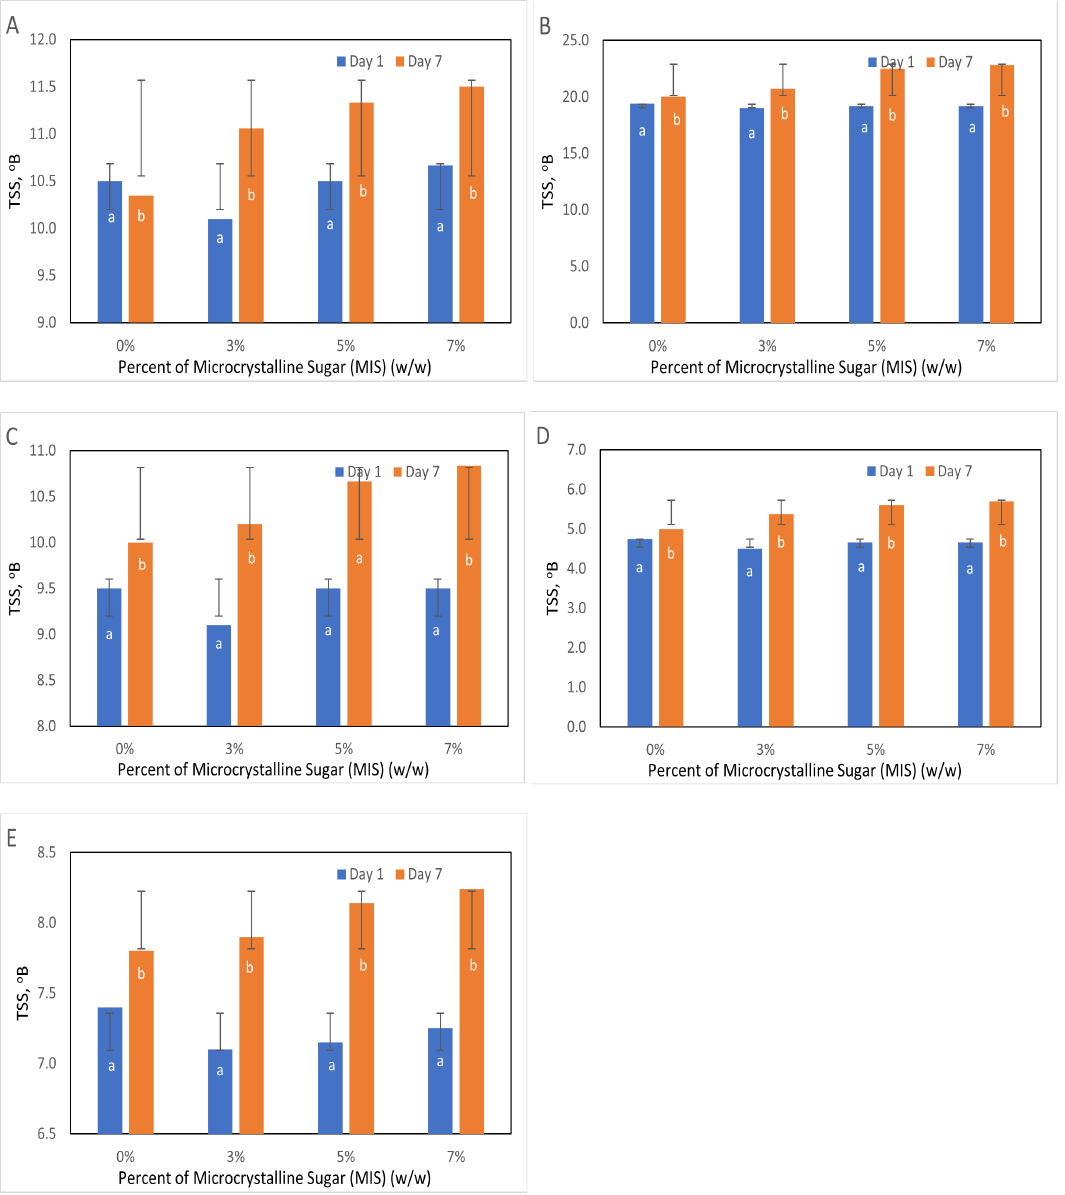
Figure 2:
Change in total soluble solids after the addition of MIS in (A) strawberry, (B) banana (C) Apple (D) beetroot, and (E) carrot. A two-factor ANOVA (95% C.I) was conducted where factor 1 was MIS levels (0, 3, 5 and 7%) and factor 2 was day 1 and day 7. Factor 1 (MIS level): no significant difference was observed. Factor 2 (storage days): the statistical difference was observed in all samples.

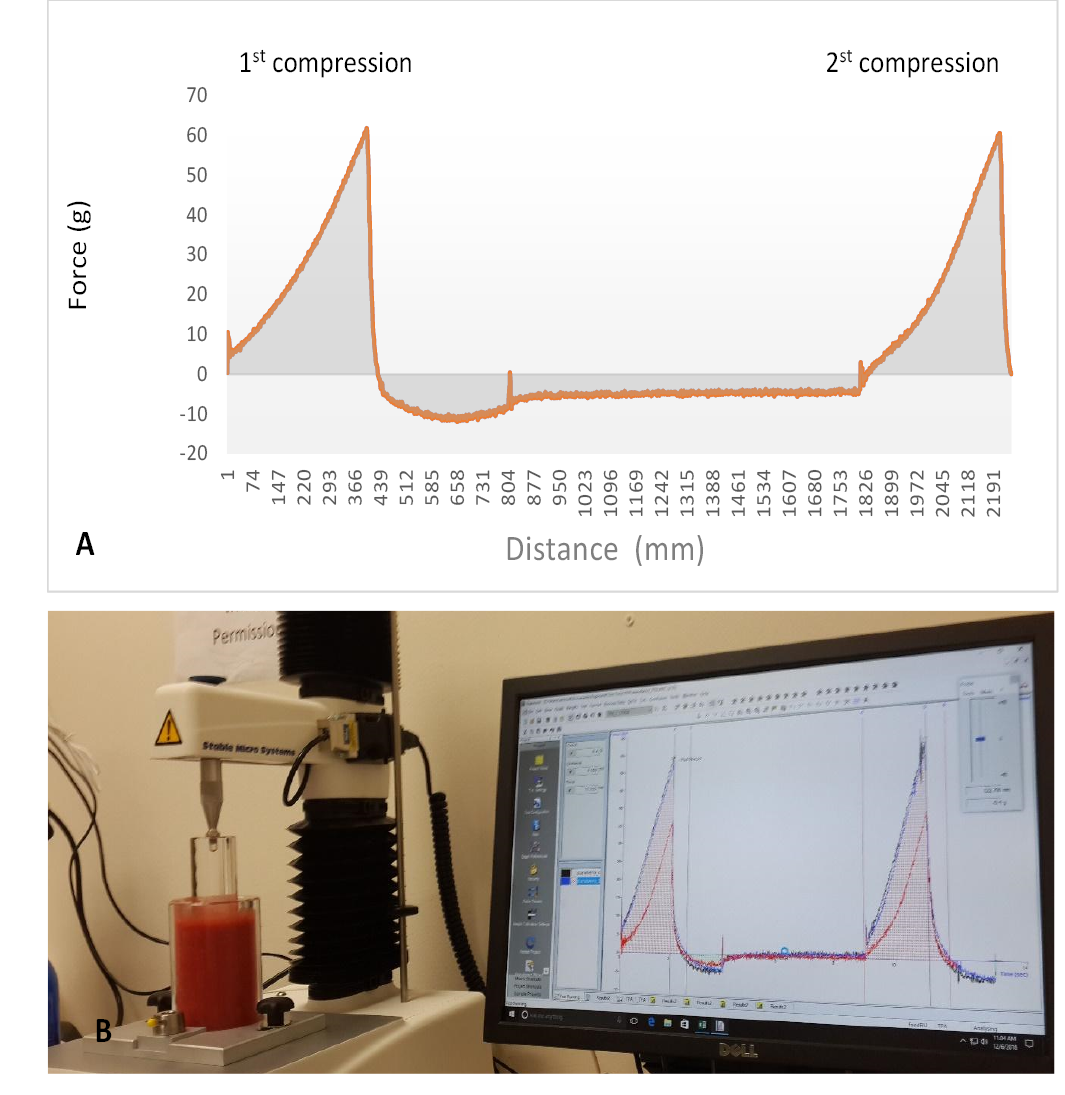
Figure 3:
A typical TPA plot to determine textural attributes using Textural Analyzer (A). Texture Analysis of Strawberry Puree (B). Hardness (g): the peak force of the first compression of the product. Adhesiveness: force * time travelled by plunger in the second compression. Cohesiveness: measured as the area of work during the second compression divided by the area of work during the first compression. (Area 2/Area 1). Gumminess: Hardness *Cohesiveness (g/mm2), Chewiness: Gumminess*Springiness (g.s).

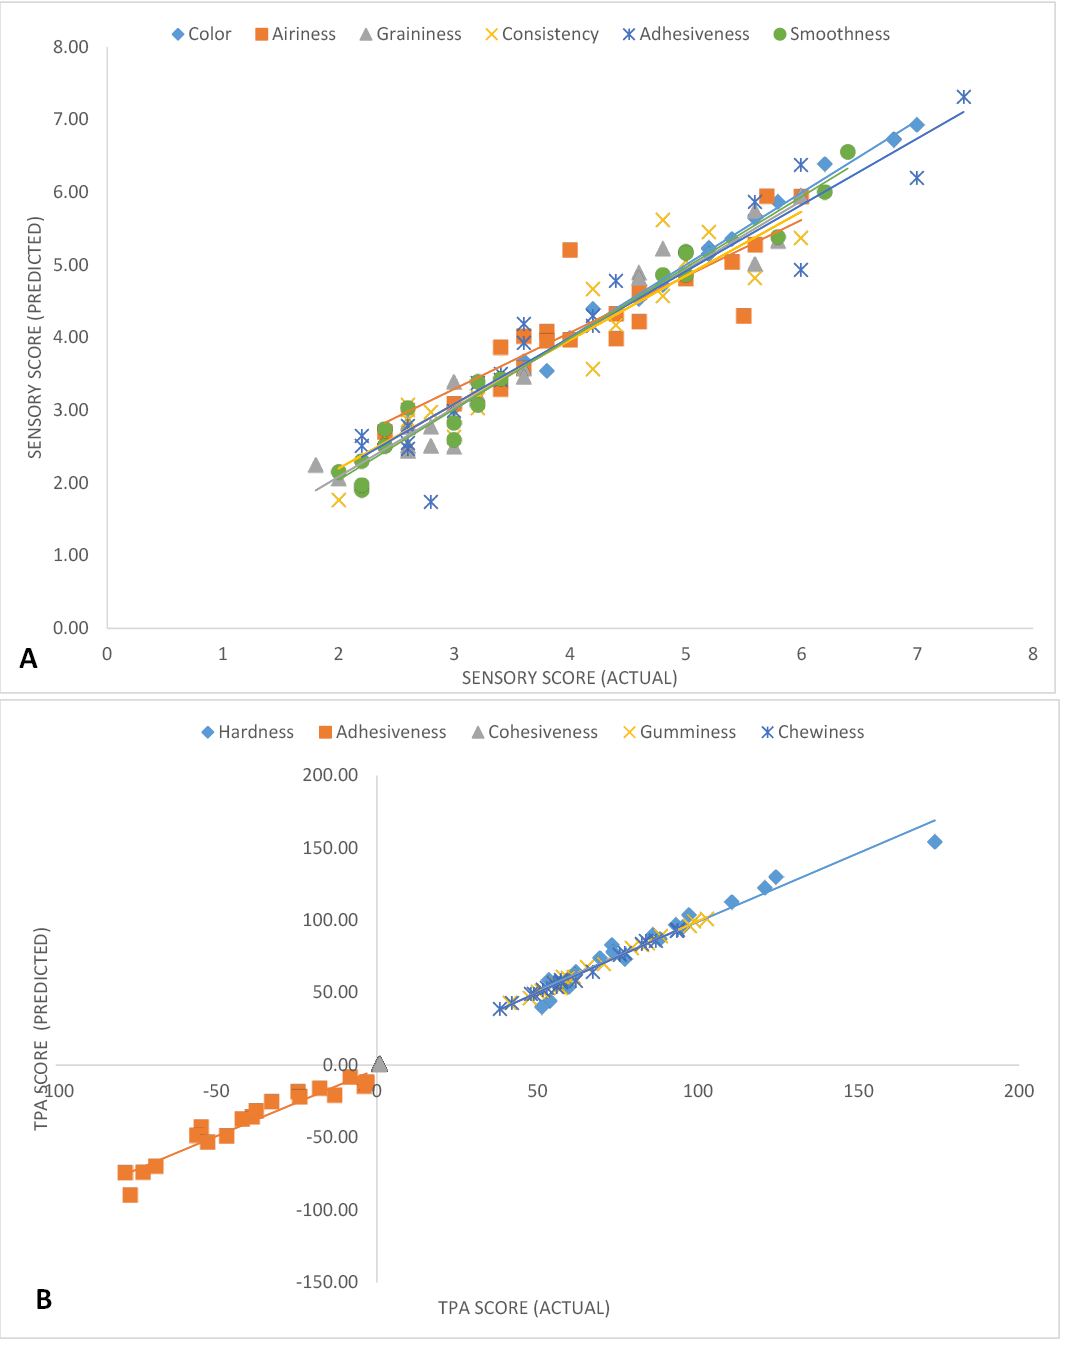
Figure 4:
Correlation between actual vs. predicted sensory score (A) an TPA Score (actual) (B).
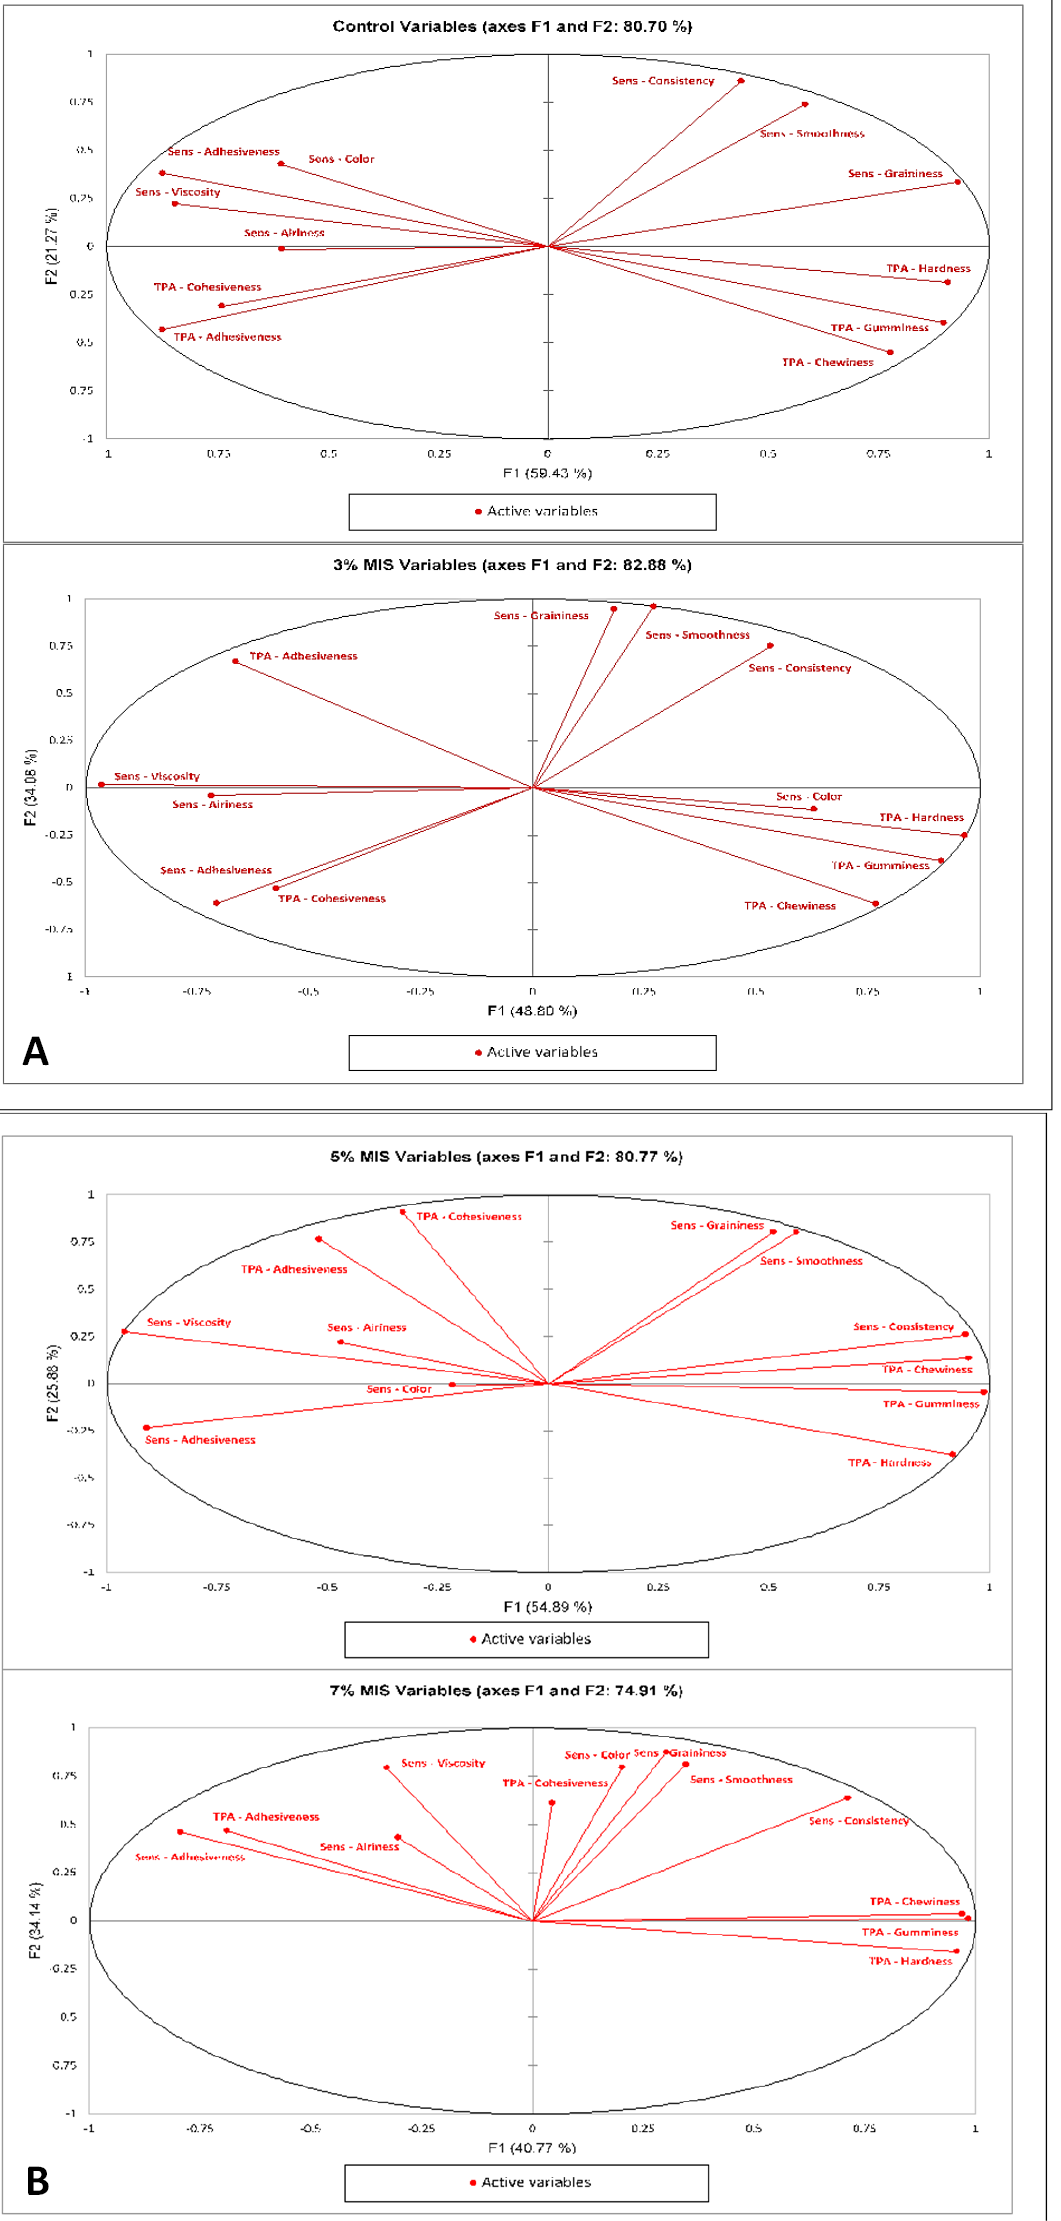
Figure 5:
From top to bottom: control 3% MIS (A) and 5% MIS (B) variables. Sens: sensory and TPA: Textural Profile Analysis.

June 2023
Vol.39, Iss. 2, Pages 298-572


