Spermicidal Activity of Gold Nanoparticles on Male Mice in Vitro
Spermicidal Activity of Gold Nanoparticles on Male Mice in Vitro
Heba Ali Salih*, Mohanad A. Al-Bayati
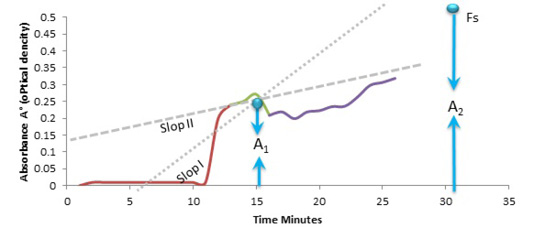
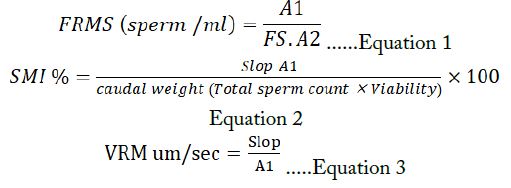
Turbidimetric analysis of sperm motility plotted a graph of sperm kinetic sperm motility modified from (Al-Bayaty, 1999) A1: the distance from the x-axis to the point of cross between slop tends of a fraction of rapidly moving sperm and plateau maintenance sperm curve A 2: the maximum distance between the axis to the point of absorbance of mixed semen suspensions. Slop 1: The slop one Rabidly Moving Sperm. Slop 2: Ordinary sperm moving. Fs: The total sperm count in the whole sample (sperm/ ml).
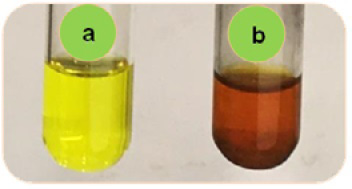
a: auric chloride working solution; b: Heparinized GNP red-brown color.
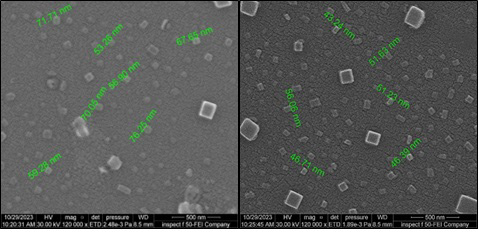
Scanning Electron Microscope (SEM) Micrograph of GNP Sample.
The surface charge and stability of Gold Nanoparticles by zeta potential.
acute lethal curve of Gold Nanoparticles: a. Relationships between log concentration of Gold Nanoparticles and Probit mortality. B. Relationships between log concentration of Gold Nanoparticles and Probit mortality.
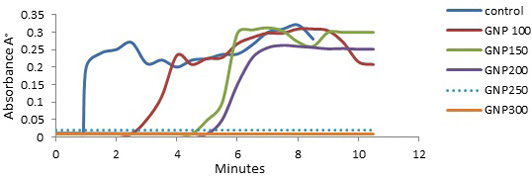
denoted to the timeline of motile sperm kinetic movement for serial exposure to GNP concentration, the non-waves lines in the curve referred to zero value of absorbance of immotile factions of semen.
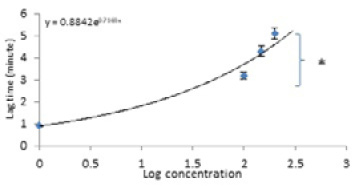
The Log concentrations Lag time (Minutes) relationship curve of mice sperm challenged Heparinized Gold Nano-particles. The data presented as SE ± Mean, the stares denoted to significant p≤0.05. n=5 mice semen suspensions.
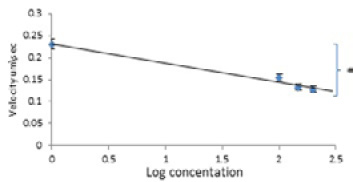
The Log concentrations velocity relationship curve of mice sperm challenged Heparinized Gold Nano-particles. The data presented as SE ± Mean, the stares denoted to significant p≤0.05. n=5 mice semen suspensions.
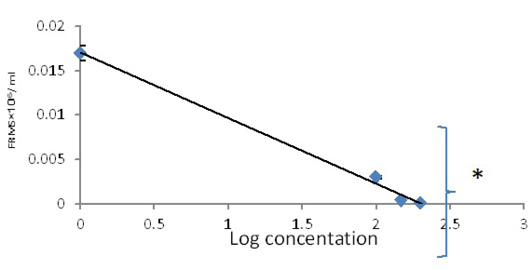
The Log concentrations fraction rapidly moving sperm relationship curve of mice sperm challenged Heparinized Gold Nano-particles (FRMS: Fraction of Rapidly Moving of Sperm) The dated presented as SE±Mean, the stares denoted to significant p≤0.05. n=5 mice semen suspensions.
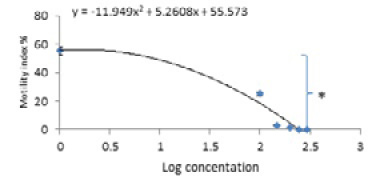
The Log concentrations Sperm motility index % relationship curve of mice sperm challenged Heparinized Gold Nano-particles The dated presented as SE ± Mean, the stares denoted to significant p≤0.05. n=5 mice semen suspensions The data presented as SE ± Mean, the stares denoted to significant p≤0.05. n=5 mice semen suspensions.
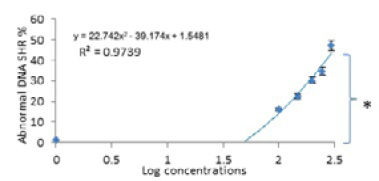
Concentration-response curve of the relationship between Histone Residues of sperm (Alanine Blue stain) with Log concentrations of GNPs, SHR: Sperm Histone Residue. The dated represented mean ± stander error, number of mice = 5, the star denoted significant p≤0.05.
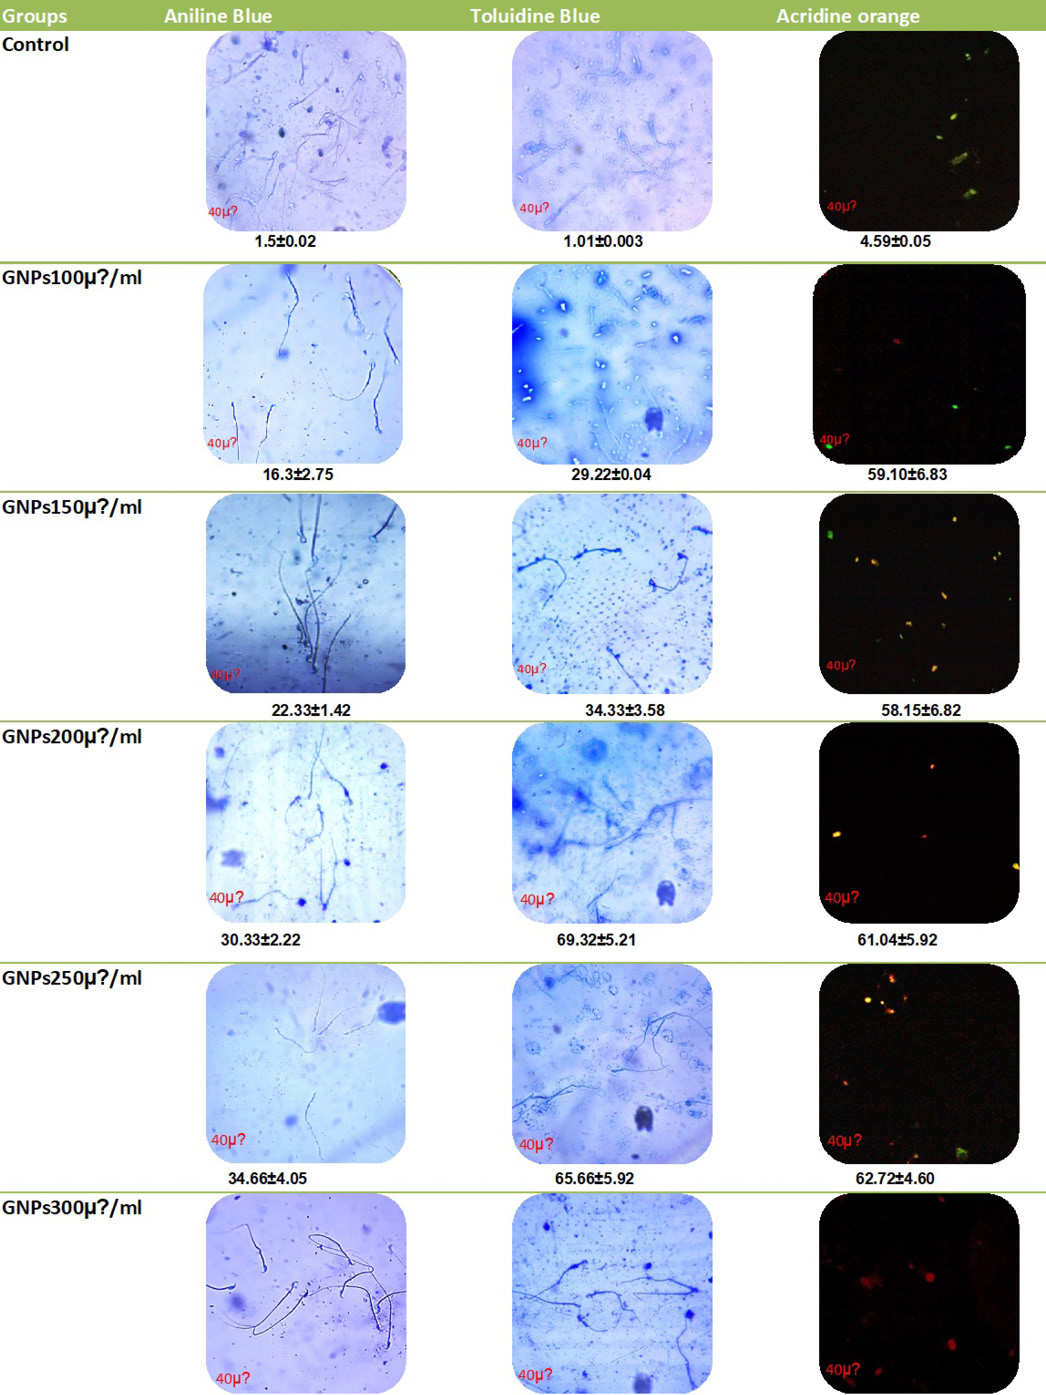
The DNA abnormality isolated epididymis of count sperm mice in vitro exposed to normal saline stained by Acridine orange, toluidine blue and aniline blue indicate for DNA abnormal , chromatin condensation and histone residue.
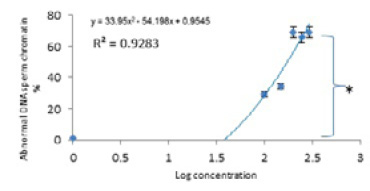
Concentration-response curve of Relationship between Chromatin (Toluidine Blue stain) with log concentration of GNPs. The dated represented mean ± stander error, number of mice = 5, the star denoted significant p≤0.05.
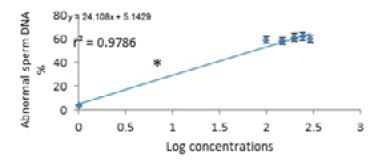
Concentration-response curve of Relationship between DNA abnormal (Acridine orange stain ) with log concentration of GNPs. The dated represented mean ± stander error, n = 5, and the star denoted significant p≤0.05
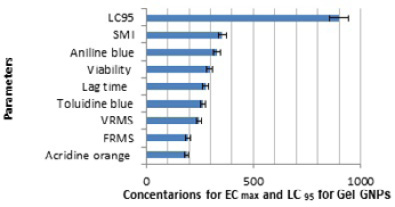
The potency of sperm-toxic GNP effect represented by the A. LC95 value.
X-ray pattern of Gold Nanoparticles and peak revealed crystalline.
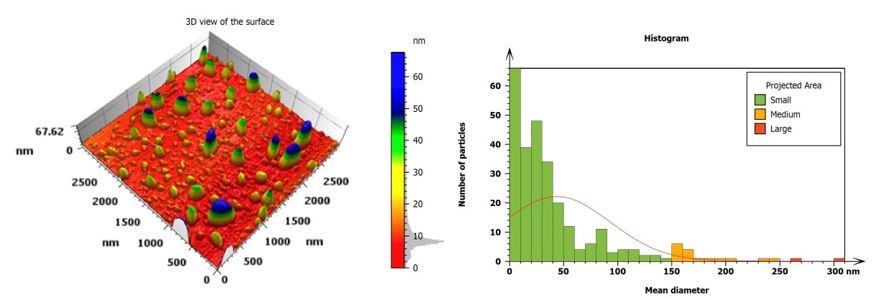
The range thickness, surface distance, and vertical distance of GNPs of (AFM).


