
Rats Subchronically Exposed to Deltamethrin Nanoformulations Exhibited Less Genotoxicity Compared with those Exposed to Deltamethrin


Rats Subchronically Exposed to Deltamethrin Nanoformulations Exhibited Less Genotoxicity Compared with those Exposed to Deltamethrin
Ahlam G. Khalifa1*, Walaa A. Moselhy1, Hanaa M. Mohammed2 and Khaled Abdou1

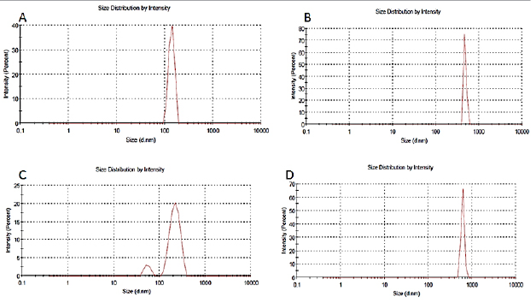
DLS measurements of particles size distributions after re-dispersion of silica powder (A), chitosan powder (B), silica loaded deltamethrin powder (C),and Chitosan loaded deltamethrin (D).
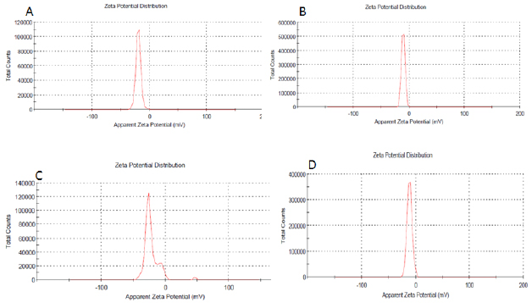
Zeta potential of silica NPs A, chitosan NPs B, S/DM Nps C, and CS/DM Nps D.
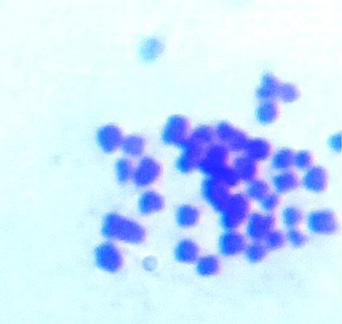
Metaphase spread of the bone marrow cells for the control rat.

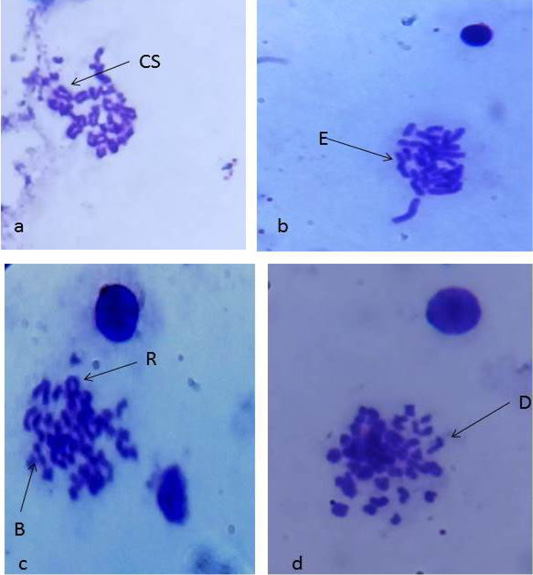
Metaphase spread from the rat bone marrow cells; after 30 days of S/DM Nps administration (a): metaphase spread showing centric separation (cs). (b): metaphase spread showing end-to-end association (E) and hypoploidy (c): metaphase spread showing break (B) and ring(R).(d):metaphase spread showing deletion (D).
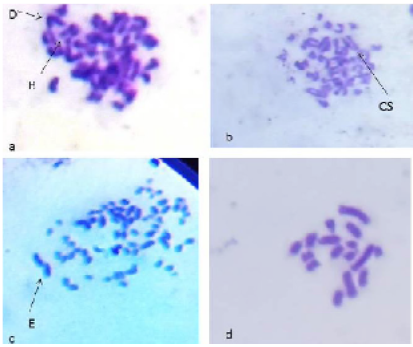
Metaphase spread from the rat bone marrow cells; after 30 days of CS/DM Nps administration (a): metaphase spread showing centric separation (cs). (b): metaphase spread showing deletion (D). (c): metaphase spread showing stickness (S). (d): metaphase spread showing ring(R).(e): metaphase spreads showing end to end association (E) and hyperploidy.

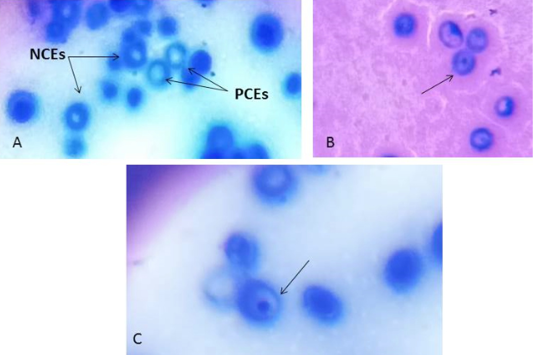
The different forms for the micronuclei in polychromatic erythrocytes of rats administered deltamethrin.

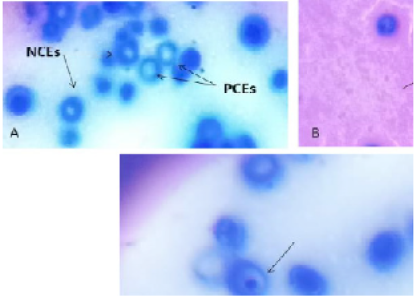
Microphotographs of polychromatic erythrocytes and normochromatic erythrocytes in control rats (A), polychromatic erythrocyte micronucleus in S/DM Nps administered rats(B) and CS/DM Nps (C).

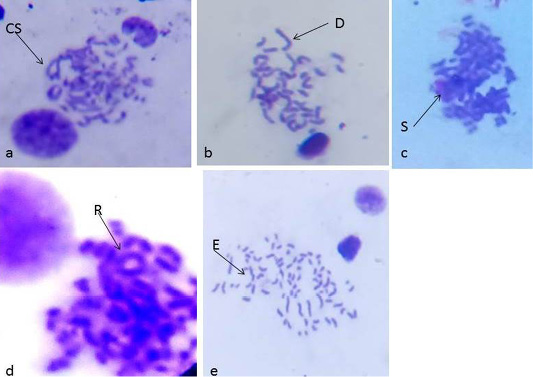
Metaphase spread from the rat bone marrow cells; after 30 days of deltamethrin administration (a): metaphase spread showing break (B) and deletion (D). (b): metaphase spread showing centric separation (cs). (c): metaphase spread showing end to end association (E) and hyperploidy.(d): metaphase spread showing hypoploidy.

