Quality and Consumer Acceptability of Cottage Cheese Prepared from the Blend of Cow and Goat Milk
Quality and Consumer Acceptability of Cottage Cheese Prepared from the Blend of Cow and Goat Milk
Aamara Ibrahim1, Ihsan Mabood Qazi1, Majid S. Hashmi1, Ayaz Ahmad1*, Hisham Javed1, Fawad Ahmad2 and Sadia Mukhtar1
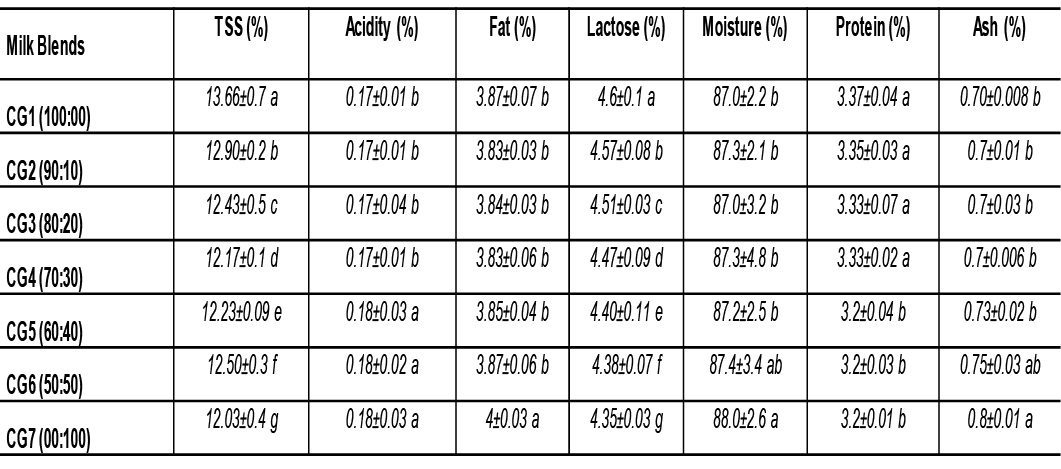
Compositional parameters of cottage cheese (TSS (%), Acidity (%), Fat (%), Lactose (%), Moisture (%), Protein (%), and Ash (%)) determined for blends of cow and goat milk at varying concentrations: CG1 (100:0), CG2 (90:10), CG3 (80:20), CG4 (70:30), CG5 (60:40), CG6 (50:50), and CG7 (0:100).
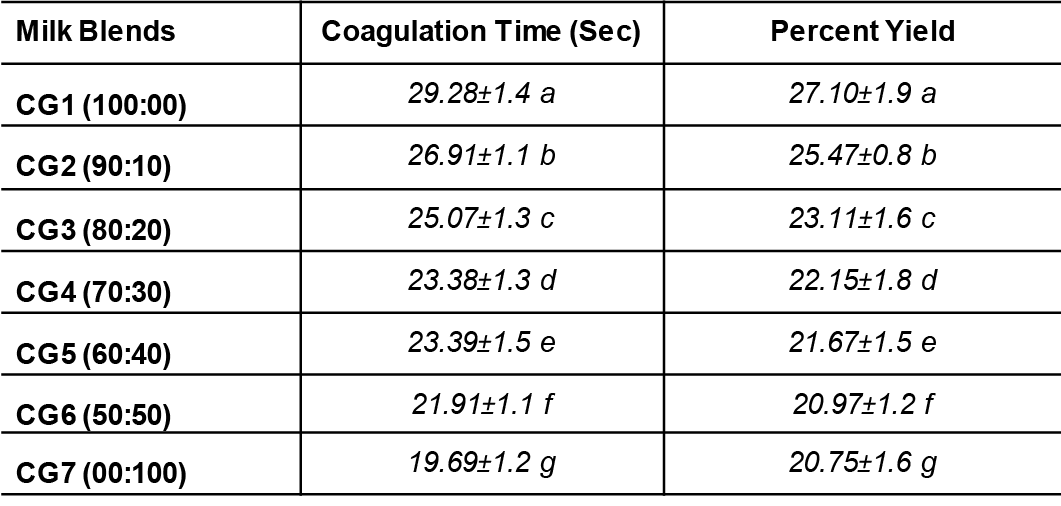
Coagulation time (sec) and Cheese yield (%) for cottage cheese made from blends of cow and goat milk at varying concentrations: CG1 (100:0), CG2 (90:10), CG3 (80:20), CG4 (70:30), CG5 (60:40), CG6 (50:50), and CG7 (0:100).
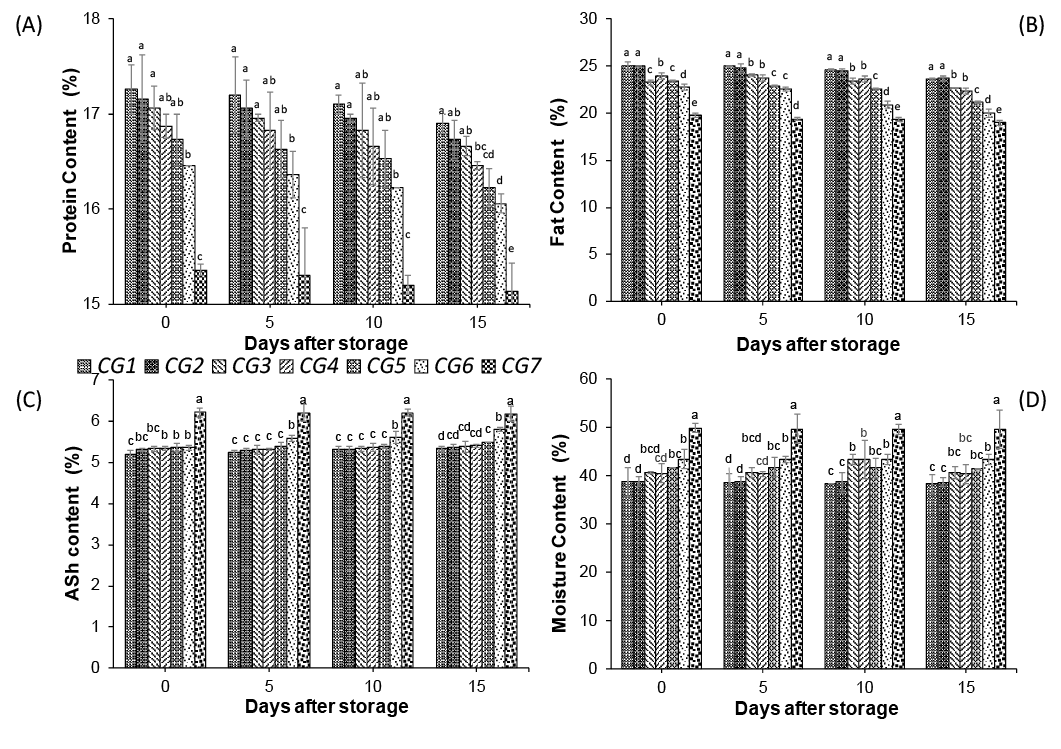
Effect of cow and goat milk blend in different concentrations CG1 (100:0), CG2 (90:10), CG3 (80:20), CG4 (70:30), CG5 (60:40), CG6 (50:50), CG7 (0:100) on (A) Protein content, (B) Fat content, (C) Ash content, and (D) Moisture content of cottage cheese during 15 days storage at 5±1oC. Vertical bars represent standard error of means for three replicates. Different letters show significant difference among mean values using LSD at (P ≤ 0.05).
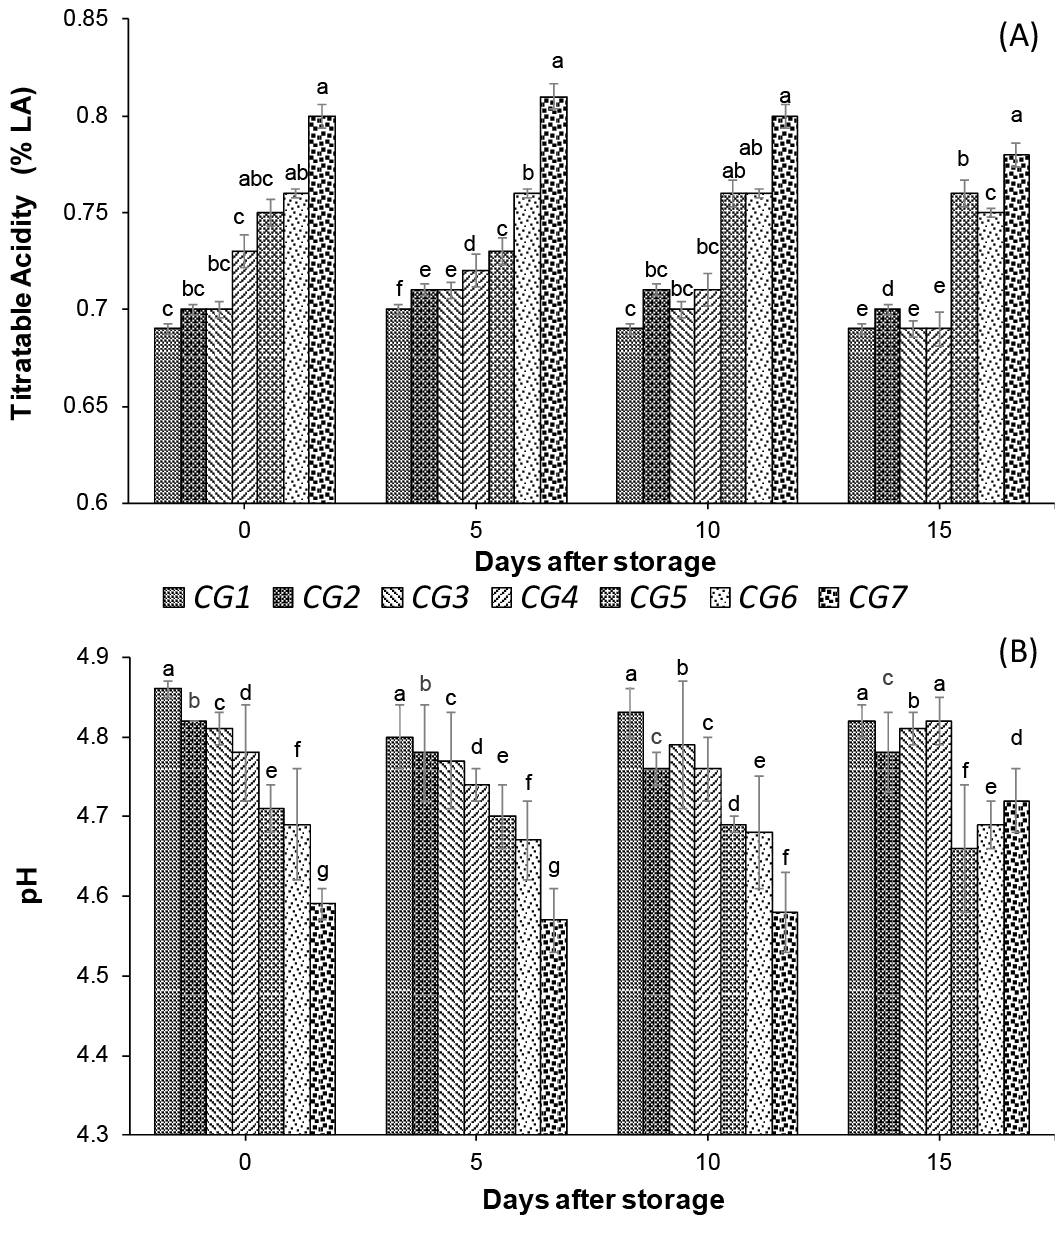
Effect of cow and goat milk blend in different concentrations CG1 (100:0), CG2 (90:10), CG3 (80:20), CG4 (70:30), CG5 (60:40), CG6 (50:50), CG7 (0:100) on (A) Acidity and (B) pH of cottage cheese during 15 days storage at 5±1oC. Vertical bars represent standard error of means for three replicates. Different letters show significant difference among mean values using LSD at (P ≤ 0.05).
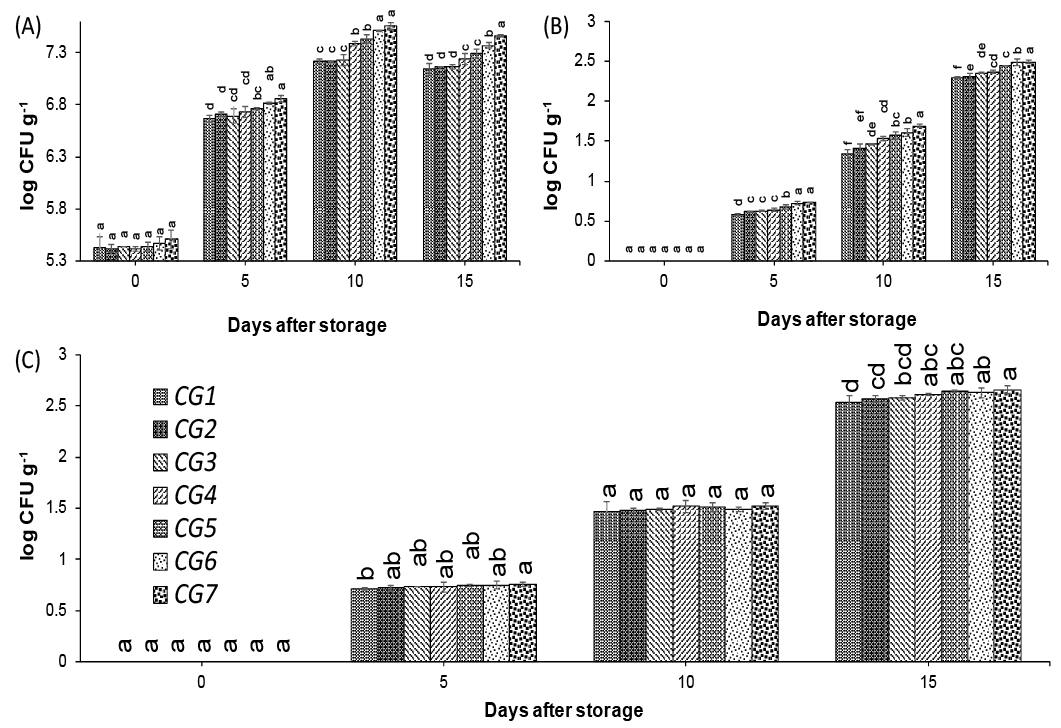
Effect of cow and goat milk blend in different concentrations CG1 (100:0), CG2 (90:10), CG3 (80:20), CG4 (70:30), CG5 (60:40), CG6 (50:50), CG7 (0:100) on (A) Total viable cell count, (B) Enterobacteriaceae, and (C) Ash content Yeasts and Molds of cottage cheese during 15 days storage at 5±1oC. Vertical bars represent standard error of means for three replicates. Different letters show significant difference among mean values using LSD at (P ≤ 0.05).
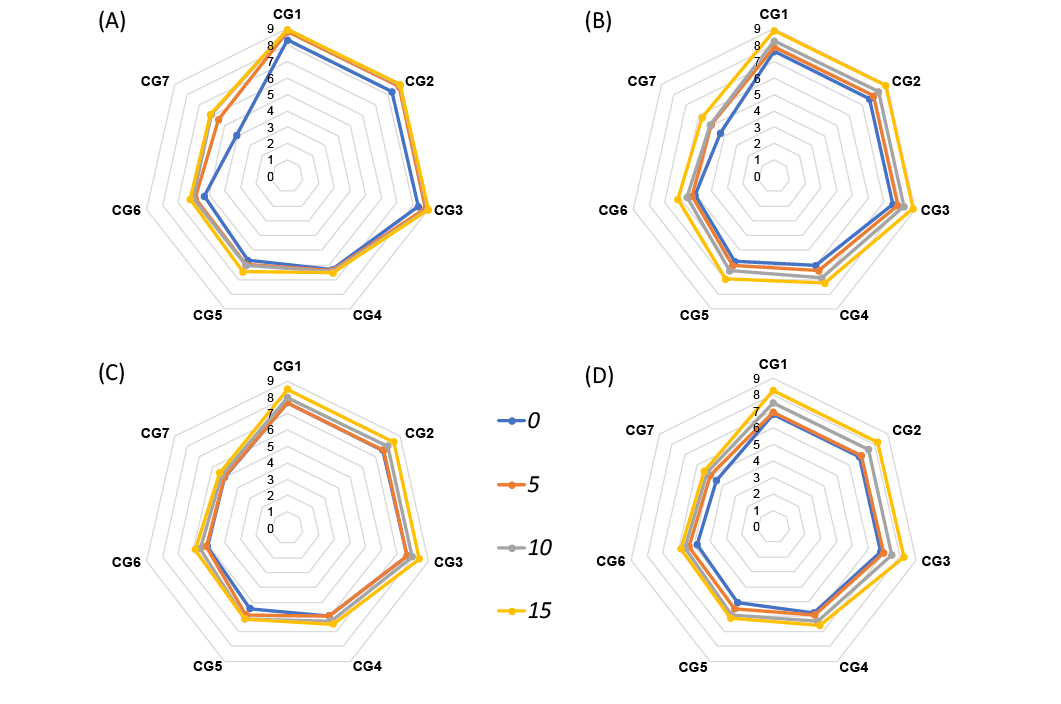
Effect of cow and goat milk blend in different concentrations CG1 (100:0), CG2 (90:10), CG3 (80:20), CG4 (70:30), CG5 (60:40), CG6 (50:50), CG7 (0:100) on (A) Color, (B) Aroma, (C) Taste, and (D) Texture of cottage cheese during 15 days storage at 5±1oC.
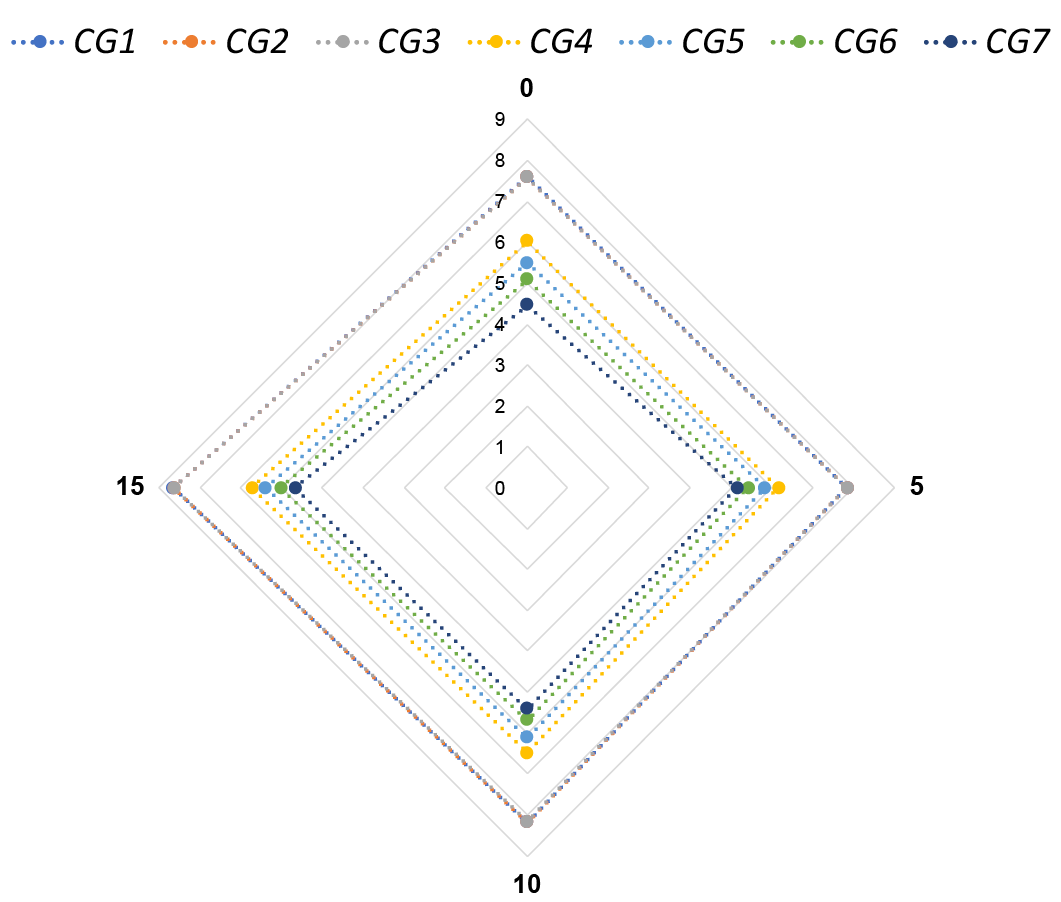
Effect of cow and goat milk blend in different concentrations CG1 (100:0), CG2 (90:10), CG3 (80:20), CG4 (70:30), CG5 (60:40), CG6 (50:50), CG7 (0:100) on Overall Acceptability of cottage cheese during 15 days storage at 5±1oC.


