
Predicting Egg Weight from Egg Quality Traits of the Lohmann Brown Chicken Breed Using Stepwise Regression


Research Article
Predicting Egg Weight from Egg Quality Traits of the Lohmann Brown Chicken Breed Using Stepwise Regression
Thobela Louis Tyasi*, Lebo Ngorima, Victoria Rankotsane Hlokoe
School of Agricultural and Environmental Sciences, Department of Agricultural Economics and Animal Production, University of Limpopo, Private Bag X1106, Sovenga 0727, Limpopo, South Africa.
Abstract | The best-fitted regression model determined using R2, RMSE, AIC and BIC can result in the egg quality traits that can best predict egg weight in chickens. The study aimed to develop a model that can be employed to estimate egg weight from egg quality traits with stepwise regression in the Lohmann brown chicken breed. The study was conducted at Kitamu farm in Ntsima village in Limpopo Province, South Africa. The Pearson’s correlation findings displayed that egg weight (EW) had a highly positive remarkable association (P < 0.01) with egg length (EL), yolk weight (YW), egg width (EWD), albumen weight (AW), shell surface area (SSA), albumen ratio (AR) and egg volume (EV), and a highly negative remarkable relationship (P < 0.01) with Y/A. Stepwise results revealed that the model, including EV, AW, SSA, EWD, EL, YW and AR, is the best-fitted regression model (R2 = 0.99, RMSE = 0.03, AIC = 14.17, BIC = 37.26) for estimation of egg weight in the Lohmann brown chicken breed. The study concludes that the improvement of EWD, YW, SSA, AW, AR, EV and EL might enhance the egg weight of the Lohmann chicken breed. The EV, AW, SSA, EWD, EL, YW and AR may be chosen when breeding for enhancement of egg weight in the Lohmann brown chicken. The study outcomes may assist farmers in the egg quality traits to consider during breeding to improve the egg weight of the Lohmann Brown chicken breed.
Keywords | Best-fitted model, Correlation, Egg length, Egg width, Shell weight
Received | November 04, 2022; Accepted | December 07, 2022; Published | February 05, 2024
*Correspondence | Thobela Louis Tyasi, School of Agricultural and Environmental Sciences, Department of Agricultural Economics and Animal Production, University of Limpopo, Private Bag X1106, Sovenga 0727, Limpopo, South Africa; Email: louis.tyasi@ul.ac.za
Citation | Tyasi TL, Ngorima L, Hlokoe VR (2024). Predicting egg weight from egg quality traits of the lohmann brown chicken breed using stepwise regression. Adv. Anim. Vet. Sci., 12(3):436-440.
DOI | https://dx.doi.org/10.17582/journal.aavs/2024/12.3.436.440
ISSN (Online) | 2307-8316
Copyright: 2024 by the authors. Licensee ResearchersLinks Ltd, England, UK.
This article is an open access article distributed under the terms and conditions of the Creative Commons Attribution (CC BY) license (https://creativecommons.org/licenses/by/4.0/).
INTRODUCTION
The Lohmann Brown chicken breed is a cross between lines of Rhode Island Red and White Rock breeds, with a high yield of eggs and a friendly temperament; it is mainly bred for egg production but can be used for meat purposes (Tutkun et al., 2018). Eggs are reservoirs of nutrition for embryos that are still developing and are also a source of protein for human beings (Liswaniso et al., 2021). An egg is a vital source of animal protein in the world and with an increasing human population, the demand for eggs is high (Raphulu et al., 2015). Hence, there is always a need for improvement in egg production in chickens to meet the demand by consumers. Stepwise regression is used to detect the most influencing variable (Smith, 2018). Stepwise regression analysis is the most widely used method for selecting a suitable regression equation (Landau and Everitt, 2017). Previous studies showed the importance of internal and external egg traits as estimators of egg size during the breeding of different Japanese quail strains, Isa Brown egg layer chickens in Nigeria and South-eastern Nigeria local chicken (Adeolu and Oleforuh-Okoleh, 2011; Chimezie et al., 2017; Ukwu et al., 2017). Liswaniso et al. (2021) also conducted a study on egg quality traits to estimate egg size in indigenous free-range chickens in Zambia.
However, the information on the use of the stepwise regression technique in egg size prediction using egg quality characteristics in the Lohmann Brown chicken breed is debatably unknown. Thus, the study’s objectives were to (1) evaluate the relationship between egg weight and egg quality traits of the Lohmann Brown chicken breed and (2) establish a model to predict egg weight from egg quality traits in the Lohmann Brown chicken breed using stepwise regression.
MATERIALS AND METHODS
Study site
The current study was conducted at Kitamu farm in Ntsima village, which is in the Limpopo Province, South Africa. The temperature ranges, rainfall patterns and coordinates are the same, as explained by Kutu and Asiwe (2010).
Experimental birds, management and study design
A total of 100 Lohmann Brown chicken breeds were utilised for the experiment. The birds were bought at 18 weeks and raised under an intensive production system. The laying mash was purchased from Angels feeds in Polokwane, South Africa. The chickens were raised following the ordinary husbandry practices of feeding systems, housing, vaccination and health care, as described by Alabi et al. (2012). The chicken house was cleaned seven days before the chickens arrived and disinfected with Virokill disinfectants to avoid transmission of pathogenic diseases to the chickens. The biosecurity protocols were followed in the area, where the footbaths with disinfectant were placed at the door for disinfecting before entering the chicken house. The drinkers and feeders were bought at NTK in Polokwane, South Africa. The stress pack was given to the chickens in drinking water on arrival after transportation to relieve stress. The chickens were fed the egg-laying mash for 18 weeks, and water was provided ad libitum. In the study, a cross-sectional design was employed.
Eggs collection
Two-hundred (200) fresh eggs were picked randomly from hundred (100) chickens aged 20 weeks to measure the physical egg quality traits. The eggs collected were taken to the laboratory to measure the physical egg characteristics.
Egg quality traits measurements
Egg weight (EW) and internal and external egg characteristics, including egg volume (EV), yolk/ albumen (Y/A), egg length (EL), shell weight (SW), eggshell index (ESI), yolk weight (YW), egg width (EWD), albumen weight (AW), unit surface shell weight (USSW), shell surface area (SSA), shell ratio (SR), albumen ratio (AR), yolk ratio (YR), were measured in the study. Internal and external egg characteristics were taken, as explained by Kgwatalala et al. (2013). In short, egg size and shell weight were measured with a weighing scale (Medidata®), whereas egg width and length were measured using a Vernier calliper (Mitutoyo®). Each egg was cautiously cracked out, with caution taken not to break down the membranes that enclose the albumen and the yolk. Albumen and yolk were then separated with an egg yolk separator, and the yolk weight was assessed with a weighing scale. Other internal and external egg characteristics involving albumen weight, shell surface area, unit shell surface weight, egg shell index and shell ratio were determined, as demonstrated by Markos et al. (2017).
Statistical analysis
The Statistical Package for Social Sciences version 27.0 (IBM SPSS, 2020) was used for data analysis. Descriptive statistics were computed for all the traits. The association among the traits was computed with Pearson’s Correlation. Stepwise regression was employed to establish the models for the estimation of egg weight from egg characteristics following the equation below.
Y = a + b1X1 +……. + bnXn
Where; Y= dependent variable (EW), a= intercept, b1 – b9 = coefficient of regression, and X1 – X9 = independent variables (egg quality traits).
The models’ accuracies were assessed by the determination coefficients (R2) and residual mean squared error (RMSE). Finally, the goodness of fit criteria was done to check the best model in this study. The following criteria were employed:
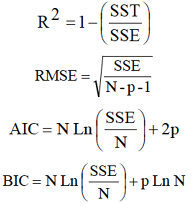
Where; R2= coefficient of determination; SST = is the total sum of square; SSE= is the residual sum of square; RMSE = is the residual mean square error; N= is the number of observations; P= is the number of parameters in the regression equation; AIC= is the Akaike information criterion; BIC= is the Bayesian information criterion; Ln = is the natural logarithm in calculator.
RESULTS and Discussion
Descriptive statistics
The summary of the measured traits is displayed in Table 1. The egg weight ranged from 55.84g to 78.30g, while measured egg quality traits ranged between 0.08 to 0.15.
Table 1: Descriptive statistics for egg weight and egg quality traits of the Lohmann brown chicken breed.
|
Traits |
Mean ± SE |
Maximum |
Minimum |
|
EW (g) |
65.67 ± 0.36 |
78.30 |
55.84 |
|
EL (mm) |
57.69 ± 0.18 |
63.38 |
50.63 |
|
EWD (mm) |
44.71 ± 0.09 |
47.45 |
42.19 |
|
SW (g) |
9.32 ± 0.07 |
14.82 |
7.69 |
|
YW (g) |
17.30 ± 0.09 |
20.05 |
12.86 |
|
AW (g) |
39.05 ± 0.31 |
50.23 |
32.26 |
|
ESI (%) |
77.63 ± 0.25 |
88.46 |
67.78 |
|
USSW (g/cm2) |
1.00 ± 0.00 |
0.15 |
0.08 |
|
SSA (cm2) |
91.70 ± 0.37 |
104.97 |
81.45 |
|
SR (%) |
14.25 ± 0.13 |
22.15 |
10.32 |
|
AR (%) |
59.34 ± 0.20 |
64.80 |
50.92 |
|
YR (%) |
26.41 ± 0.13 |
30.07 |
21.72 |
|
Y/A (%) |
44.72 ± 0.35 |
53.75 |
34.12 |
|
EV (cm3) |
52417.00±38783.20 |
67400.00 |
42300.00 |
EW: Egg weight, EL: Egg length, EWD: Egg width, SW: Shell weight, YW: Yolk weight, AW: Albumen weight, ESI: Egg shell index, USSW: Unit surface shell weight, SSA: Shell surface area, SR: Shell ratio, AR: Albumen ratio, YR: Yolk ratio, Y/A: Yolk/ albumen, EV: Egg volume, SE: Standard error.
Correlation between measured traits
The relationship between EW and egg characteristics is obtainable in Table 2. The outcomes revealed that EW had a highly positive remarkable association (P < 0.01) with EL, YW, EWD, AW, SSA, AR, and EV. The discoveries further revealed that EW had a negatively remarkable relationship (P < 0.05) with ESI, SR, YR and Y/A, and no association (P > 0.05) between EW and SW and USSW.
Stepwise regression models
The stepwise regression technique was used for the establishment of regression models for the estimation of BW in the Lohmann Brown chicken breed, and the regression models are displayed in Table 3. The four goodness of fit criteria, including the R2, RMSE, AIC and BIC, were employed to pick the good model. The models were formed with EW as a dependent trait and egg quality traits namely, EV, AW, SSA, EWD, EL, YW and AR, as independent variables. The outcomes displayed that the established models were significant at P < 0.01. The first entered egg quality trait was EV, which made a contribution of 86% to the variation of EW, with high RMSE, AIC and BIC. The second trait entered into the model was AW, and the model explained 96% of the variation of EW. The third trait included in the model was SSA, and the findings showed a contribution of 96% to the variation of EW, while EWD was added as the fourth trait and the findings showed a contribution of 97% to the variation of EW. Furthermore, the following trait entered was the EL and the outcomes displayed a contribution of 97% to the variation of EW, while the sixth model showed that the addition of YW explained 98% of the variation of EW. The last trait entered was AR and the results revealed a contribution of 99% to the variation of EW and a lower RMSE and AIC, with a BIC of 37.26.
Table 2: Correlation coefficients between internal and external egg quality traits of the Lohmann Brown chicken breed
|
Traits |
EW |
EL |
EWD |
SW |
YW |
AW |
ESI |
USSW |
SSA |
SR |
AR |
YR |
Y/A |
EV |
|
EW (g) |
||||||||||||||
|
EL (mm) |
0.74** |
|||||||||||||
|
EWD (mm) |
0.76** |
0.25 |
||||||||||||
|
SW (g) |
0.20 |
0.12 |
0.10 |
|||||||||||
|
YW (g) |
0.60** |
0.51** |
0.50** |
0.15 |
||||||||||
|
AW (g) |
0.93** |
0.67** |
0.72** |
-0.10 |
0.34* |
|||||||||
|
ESI (mm) |
-0.30* |
-0.81** |
0.40* |
-0.10 |
-0.21 |
-0.22 |
||||||||
|
USSW (g/cm2) |
-0.29 |
-0.23 |
-0.26 |
0.83** |
-0.07 |
-0.51** |
0.10 |
|||||||
|
SSA (cm2) |
0.94** |
0.68** |
0.70** |
0.30* |
0.54** |
0.90** |
-0.24 |
-0.30* |
||||||
|
SR (%) |
-0.44* |
-0.35* |
-0.41* |
0.80** |
-0.23 |
-0.63** |
0.10 |
0.95** |
-0.36* |
|||||
|
AR (%) |
0.56** |
0.37* |
0.45* |
-0.50** |
-0.16 |
0.81** |
-0.08 |
-0.75** |
0.50** |
-0.78** |
||||
|
YR (%) |
-0.43* |
-0.24 |
-0.30* |
-0.03 |
0.47* |
-0.63** |
0.04 |
0.24 |
-0.41* |
0.24 |
-0.80** |
|||
|
Y/A (%) |
-0.50** |
-0.30* |
-0.38* |
0.20 |
0.36* |
-0.74** |
0.07 |
0.48* |
-0.46* |
0.50** |
-0.93** |
0.96** |
||
|
EV (cm3) |
0.93** |
0.63** |
0.91** |
0.10 |
0.59** |
0.88** |
-0.07 |
-0.30* |
0.84** |
0.48* |
0.53** |
-0.36* |
-0.44* |
* Correlation significant (P < 0.05) and **correlation significant (P < 0.01), EW: Egg weight, EL: Egg length, EWD: Egg width, SW: Shell weight, YW: Yolk weight, AW: Albumen weight, ESI: Egg shape index, USSW: Unit surface shell weight, SSA: Shell surface area, SR: Shell ratio, AR: Albumen ratio, YR: Yolk ratio, Y/A: Yolk/ albumen, EV: Egg volume.
Table 3: Regression models, coefficient of determination (R2) and residual mean square error (RMSE) for prediction of EW in Lohmann Brown chicken breed.
|
Models |
R2 |
RMSE |
AIC |
BIC |
P value |
|
EW=19.85+8.74EV |
0.86 |
3.67 |
21.24 |
24.54 |
0.00 |
|
EW=18.77+4.29EV+0.63AW |
0.93 |
1.91 |
13.98 |
20.57 |
0.00 |
|
EW=-0.17+2.91EV+0.38AW+0.39SSA |
0.96 |
1.00 |
11.20 |
21.10 |
0.00 |
|
EW=31.64+5.37EV+0.33AW+0.36SSA-0.89EWD |
0.97 |
0.82 |
12.24 |
25.43 |
0.00 |
|
EW=100.47+9.67EV+0.31AW+0.38SSA-2.43EWD-0.41EL |
0.97 |
0.82 |
14.19 |
30.68 |
0.00 |
|
EW=179.36+1.28EV+0.53AW+0.32SSA-4.15EWD-0.99EL+0.67YW |
0.98 |
0.53 |
14.69 |
34.48 |
0.00 |
|
EW=-9.17-3.95EV+1.51AW+0.03SSA+1.46EWD+0.40EL+0.06YW-0.95AR |
0.99 |
0.03 |
14.17 |
37.26 |
0.00 |
EW: Egg weight, EL: Egg length, EWD: Egg width, SW: Shell weight, YW: Yolk weight, AW: Albumen weight, ESI: Egg shape index, USSW: Unit surface shell weight, SSA: Shell surface area, SR: Shell ratio, AR: Albumen ratio, YR: Yolk ratio, Y/A: Yolk/ albumen, EV: Egg volume, (AIC) Akaike information criterion, and BIC: Bayesian information criterion.
According to Liswaniso et al. (2021), egg characteristics are the best estimators of egg size in chickens. The study was carried out to establish the good fit model for the prediction of egg size. Pearson’s correlation was employed first to evaluate the relationship between egg size and egg characteristics in the Lohmann Brown chicken breed. The outcomes disclosed that egg size had a positively highly remarkable relationship with egg width, egg volume, egg length, shell surface area, yolk weight, albumen weight and albumen ratio. The results further displayed a negative remarkable association among egg weight and shell ratio, yolk ratio, eggshell index and yolk/albumen. The outcomes of the study are in harmony with the outcomes of the previous study on Isa Brown egg layer chickens in Nigeria, French broiler Guinea fowl and in indigenous Sakini chicken (Ukwu et al., 2017; Dzungwe et al., 2018; Saroj et al., 2020), who found that egg weight had a remarkable association with egg width, shell surface area, albumen weight, albumen ratio, yolk weight, egg volume and egg length. Monira et al. (2003) reported that the best estimators of egg size are egg width and length in comparison to eggshell index in White Leghorn, White Rock layers, Barred Plymouth Rock and Rhode Island Red, which agrees with the results of this study. The outcomes of this study suggest that enhancement of egg length, yolk weight, albumen weight, egg width, albumen ratio, shell surface area and egg volume might improve egg size in the Lohmann Brown chicken breed. According to Hlokoe et al. (2022), once traits are positively related, it implies that they are regulated by a similar gene.
Pearson’s correlation technique only displays the association between the traits and not the contribution of each trait to the variation of the dependent variable (Tadele et al., 2018). The stepwise regression technique was further employed to construct the models to be used for the estimation of egg weight in the Lohmann Brown chicken breed, where egg weight was used as a dependent variable and egg characteristics involving egg length, egg volume, yolk weight, egg width, albumen weight, albumen ratio, shell surface area, eggshell index, yolk ratio, shell ratio and yolk/albumen as independent variables. The best fit model for the prediction of egg size was determined by RMSE, R2, AIC and BIC. Regression findings displayed that egg volume alone made the smallest contribution to the variation of egg weight in the Lohmann Brown chicken breed. The results further revealed that the model, including egg volume, albumen weight, shell surface area, egg width, yolk weight, egg length and albumen ratio had the greatest coefficient of determination, least residual mean square error and Akaike information criterion, thus, it was selected as the good fit model for prediction of egg size in the Lohmann Brown chicken breed. The study outcomes are in harmony with the discoveries of the previous study on the Potchefstroom Koekoek chicken genotype (Hlokoe and Tyasi, 2021). The study outcomes recommend that egg weight might be estimated precisely with more egg characteristics. Hence, egg volume, albumen weight, shell surface area, egg width, yolk weight, egg length and albumen ratio might be selected together for the estimation of egg weight in the Lohmann Brown chicken breed. The results also showed that 99% of the differences in egg weight was explained by one model. Celik et al. (2017) found that the egg characteristics that influence egg size are albumen weight, shell weight and yolk weight in quail. More studies are required to investigate the good fit equations for predicting egg size in other chicken breeds and the additional sample size of the Lohmann Brown chicken breed.
CONCLUSIONS and Recommendations
The association outcomes revealed a correlation between egg size and egg characteristics involving egg length, yolk weight, albumen weight, egg width, albumen ratio, shell surface area and egg volume in the Lohmann Brown chicken breed. Therefore, improving egg length, yolk weight, egg width, albumen weight, shell surface area, albumen ratio and egg volume might enhance egg weight in the Lohmann Brown chicken breed. The stepwise regression findings revealed that the model, including egg volume, albumen weight, shell surface area, egg width, yolk weight, egg length and albumen ratio had the highest R2, lowest RMSE and AIC, therefore, it was selected as the good fit model for predicting egg size in the Lohmann Brown chicken breed.
Novelty Statement
This study revealed that the stepwise linear regression model might be useful for the prediction of egg weight using some egg quality traits.
AUTHOR’S CONTRIBUTION
All authors have designed the plan of study and supervised all the steps. They have read and approved the publishing of the manuscript.
Ethical approval
An ethical consent certificate was attained from the University of Limpopo Animal Research Ethics Committee (ULAREC) prior to the commencement of the current study. All methods were done following the principles and procedures set by the University of Limpopo Animal Research Ethics Committee.
Conflict of interest
The authors have declared no conflict of interest.
REFERENCES
Adeolu AI, Oleforuh-Okoleh VU (2011). Phenotypic relations between egg weight and other egg quality traits of south-eastern Nigeria local chicken. Niger. J. Anim. Prod., 7: 15-19.
Alabi OJ, Ng’ambi JW, Norris D, Egena SSA (2012). Comparative study of three indigenous chicken breeds of South Africa: Body weight and linear body measurements. Agric. J., 7(3): 220-225. https://doi.org/10.3923/aj.2012.220.225
Celik S, Sengul T, Inci H, Sodut B, Sengul AY, Kuzu CD, Tugay Ayasan T (2017). Estimation of egg weight from some external and internal quality characteristics in quail by using various data mining algorithms. Indian J. Anim. Sci., 87(12): 1524-1530. https://doi.org/10.56093/ijans.v87i12.79871
Chimezie VO, Fayeye TR, Ayorinde KL, Adebunmi A (2017). Phenotypic correlations between egg weight and some egg quality traits in three varieties of Japanese quail. Agro Search, 1: 44-53. https://doi.org/10.4314/agrosh.v17i1.4
Dzungwe JT, Gwaza D, Egahi JO (2018). Phenotypic correlation between egg weight and egg linear measurements of the French broiler guinea fowl raised in the humid zone of Nigeria. Curr. Trends Biostat. Biometr., 1. https://doi.org/10.32474/CTBB.2018.01.000104
Hlokoe VR, Mokoena K, Tyasi TL (2022). Using multivariate adaptive regression splines and classification and regression tree data mining algorithms to predict body weight of Nguni cows. J. Appl. Anim. Res., 50(1): 534-539. https://doi.org/10.1080/09712119.2022.2110498
Hlokoe VR, Tyasi TL (2021). Direct and indirect effects of egg quality traits on egg weight of Potchefstroom Koekoek chicken genotype. Int. J. Vet. Sci., 10(4): 280-285. https://doi.org/10.47278/journal.ijvs/2021.053
IBM SPSS (2020). Statistical packages for social sciences for windows: base system user’s guide, IBM statistics, 27. Chicago: SPSS Inc.
Kgwatalala PM, Bolebano L, Nsoso SJ (2013). Egg quality characteristics of different varieties of domesticated helmeted guinea fowl (Numida meleagris). Int. J. Poult. Sci., 12(4): 245-250. https://doi.org/10.3923/ijps.2013.245.250
Kutu FR, Asiwe JAN (2010). Assessment of maize and dry bean productivity under different intercrop systems and fertilization regimes. Afr. J. Agric. Res., 5: 1627-1631.
Landau S, Everitt BS (2017). A handbook of statistical analyses using SPSS.
Liswaniso S, Qin N, Tyasi TL, Chimbaka IM (2021). Use of data mining algorithms chaid and cart in predicting egg weight from egg quality traits of indigenous free-range chickens in Zambia. Adv. Anim. Vet. Sci., 9(2): 215-220. https://doi.org/10.17582/journal.aavs/2021/9.2.215.220
Markos S, Belay B, Astatkie T (2017). Evaluation of egg quality traits of the three indigenous chicken ecotypes kept under farmer’s management conditions. Int. J. Poult. Sci., 16: 180-188. https://doi.org/10.3923/ijps.2017.180.188
Monira KN, Salahuddin M, Miah G (2003). Effect of breed and holding period on egg quality characteristics of chicken. Int. J. Poult. Sci., 2: 261-263. https://doi.org/10.3923/ijps.2003.261.263
Raphulu T, Jansen van Rensburg C, Van Ryssen JBJ (2015). Assessing nutrient adequacy from the crop contents of free-ranging indigenous chickens in rural villages of the Venda region of South Africa. S. Afr. J. Anim. Sci., 45: 143-152. https://doi.org/10.4314/sajas.v45i2.5
Saroj S, Mana RK, Naba RD, Neena AG, Nirajan B (2020). Evaluation of external and internal egg quality traits of indigenous Sakini chicken in different generations of selection. Int. J. Agric. Sci. For., 10: 41-48.
Smith G (2018). Step away from stepwise. J. Big Data, 5(1): 1-12. https://doi.org/10.1186/s40537-018-0143-6
Tadele A, Melesse A, Taye M (2018). Phenotypic and morphological characterizations of indigenous chicken populations in Kaffa Zone, South-Western Ethiopia. Anim. Husb. Dairy Vet. Sci., 2(1): 2-9. https://doi.org/10.15761/AHDVS.1000128
Tutkun M, Denli M, Demirel R (2018). Productivity and egg quality of two layer hybrids kept in free-range system. Turk. J. Agirc. Sci. Technol., 6(10): 1444-1447. https://doi.org/10.24925/turjaf.v6i10.1444-1447.2070
Ukwu HO, Ezihe CO, Asaa SK, Anyogo ME (2017). Effect of egg weight on external and internal egg quality traits of Isa Brown egg layer chickens in Nigeria. Anim. Sci. Vet. Med., 2: 126-132. https://doi.org/10.31248/JASVM2017.051
To share on other social networks, click on any share button. What are these?


