Molecular Identification of Serratia marcescens Isolated from Milk and Detection of Beta-Lactam Resistance Genes
Molecular Identification of Serratia marcescens Isolated from Milk and Detection of Beta-Lactam Resistance Genes
Lubna M. Abdul Kareem*, Ali B. Al-Deewan
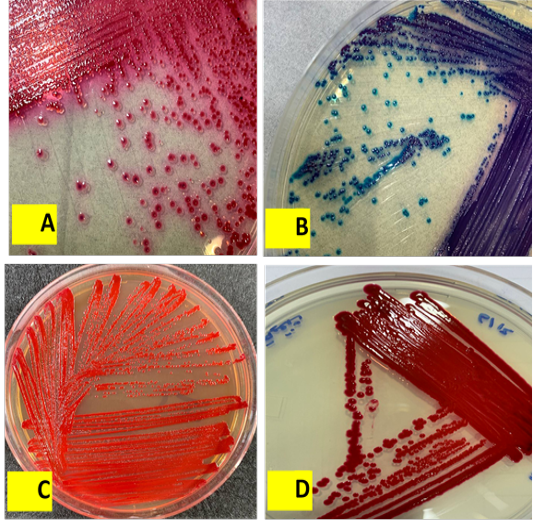
Cultivation of Serratia marcescens on differential media. A, Serratia marcescens on chrome agar colonies appeared pink with a dark center at 30 °C. B, on chrome agar colonies, appeared blue to purple at 37 °C. C, on MacConkey agar colonies, appeared red and exhibited lactose fermentation. D, on nutrient agar colonies at 30 °C, appeared red like blood.
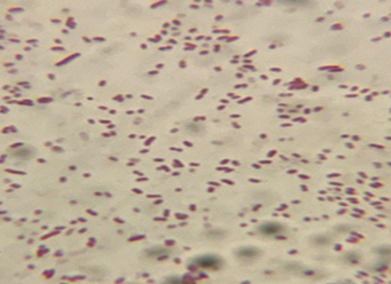
Serratia marcescens stained by gram stain.
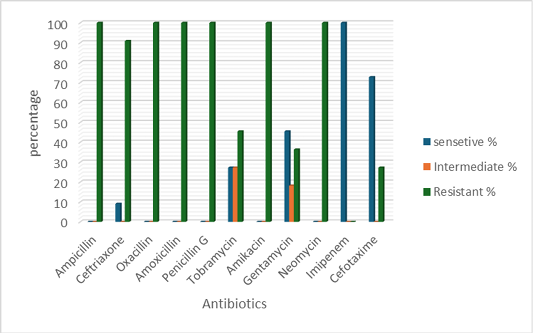
Results of antibiotic susceptibility test of all Serratia marcescens.
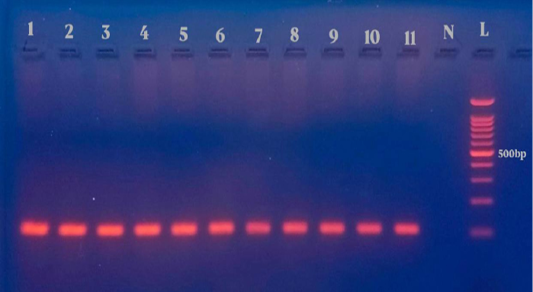
Results of Serratia specific PCR, The size of the PCR product is 107bp, L: marker DNA ladder 100bp, N: negative control. Lines (1, 2, 3, 4, 5, 6, 7, 8, 9, 10, 11) represent samples.
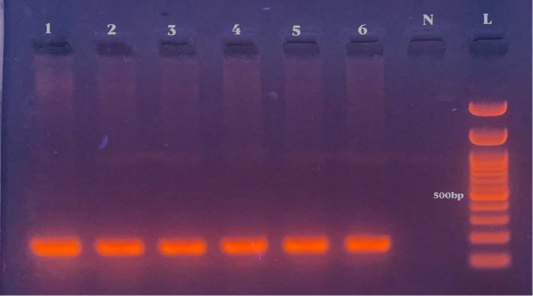
Results of bsmB gene, the size of the PCR product is 200bp, L: marker DNA ladder 100bp, N: negative control. Lines (1, 2, 3, 4, 5, 6) represent samples.
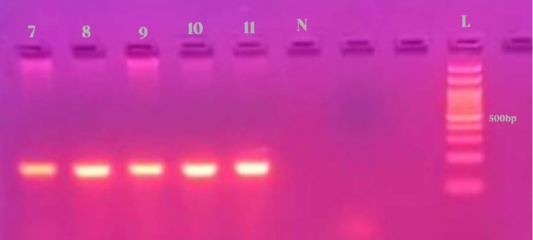
Results of bsmB gene, the size of the PCR product is 200bp, L: marker DNA ladder 100bp, N: negative control. Lines (7, 8, 9, 10, 11) represent samples.
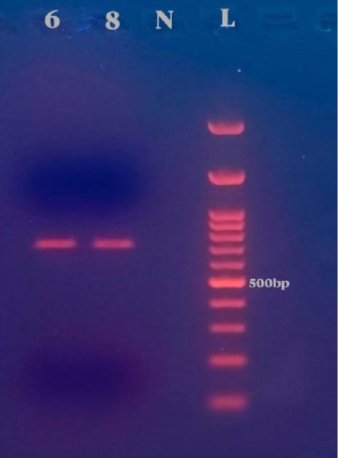
Results of blaSHV gene, the size of the PCR product is 712bp, L: marker DNA ladder 100bp, N: negative control. Lines (6, 8) represent samples.
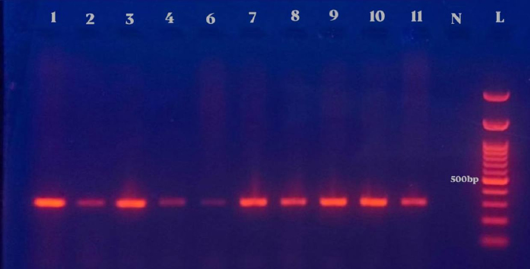
Results of blaTEM gene, the size of the PCR product is 296bp, L: marker DNA ladder 100bp, N: negative control. Lines (1, 2, 3, 4, 6, 7, 8, 9, 10, 11) represent samples.
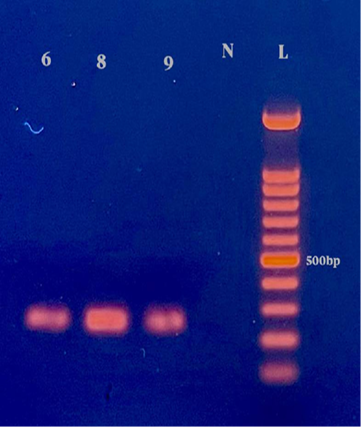
Results of blaCTX-M1 gene, the size of the PCR product is 216bp, L: marker DNA ladder 100bp, N: negative control. Lines (6, 8, 9) represent samples.
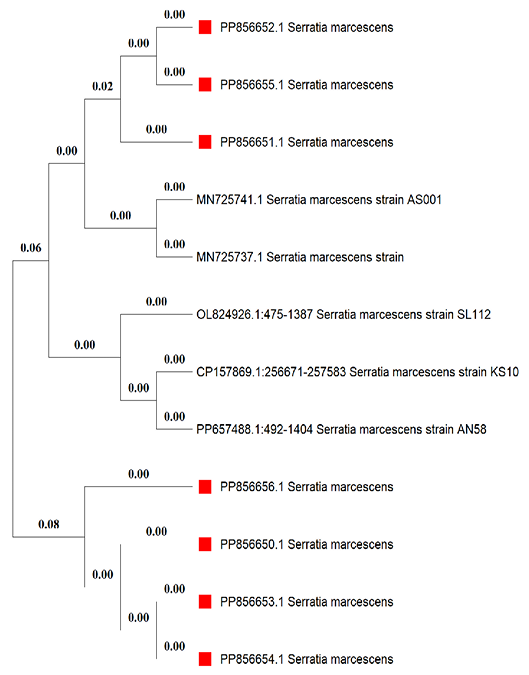
Phylogenetic analysis using the maximum likelihood approach of the local isolates and the closely related isolates from the NCBI database. The red square represents the local isolates.
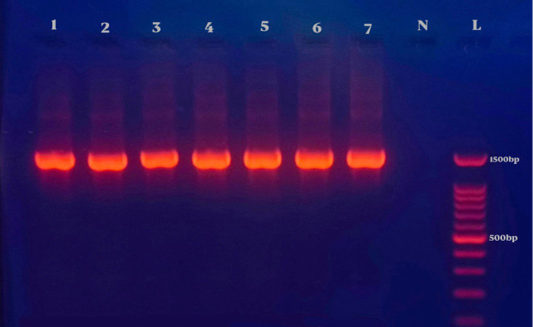
Results of Serratia 16s RNA gene, The size of the PCR product is 1500bp, L: marker DNA ladder 100bp, N: negative control. Lines (1, 2, 3, 4, 5, 6, 7) represent samples.


