Microsatellite and Skull Morphology Analysis of Tupaia belangeri chinensis in Yunnan Province
Microsatellite and Skull Morphology Analysis of Tupaia belangeri chinensis in Yunnan Province
Yue Ren1, Ting Jia2, Hao Zhang1, Zhengkun Wang1 and Wanlong Zhu1*
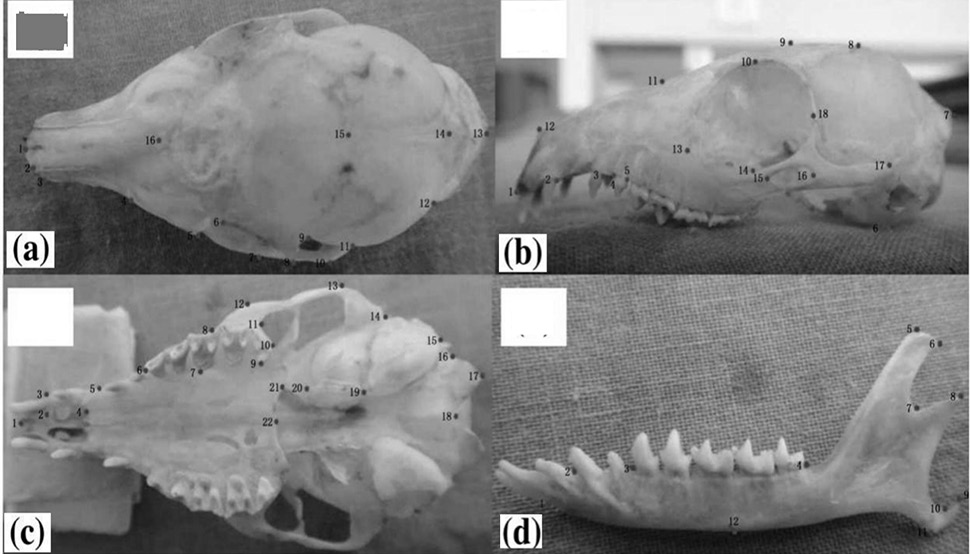
T. belangeri chinensis landmark configurations of dorsal cranium (a), ventral cranium (b), lateral cranium (c) and lateral mandible (d).
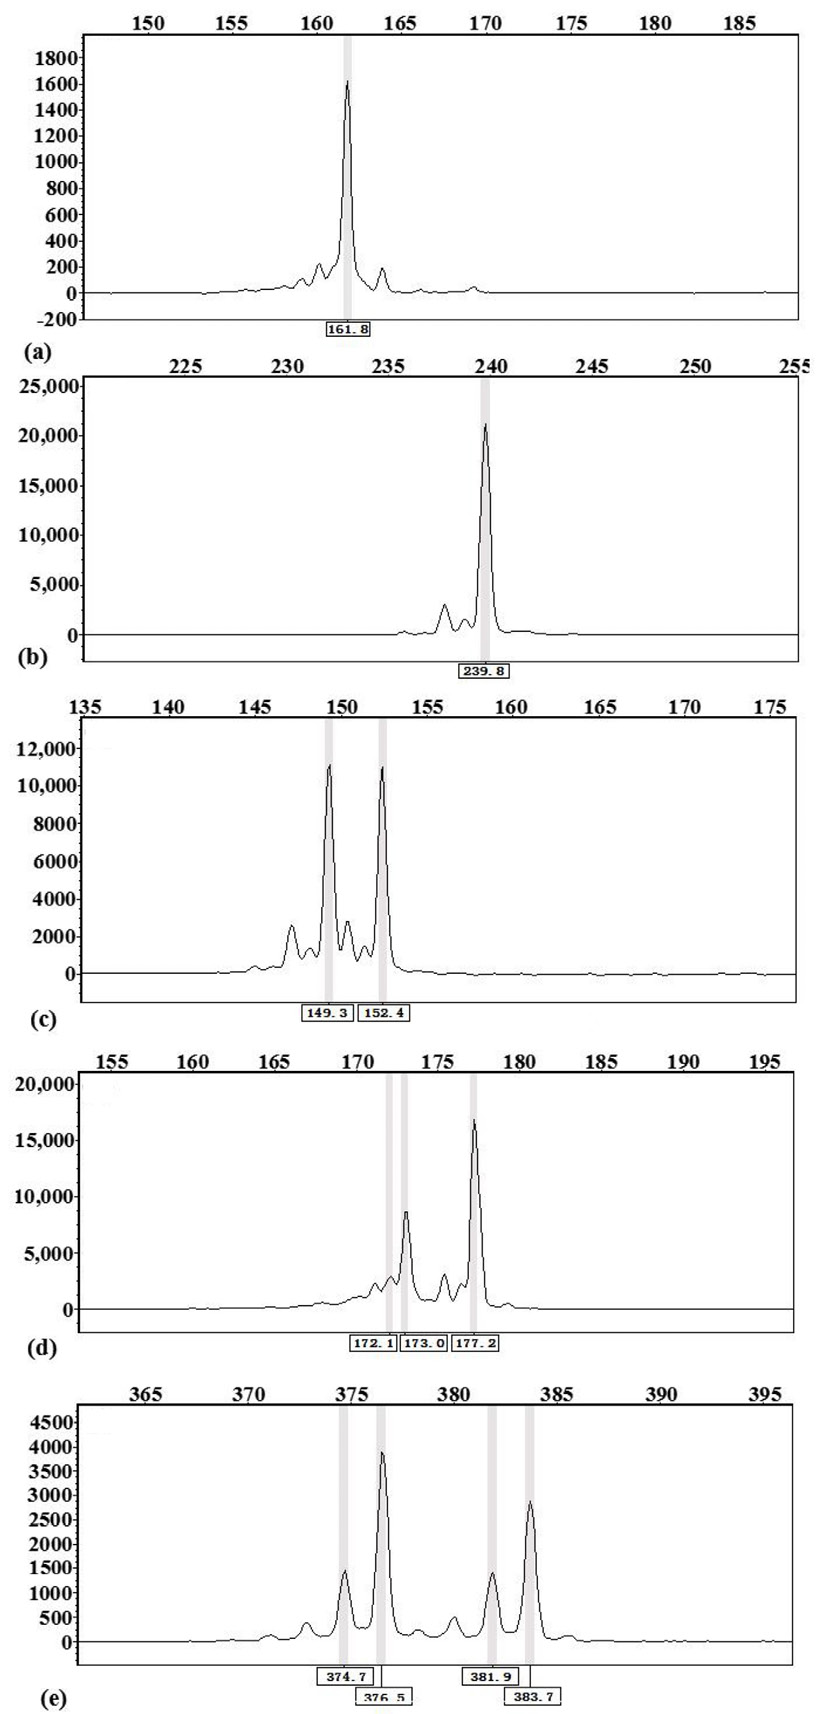
The result of genotypic alleles of TBC3 locus (a), TBC8 locus (b), TBC1 locus (c), TG4 locus (d) and TG19 locus (e).
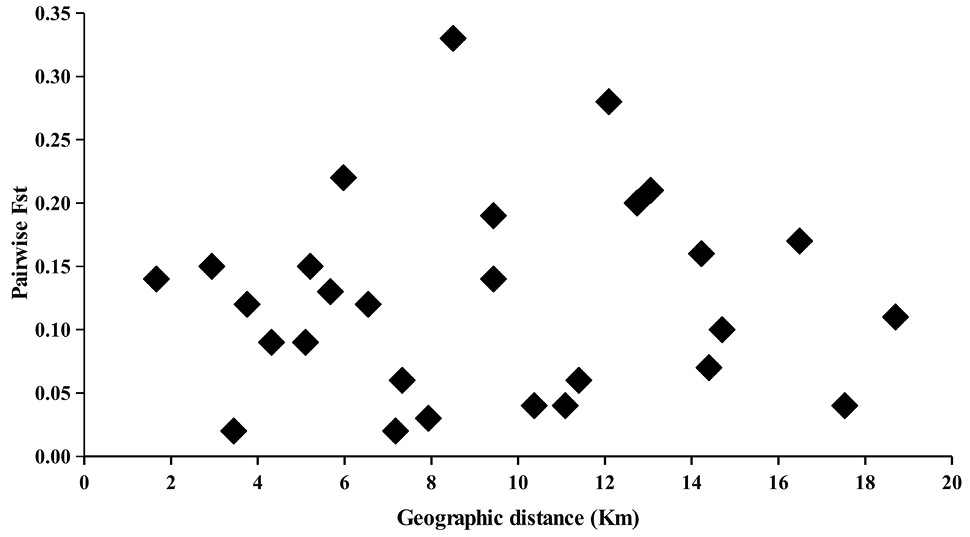
Correlation analysis of geographic distance and pairwise Fst. Data were analyzed by Mantel test, mantel r = 0.047, P = 0.812.
Population structure. (a) Clustering analysis of haplotype diversity of microsatellites of Tupaia belangeri chinensis by UPGMA. (b) Scatter plot of Factorial components 1 versus 2 (FC1 versus FC2) for the eight populations. Groups: ML, Mengla population; PE, Puer population; JD, Jingdong population; KM, Kunming population; CX, Chuxiong population; DL, Dali population; LJ, Lijiang population.
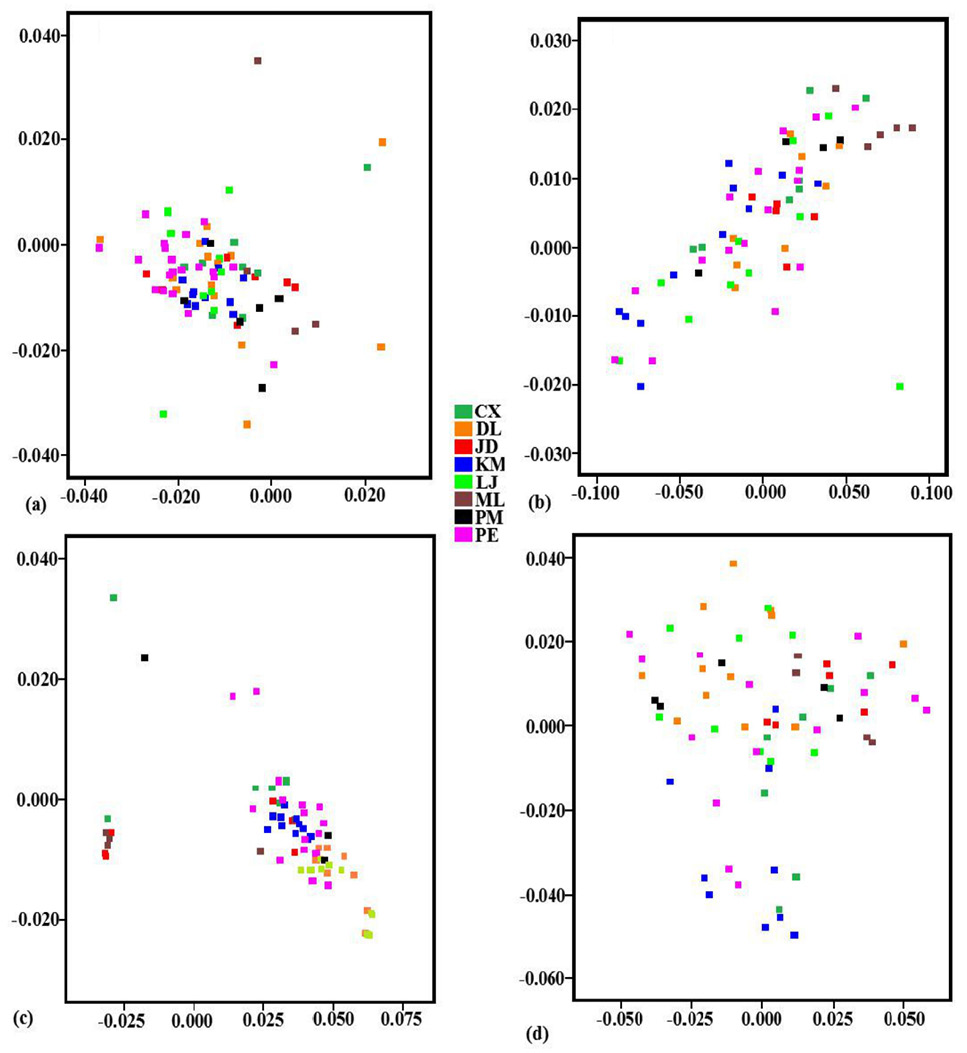
Plots of principal component factors 1 and 2 for dorsal cranium (a), ventral cranium (b), lateral cranium (c) and lateral mandible (d) data of T. belangeri chinensis.
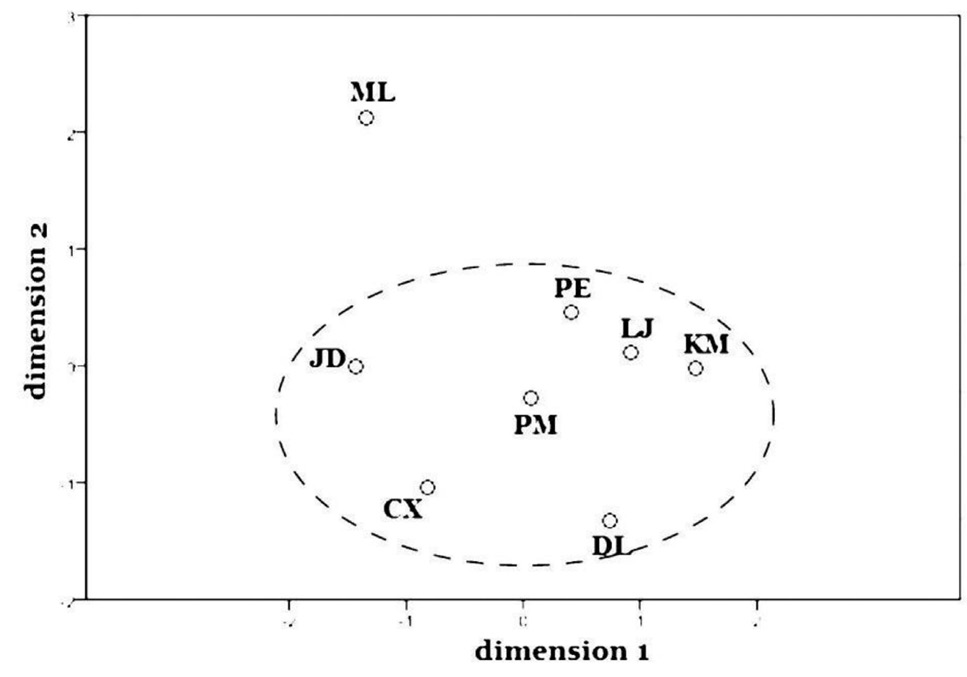
Multidimensional scaling diagram for combinnation data of skull form eight geography populations in T. belangeri chinensis. Groups: ML, Mengla population; PE, Puer population; JD, Jingdong population; KM, Kunming population; CX, Chuxiong population; DL, Dali population; LJ, Lijiang population.


