

Isolation, Identification, and Pathogenicity of Pathogens from Litopenaeus vannamei With Acute Hepatopancreatic Necrosis Disease


Isolation, Identification, and Pathogenicity of Pathogens from Litopenaeus vannamei With Acute Hepatopancreatic Necrosis Disease
Ying Zhong1,3,4, Jingni Chen1, Chunping Huang1, Huaiyuan Jin1, Jinlu Huang1, Lining Zhao1, Yi Geng3, Guiping Wang1,4 and Xueqiao Qian1,2*
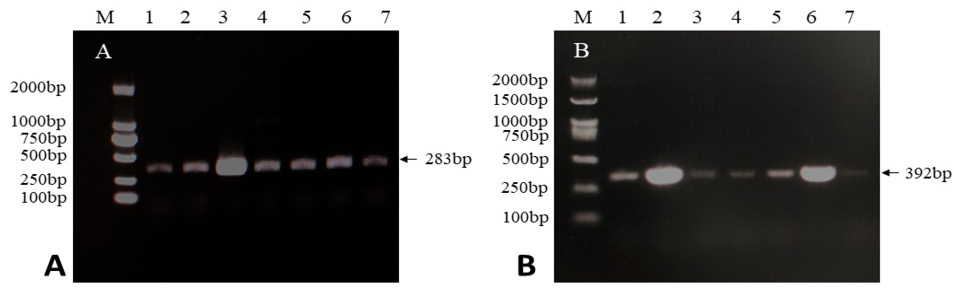
PCR amplification results of the pirA and pirB virulence genes of the seven pathogenic bacteria. A, The amplification result of the pirA virulence gene. Lane M represents the DNA electrophoresis marker, and lanes 1-7 are V.p.20, V.p.24, V.p.25, V.p.26, V.p.27, V.p.28, and V.p.29, respectively. B, The amplification result of pirB virulence gene. Lane M represents the DNA electrophoresis marker, and lanes 1-7 are V.p.20, V.p.24, V.p.25, V.p.26, V.p.27, V.p.28, and V.p.29, respectively.
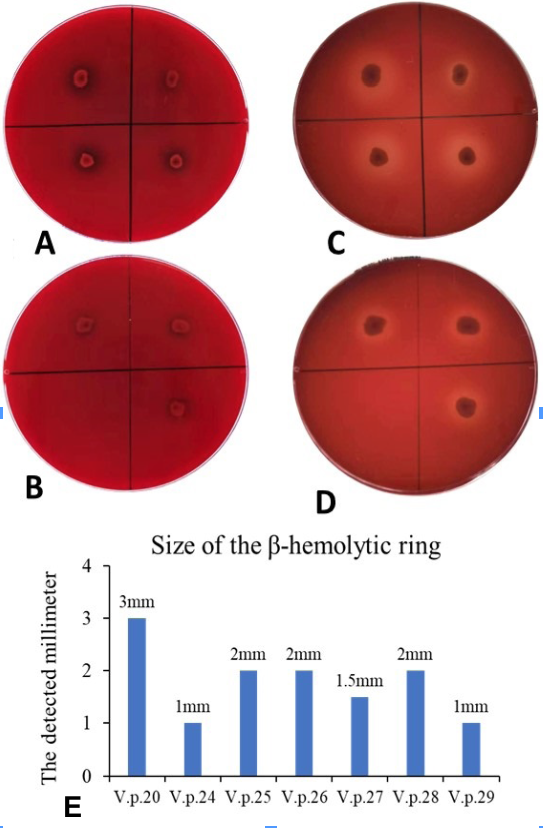
Hemolytic detection of the strains. A and B, The seven Vibrio strains were inoculated on Wagatsuma agar base plates for 24 h. C and D, The seven Vibrio strains were inoculated on Wagatsuma agar base plates for 48 h, all seven strains were hemolytic as obvious β-hemolytic rings appeared on the Wagatsuma agar base plates. E: Size of the seven strains’ β-hemolytic rings at 48h.
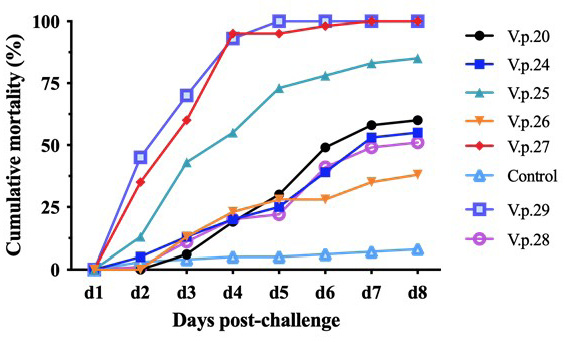
Cumulative mortality curve of V. parahaemolyticus regression infection. The abscissa represents the days post immersion challenge, and the ordinate represents the cumulative mortality. The mortality rates of V.p.25, V.p.27, and V.p.29 were significantly higher than those of V.p.20, V.p.24, V.p.26, and V.p.28. The mortality rates of V.p.20, V.p.24, V.p.26, and V.p.28 were higher than those of the control group during the regression infection experiment.
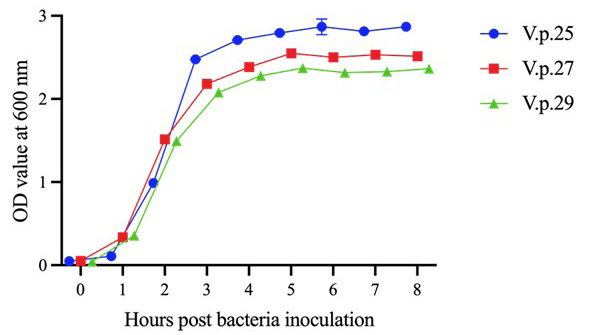
Growth curves of V.p.25, V.p.27, and V.p.29. The three strains of V. parahaemolyticus reached the growth plateau at 4 h after inoculation. Error bars represent SD of three independent detected OD600 values of one sample.
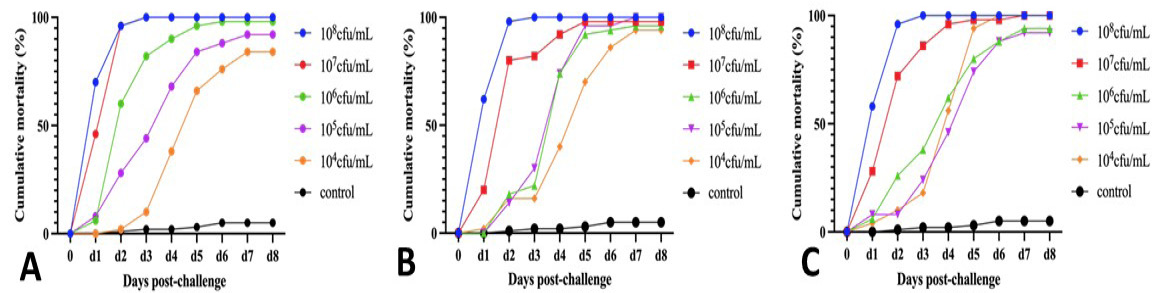
Pathogenicity evaluation of V.p.25, V.p.27, and V.p.29. A, Cumulative mortality curve for V.p.25. B, Cumulative mortality curve for V.p.27. C, Cumulative mortality curve for V.p.29.


