Geno-Toxic Appraisal of Widely Used Food Color Additives on Model Plant Allium cepa Root Tip Cells
Geno-Toxic Appraisal of Widely Used Food Color Additives on Model Plant Allium cepa Root Tip Cells
Jabeen Farheen1,2*, Simeen Mansoor1 and Maria Abid1
Macroscopic study of 120 hours old onion (Allium cepa) root tips treated with 0%, 0.001%, 0.01%, 0.1% and 1% concentration of allura red food colour additive (a) and Crochet hooks root tips (b).
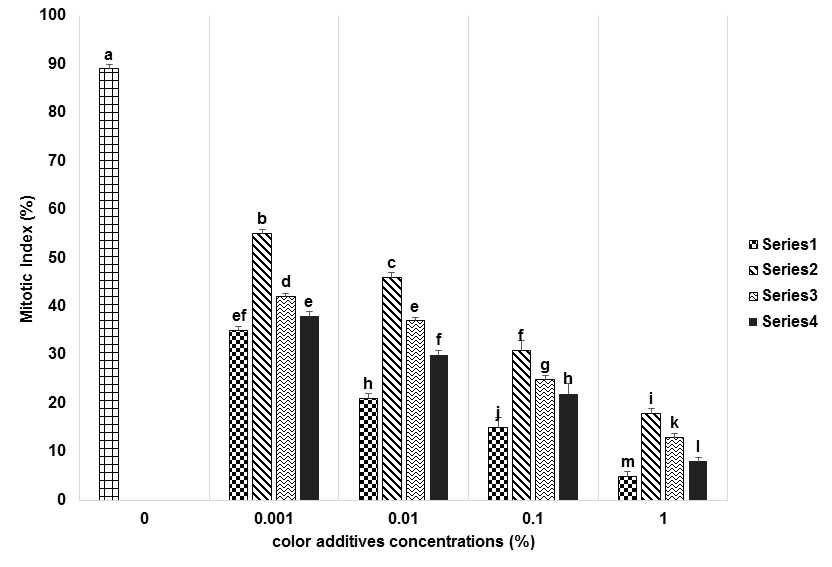
Mitotic index of onion (Allium cepa) root tips treated with 0%, 0.001%, 0.01%, 0.1% and 1% concentration of four used food colour additives. The first bar at 0% concentration showed control of the study while series-1 indicated the allura red, series-2 indicated the sunset yellow, series-3 indicated the tartrazine, and series-4 indicated fast green FCA bars. Similar letters are representing no difference among treatments of each FCA (n = 4).
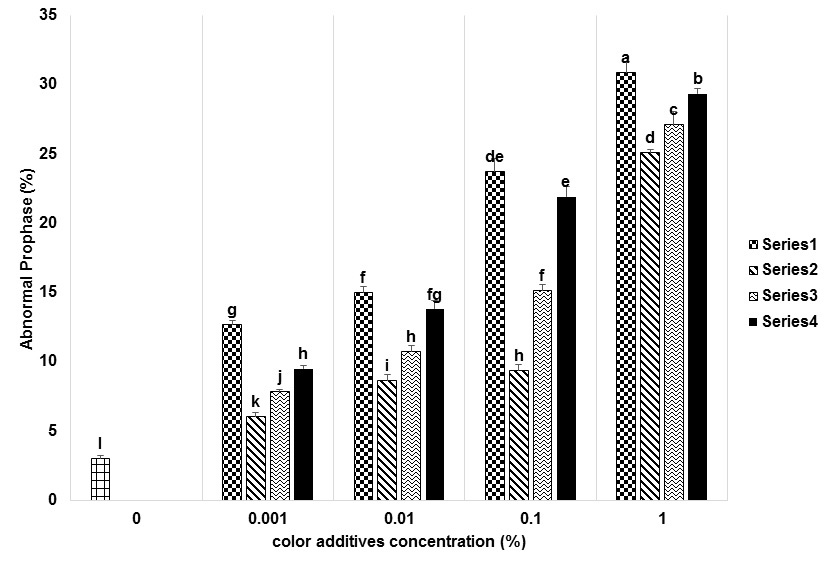
Abnormal prophase in onion (Allium cepa) root tips treated with 0%, 0.001%, 0.01%, 0.1% and 1% concentration of four used food colour additives. The rest of the information same as Figure 2.
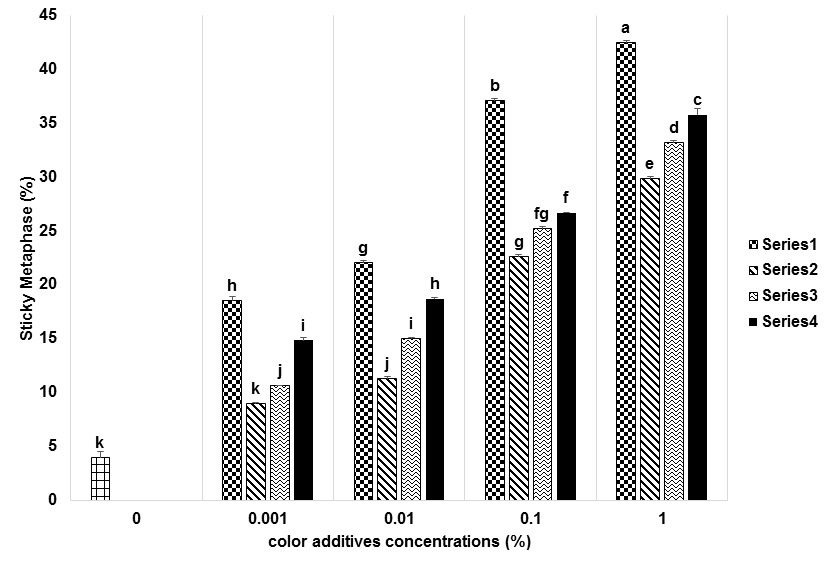
Sticky metaphase in onion (Allium cepa) root tips treated with 0%, 0.001%, 0.01%, 0.1% and 1% concentration of four used food colour additives. The rest of the information same as Figure 2.
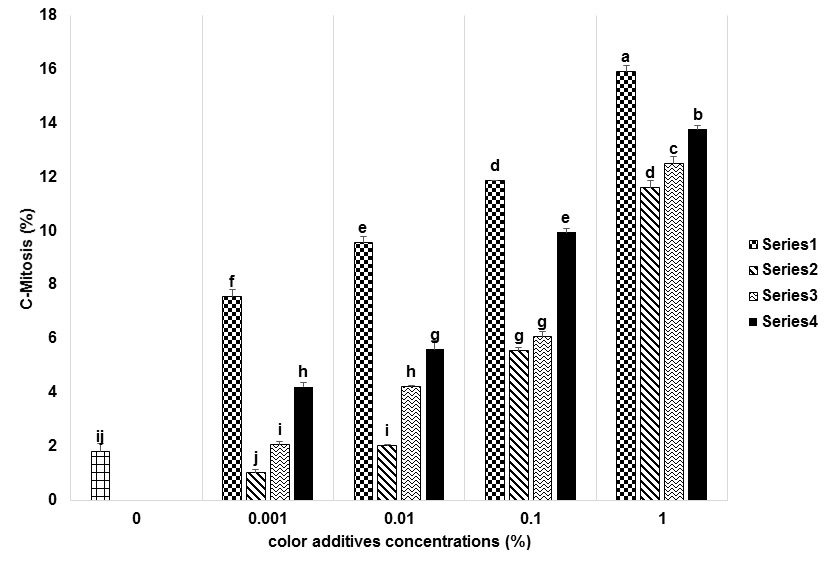
C-Mitosis in onion (Allium cepa) root tips treated with 0%, 0.001%, 0.01%, 0.1% and 1% concentration of four used food colour additives. The rest of the information same as Figure 2.
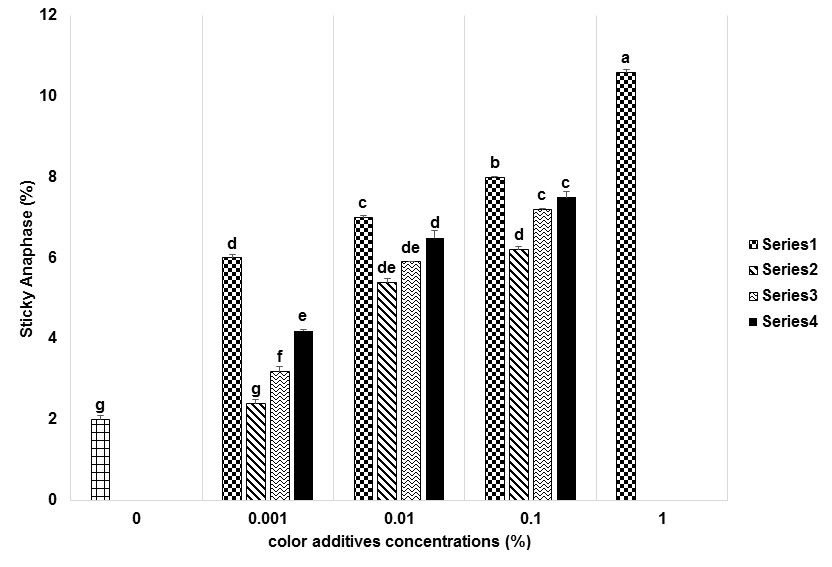
Sticky anaphase in onion (Allium cepa) root tips treated with 0%, 0.001%, 0.01%, 0.1% and 1% concentration of four used food colour additives. The rest of the information same as Figure 2.
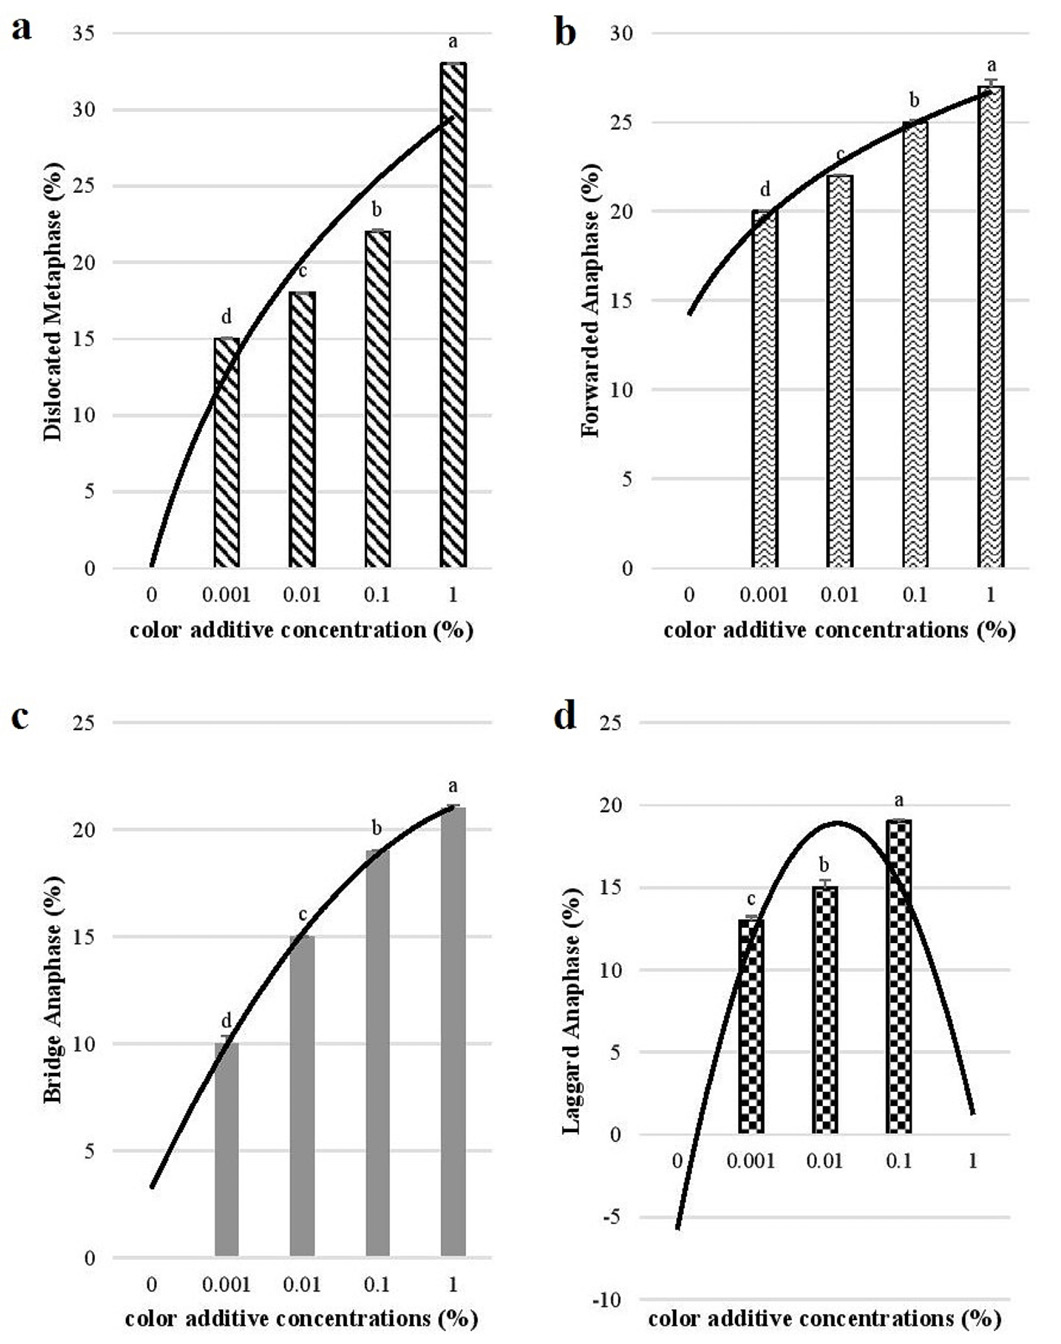
Various aberrations in onion (Allium cepa) root tips treated with 0%, 0.001%, 0.01%, 0.1% and 1% concentration of four used food colour additives. Similar letters are representing no difference among treatments of each FCA (n = 4). Where a = dislocated metaphase; b = forwarded anaphase; c = bridge anaphase and d = laggard anaphase.
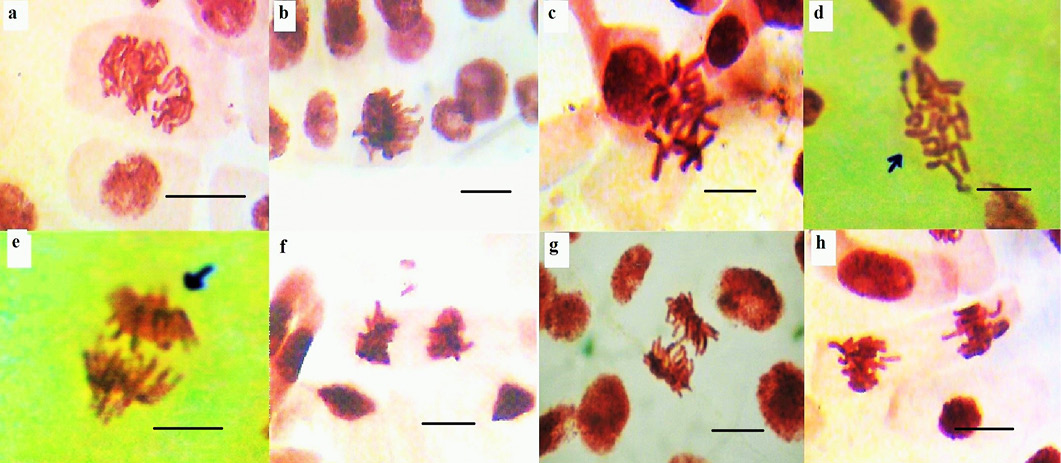
Microscopic study of onion (Allium cepa) root tips treated with 0%, 0.001%, 0.01%, 0.1% and 1% concentration of four food colour additive for 36 h (a). Abnormal prophase, (b). Sticky metaphase, (c). Dislocated metaphase, (d). C-Mitosis, (e). Forwarded anaphase, (f). Sticky anaphase, (g). Bridge anaphase and (h). Laggard anaphase. Scale bars=5 µm cellˉ¹.


