Expression Pattern Analysis of Core Regulatory Module SHPs-FUL Transcripts in Rapeseed Pod Shattering
Expression Pattern Analysis of Core Regulatory Module SHPs-FUL Transcripts in Rapeseed Pod Shattering
Muhammad Yasin1, Romana Shahzadi1, Muhammad Riaz2, Mahideen Afridi2, Wajya Ajmal3, Obaid Ur Rehman2, Nazia Rehman3, Ghulam Muhammad Ali1,3, Muhammad Ramzan Khan1,2,3*
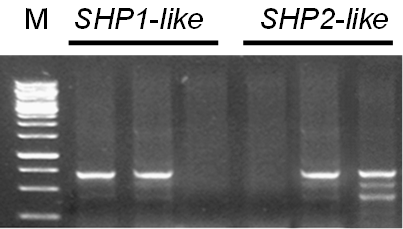
Amplification of Shatterproof 1/2 genes from local canola cultivars: Gel picture showing the PCR amplification of BnSHP1-like and BnSHP2-like transcripts from flower and pod tissues of Brassica napus (Pakola); F1 (Flower BnSHP1-like); F2 (Flower BnSHP2-like); L1 (Leaf BnSHP1-like); L2 (Leaf BnSHP2-like); S1 (Silique BnSHP1-like); S2 (Silique BnSHP2-like); M (1kb ladder).
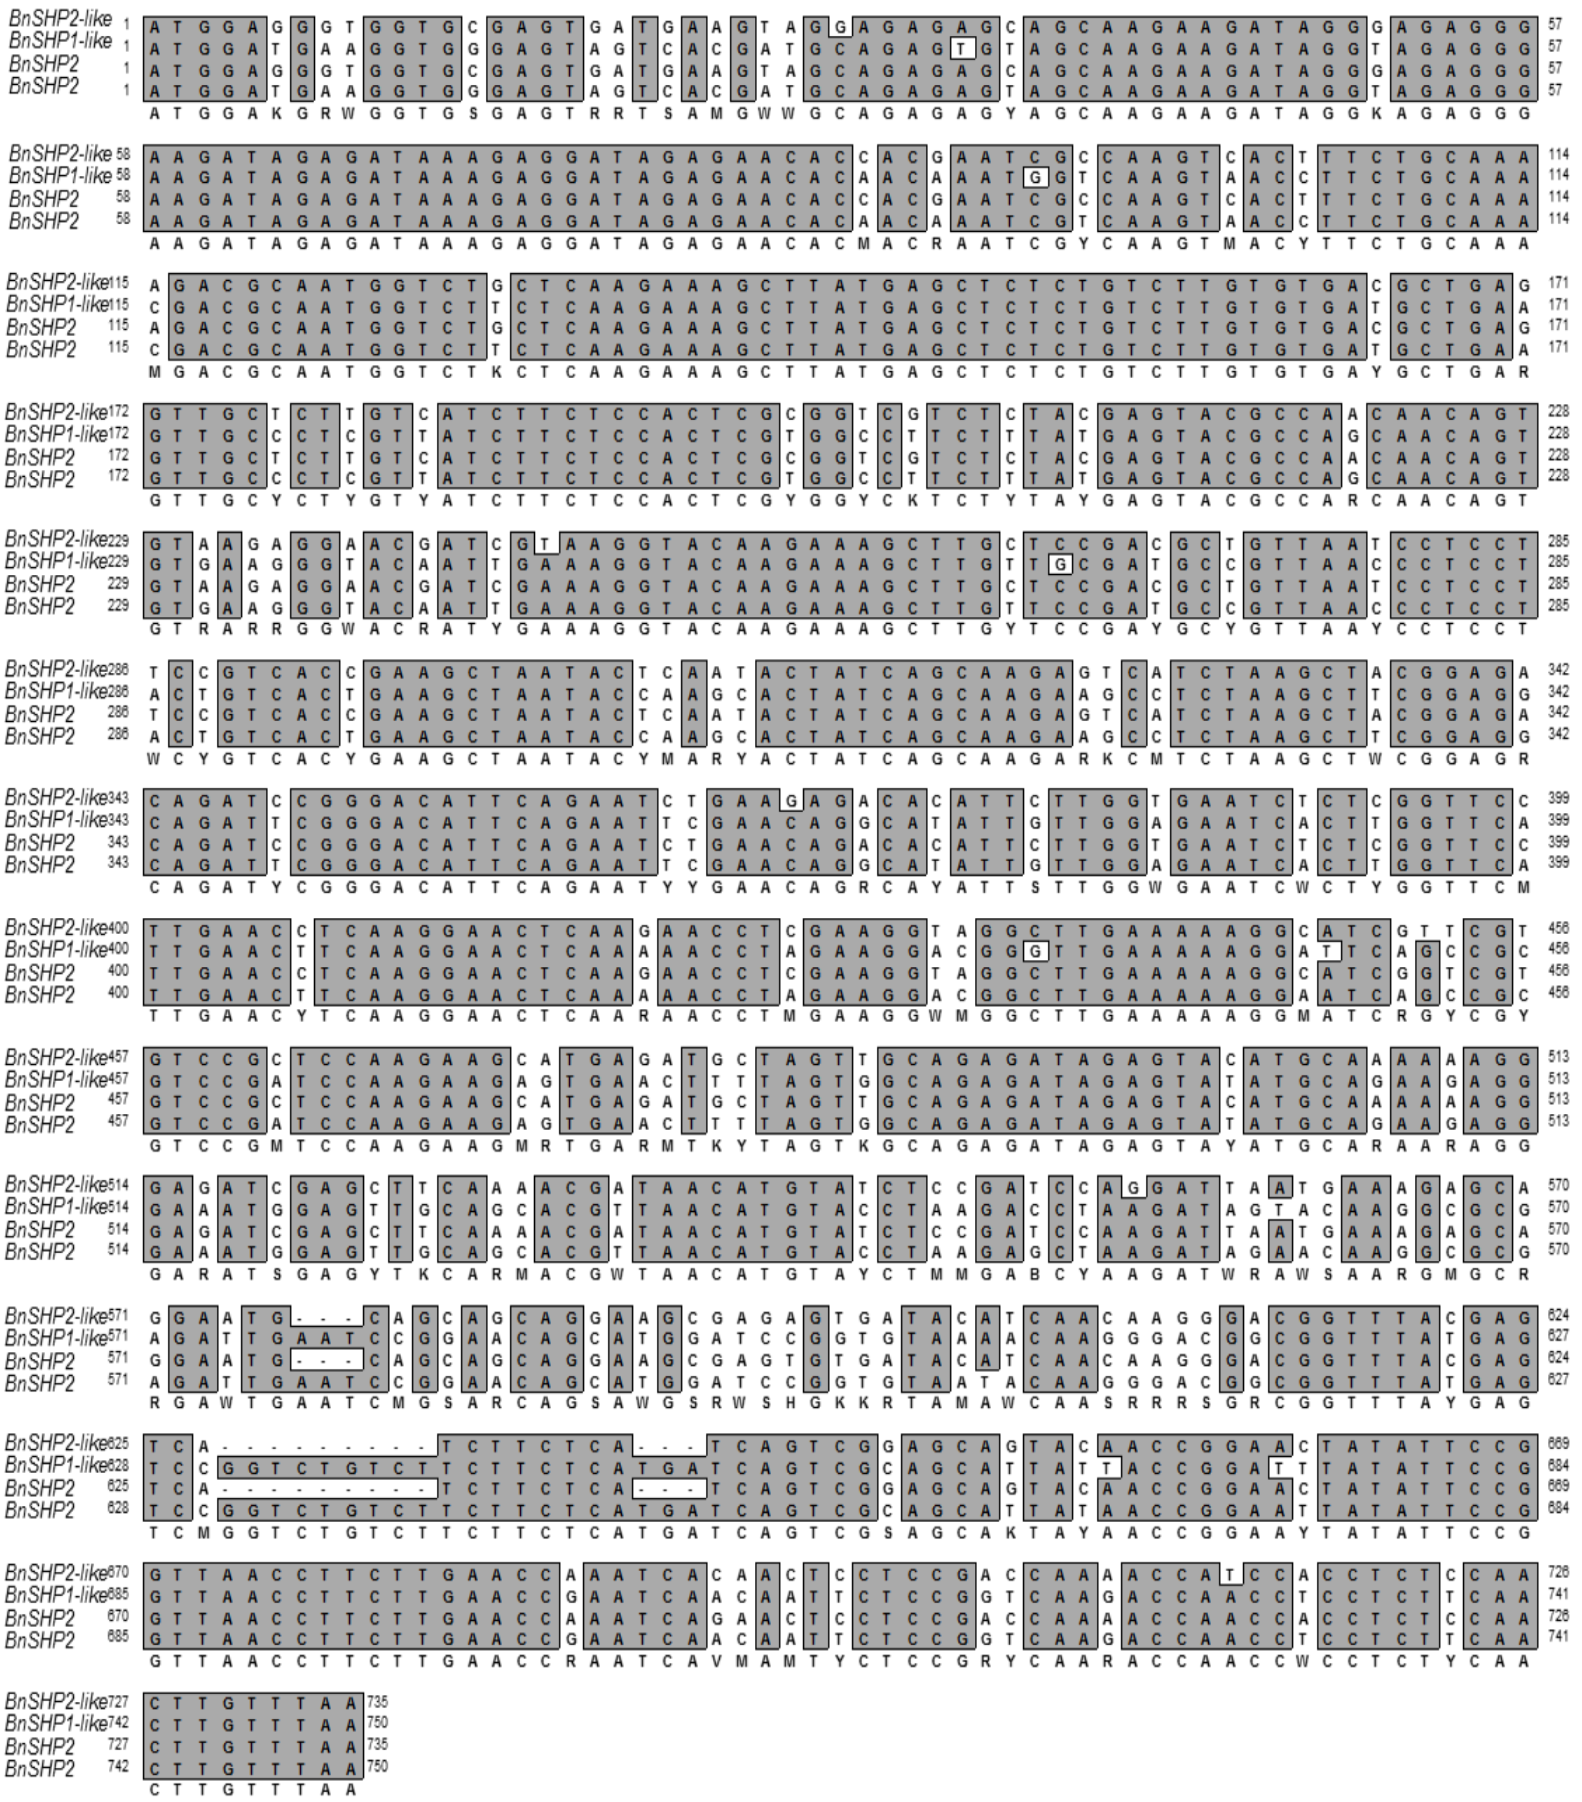
Sequence analysis of BnSHP1/2-like genes: ClustalW multiple alignment of newly isolated BnSHP1-like, BnSHP2-like, BnSHP1 and BnSHP2 nucleotide sequences with Mac Vector TM 7.2.3. (Accerlrys Inc.) gcg/Wisconsin package university of Wisconsin). Nucleotides in block highlight similarity.
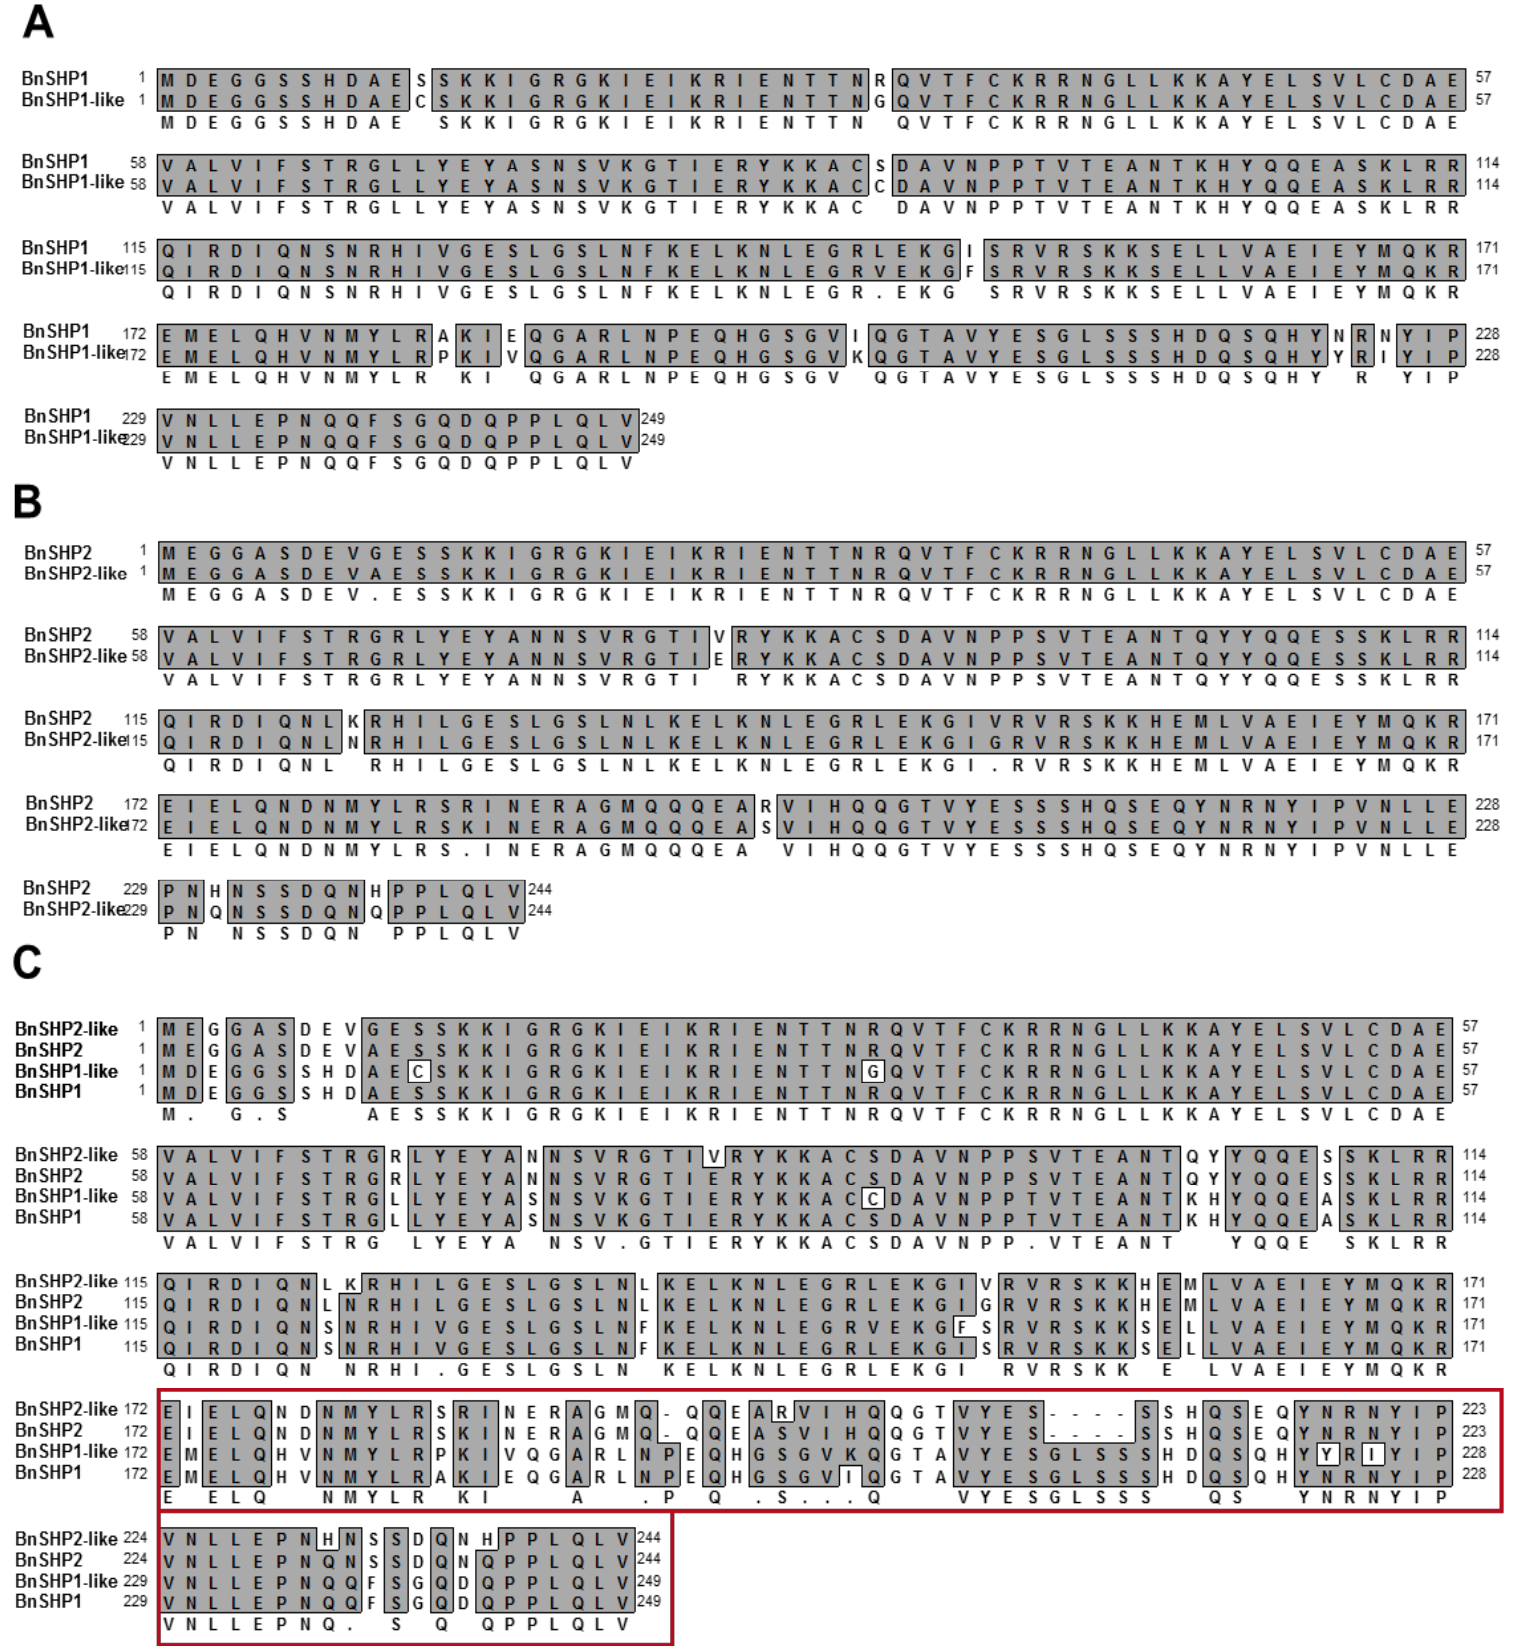
C-terminal of BnSHP1/2-like is variable: A) ClustalW alignment of BnSHP1-like and BnSHP1 amino acids with Mac Vector TM 7.2.3. (Accerlrys Inc.) gcg/Wisconsin package university of Wisconsin). Amino acids in block highlight similarity; B) ClustalW alignment of BnSHP2-like and BnSHP2 amino-acids with Mac VectorTM 7.2.3. (Accerlrys Inc.) gcg/Wisconsin package university of Wisconsin). Amino acids in block show conservation; C) ClustalW multiple alignment of BnSHP1-like and BnSHP2-like with previously BnSHP1 and BnSHP2 amino-acids with Mac VectorTM 7.2.3. (Accerlrys Inc.) gcg/Wisconsin package university of Wisconsin). Amino acids in block highlight similarity. Solid block in red encloses the variable C-terminal region.
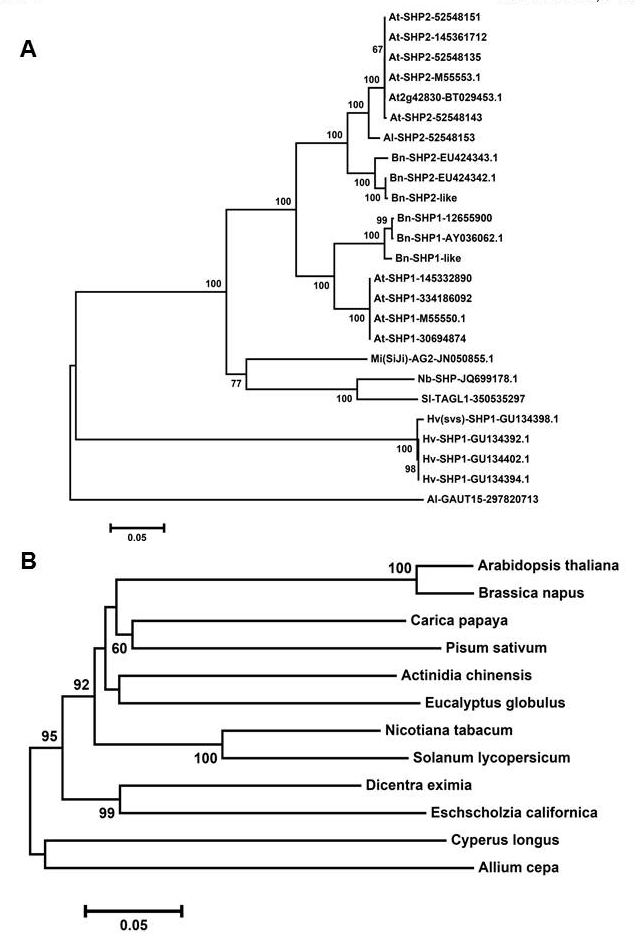
Phylogenetic reconstructions of SHP1/2 and FUL genes: A): A neighbor joining tree with default P uncorrected distance is constructed using MEGA6 software. Values on the nodes indicate the bootstrap replications of 1000; B): Neighbor joining tree was built using MEGA6 software. Values present on the nodes designate the bootstrap replication of 1000.
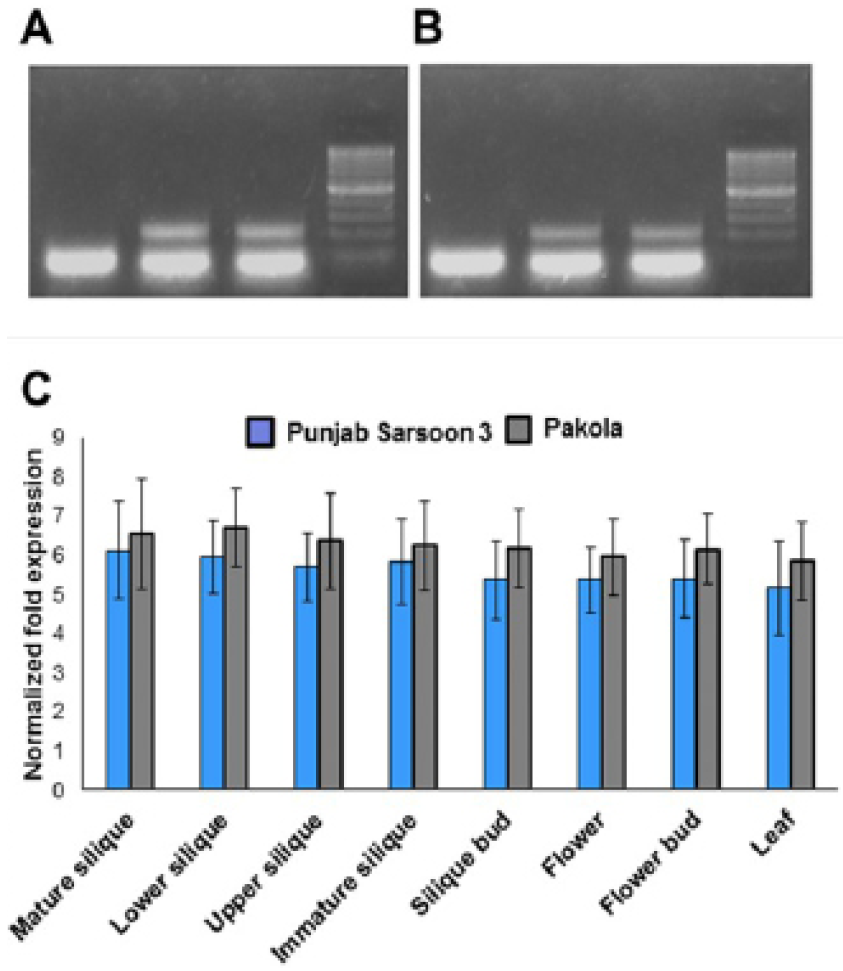
Expression analyses of BnSHP1/2-like FUL transcripts in canola: A): BnSHP1-like transcript amplifications in flower and pod of Brassica napus (Pakola) through RT-PCR is shown. M;100 bp ladder; B): BnSHP2-like transcript amplifications in flower and pods of Brassica napus (Pakola) through RT-PCR. M;100 bp ladder; C): Normalized fold expression of FUL gene in selected tissues of Pakola (less shattering susceptible) and Punjab Sarsoon3 (shattering susceptible) through real-time RT-PCR. Error bars indicate standard deviation of the mean.


