
Comparative Efficacy of Neem (Azadirachta indica), Levamisole and Combination of Levamisole, Oxyclozanide and Cobalt against Gastrointestinal Parasites: A Way Forward for Public (One) Health


Comparative Efficacy of Neem (Azadirachta indica), Levamisole and Combination of Levamisole, Oxyclozanide and Cobalt against Gastrointestinal Parasites: A Way Forward for Public (One) Health
Muhammad Ali Raza1*, Aneela Zameer Durrani2, Muhammad Muddassir Ali3, Tariq Usman4, Bilques Bano5, Nazia Rubab6, Syed Tasadak Mehdi7, Muhammad Wasim Iqbal8, Kumayl Hassan Akhtar9, Hira Hameed10
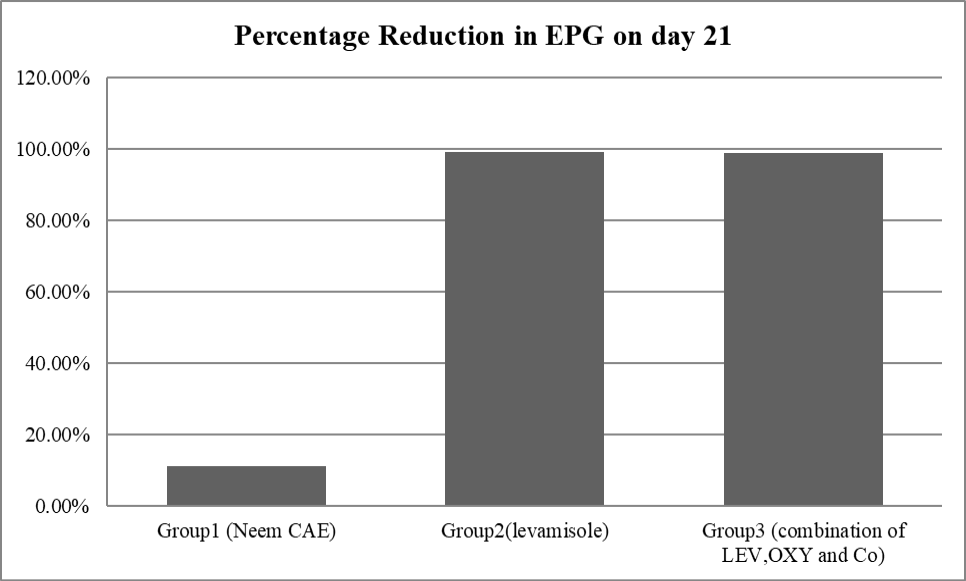
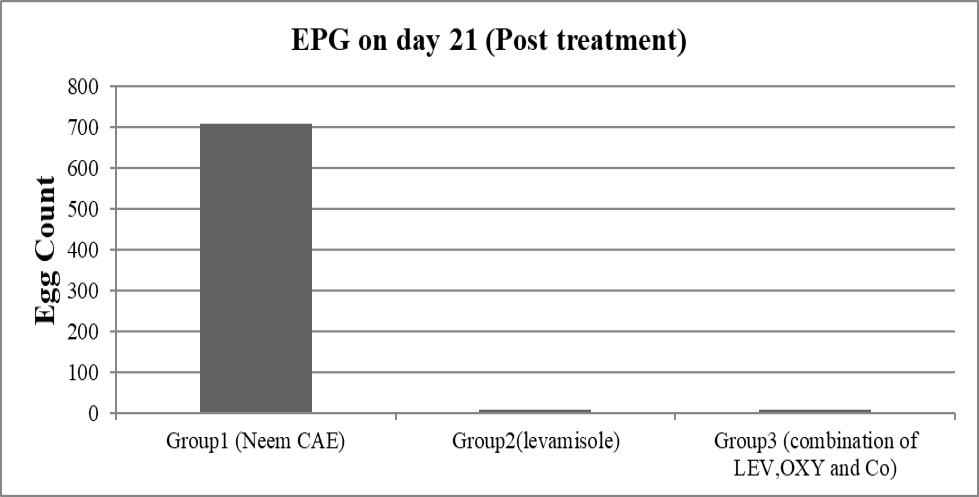
Graph showing decrease in faecal egg count of treated groups at day 21 post treatment comparatively by various groups.
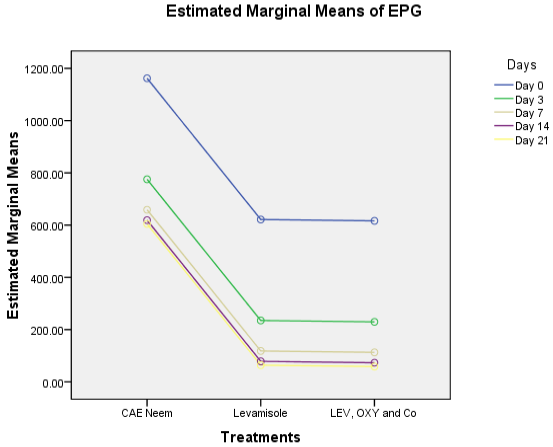
Graph showing decrease in faecal egg count of treated group.

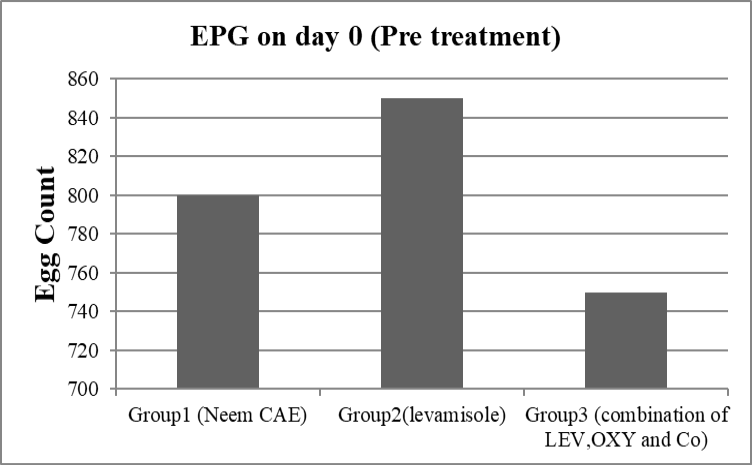
Graph showing faecal egg count of infected groups at day 0 pre treatment.
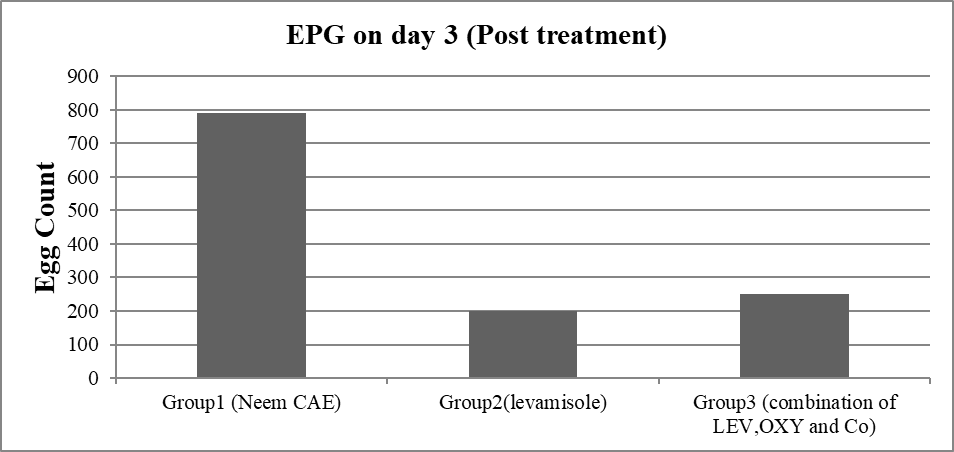
Graph showing decrease in faecal egg count of treated groups at day 3.
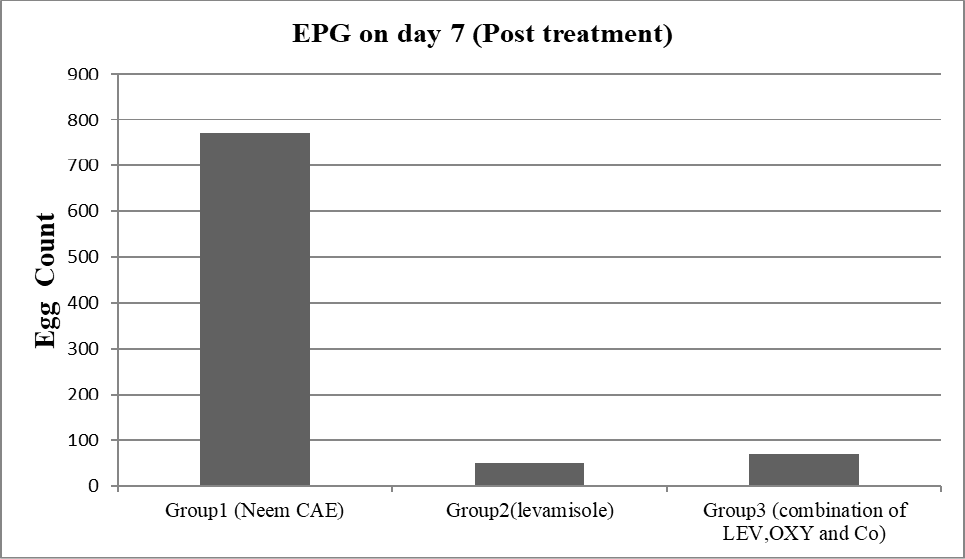
Graph showing decrease in faecal egg count of treated groups at day 7.
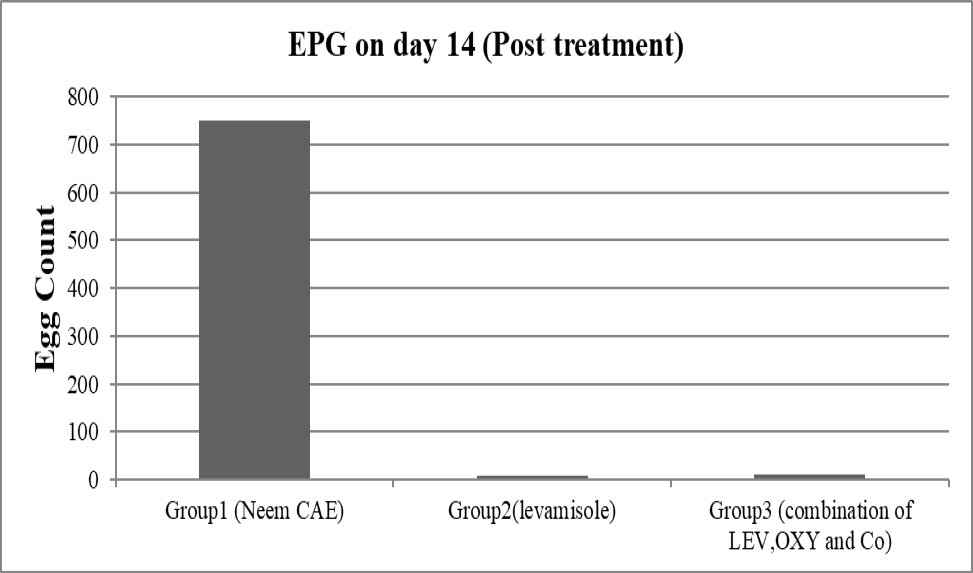
Graph showing decrease in faecal egg count of treated groups at day 14.

Graph showing decrease in faecal egg count of treated groups at day 21.
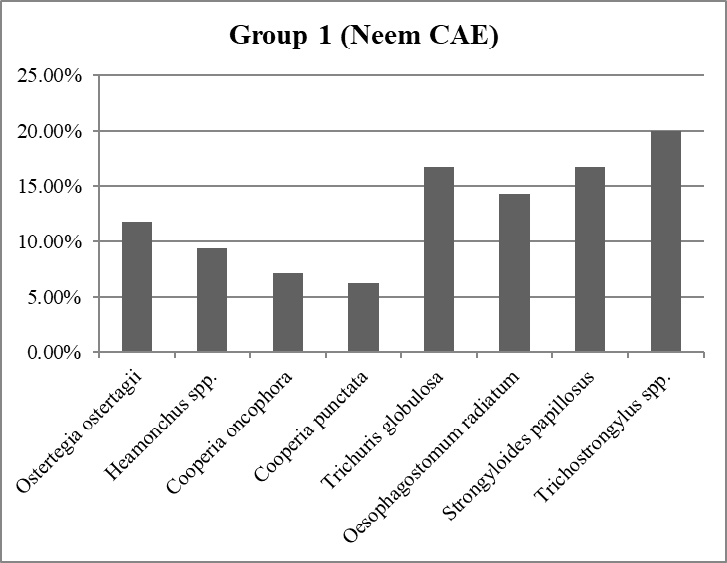
Graph showing percentage larval decrease of various species by group 1.

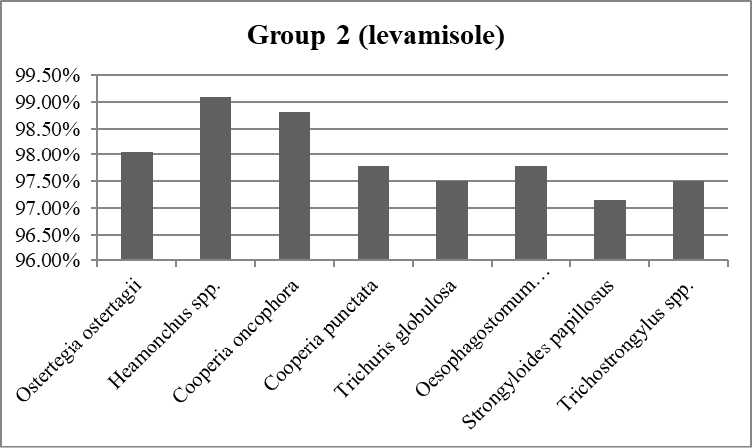
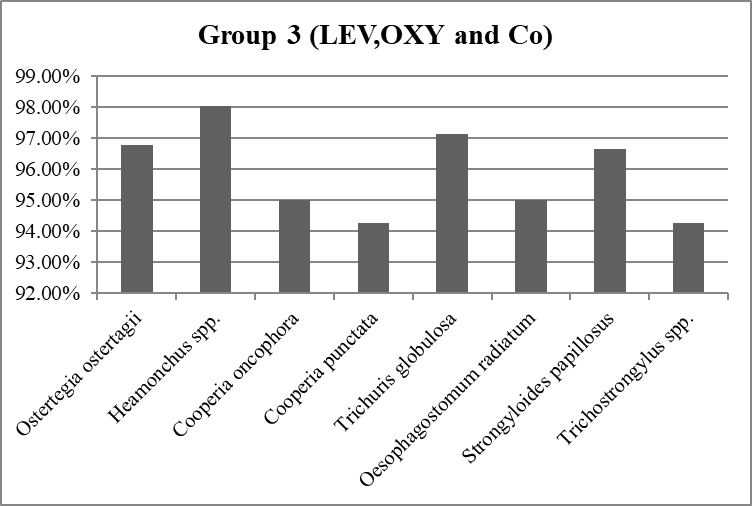
Graph showing percentage larval decrease of various species by group 2.


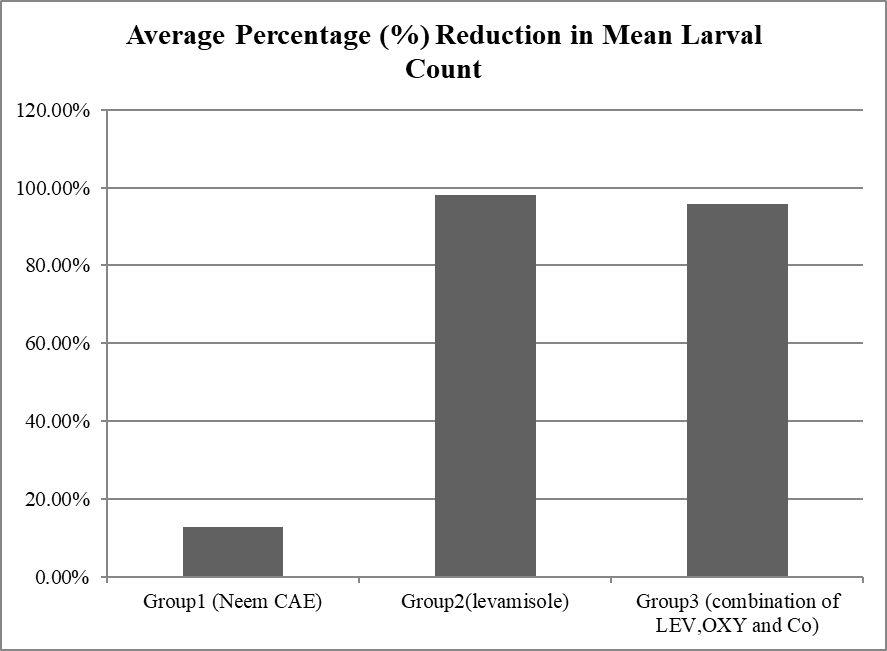
Graph showing average percentage decrease in larval count on day 21 as compared to day zero (0).


