Agro-Morphological Characterization and Diversity Studies of Local and Modern Rice Genotypes in the Coastal Region of Bangladesh
Agro-Morphological Characterization and Diversity Studies of Local and Modern Rice Genotypes in the Coastal Region of Bangladesh
Iftakher Alam1,2, Biswajit Das1,3*, Kazi Md. Younus Tanim1, Rafiat Zannat1,3, Amiya Das Hridoy1,4, H.M. Fahad Hossain1,4, Tarikul Islam1 and Md. Atiqur Rahman Bhuiyan1
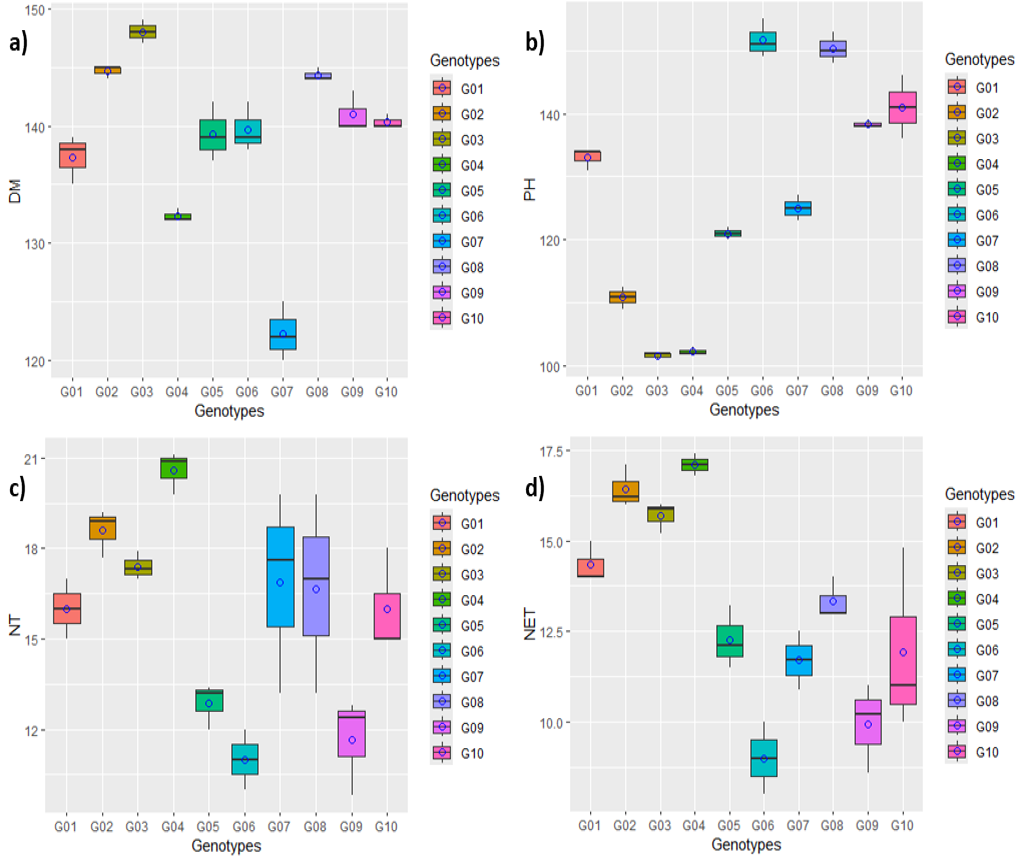
Boxplots illustrating the distribution of (a) Days of maturity, (b) Plant height, (c) Number of tillers per plant, (d) Number of effective tillers per plant values. The blue points are mean values, and the horizontal lines dividing the box represent the medians. The lower and upper box boundaries, as well as the lower and higher whiskers, reflect the Q1 (25th percentile), Q3 (75th percentile) and Interquartile Range expressing middle 50% scores. Note: G1 (BRRI dhan34), G2 (BRRI dhan52), G3 (BRRI dhan100), G4 (Binadhan-10), G5 (Swarna), G6 (Tulshimala), G7 (Rajashail), G8 (Birui), G9 (Hail dhan), G10 (Lal paika).
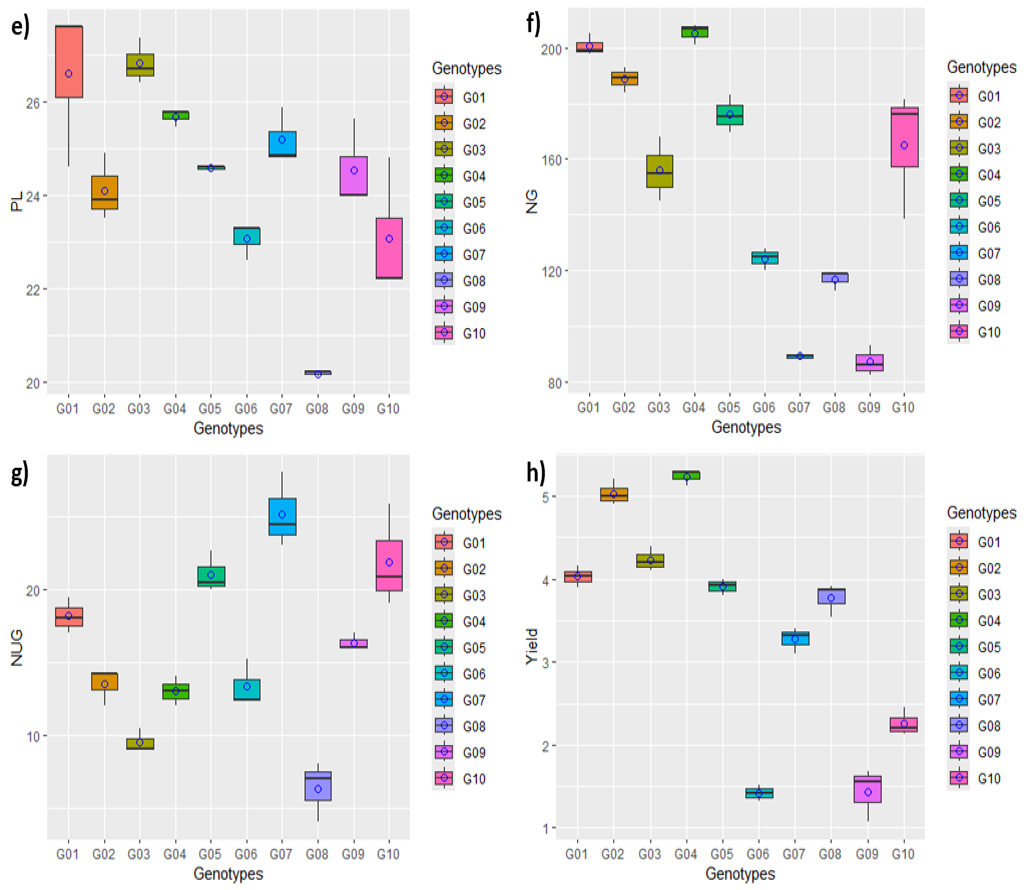
Boxplots illustrating the distribution of (e) Length of panicle, (f) No. of grains per hill, (g) No. of unfilled grains per hill, (h) yield values. The blue points are mean values, and the horizontal lines dividing the box represent the medians. The lower and upper box boundaries, as well as the lower and higher whiskers, reflect the Q1 (25th percentile), Q3 (75th percentile) and Interquartile Range expressing middle 50% scores. Note: G1 (BRRI dhan34), G2 (BRRI dhan52), G3 (BRRI dhan100), G4 (Binadhan-10), G5 (Swarna), G6 (Tulshimala), G7 (Rajashail), G8 (Birui), G9 (Hail dhan), G10 (Lal paika).
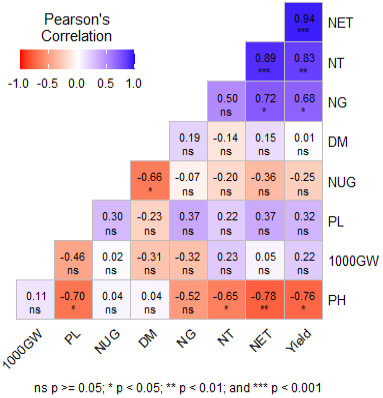
Correlation analysis among the studied parameters. DM= Days of maturity; PH= Plant height; NT = number of tillers per plant; NET= number of effective tillers per plant; PL= length of panicle; NG= no. of grains per hill; NUG= no. of unfilled grains per hill; 1000GW= 1000 grains weight.
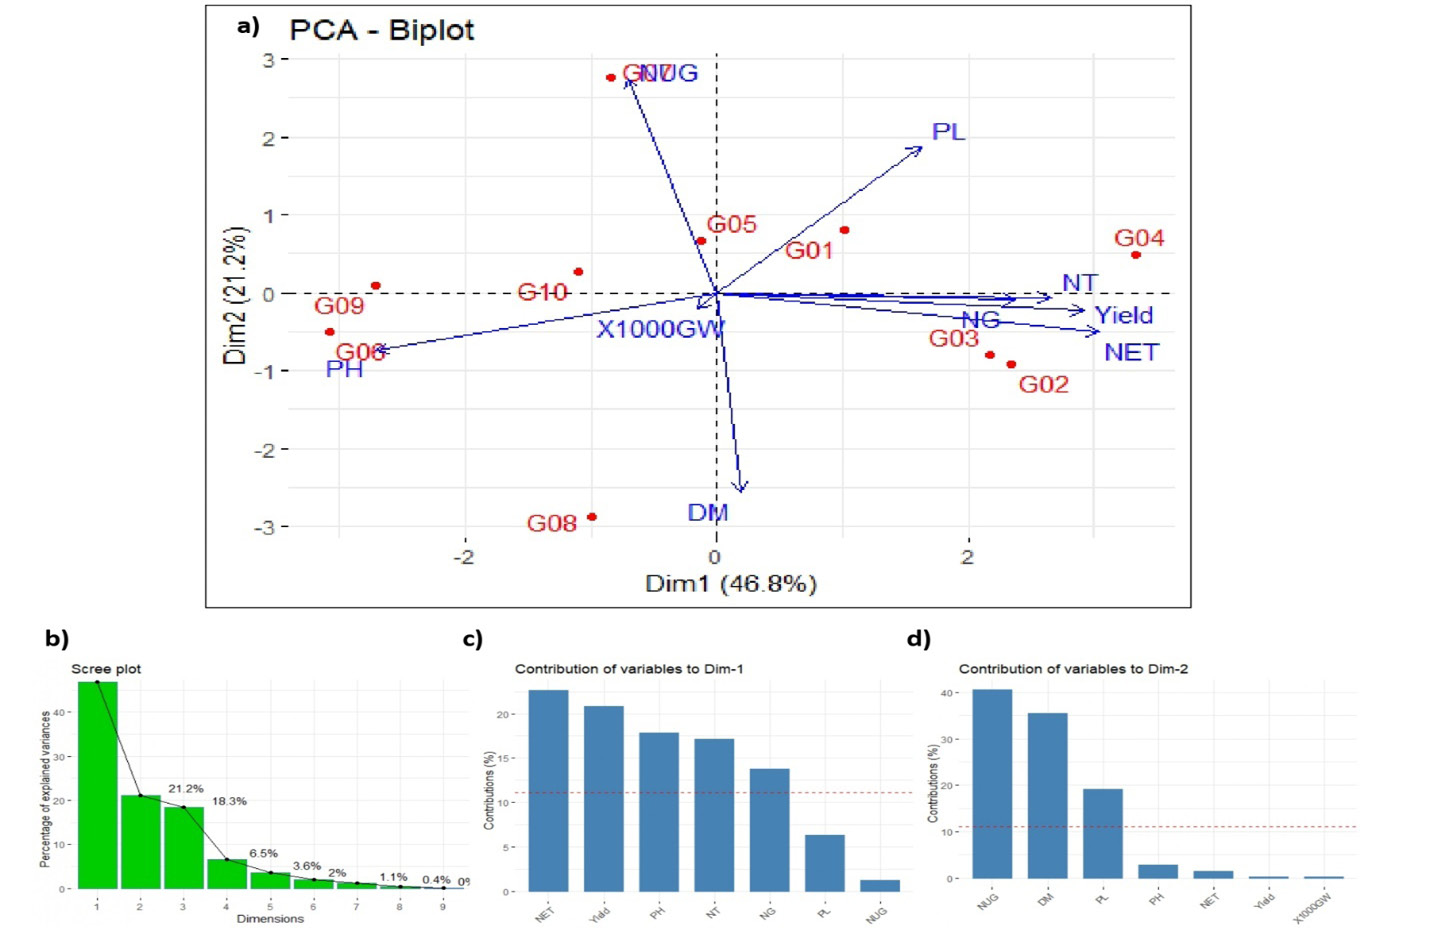
(a) Principal component analysis of all the studied traits among the 10 genotypes. (b) The proportion of the dimensions (PCs). (c) Contribution of traits in dim-1. (d) Contribution of traits in dim-2. Note: G1 (BRRI dhan34), G2 (BRRI dhan52), G3 (BRRI dhan100), G4 (Binadhan-10), G5 (Swarna), G6 (Tulshimala), G7 (Rajashail), G8 (Birui), G9 (Hail dhan), G10 (Lal paika). DM = days of maturity; PH = plant height; DM = plant height; NT =number of tillers per plant; NET = number of effective tillers per plant; PL = length of panicle; NG = no. of grains per hill; NUG - no. of unfilled grains per hill; 1000GW= 1000 grains weight.


