
Tropical gar (Atractosteus tropicus) is an ancestral subtropical fish species in southeastern Mexico, which has great potential as a model species for physiological, biomedical and genomic studies. The quantification of gene expression through RT-qPCR is one of the most commonly used techniques, due to its precision, sensitivity and high performance, particularly in gene expression to compare between cells, tissues and organs; as well as different populations, stages of development, metabolism, among other conditions. This study analyzed the stability and normalization of six commonly used reference genes such as alpha elongation factor (ef1-α), beta-actin (actb), 18S ribosomal RNA (18s rrna), beta-2-microglobulin (b2m), tubulin alpha (α-tub) and glyceraldehyde 3-phosphate dehydrogenase (gapdh) in the different tissues of the intestine, muscle, gill, stomach, brain and liver in adult males of A. tropicus from reared in captivity through three BestKeeper, geNorm and NormFinder algorithms. Based on our results we can conclude that in the three BestKeeper, NormFinder and geNorm algorithms, the most stable genes are ef1, followed by 18s rrna and actb where the gene stability will depend on specific tissue to analyze in tropical gar A. tropicus adults.
Research Article · Volume 54, Issue 1, 18 December 2021 · Open Access
Quality Evaluation of Reference Gene Expression on Different Tissues in Adults of Tropical Gar Atractosteus tropicus
· · · · · · · ·
Affiliations & Notes ⌄
- 1Laboratorio de Biología Molecular, DAMJ-UJAT, Dirección: Carretera Estatal Libre Villahermosa-Comalcalco Km. 27+000 s/n Ranchería Ribera Alta, C.P. 86205, Jalpa de Méndez, Tabasco, Mexico. 2Laboratorio de Docencia, DAMC-UJAT, Dirección: Rancheria Sur cuarta sección Comalcalco, Tabasco, Mexico. 3Laboratorio de Investigación en Biotecnologia Acuicola (LIBA), Tecnologico Nacional de Mexico Campus Boca del Rio (ITBoca). Boca del Rio, Veracruz, Mexico. 4Laboratorio de Acuicultura Tropical, DACBIOL-UJ
Article Info ⌄
- Journal:
- Pakistan Journal of Zoology
- Published:
- 18 December 2021

From the article
- Thanks to these algorithms, the stability of the reference gene candidate can be identified and evaluated for the correct normalization being therefore, an essential tool for an adequate selection.
- It is important to highlight that for A. tropicus this gene can be used for nutrigenomic studies with tissues such as the intestine and stomach since it has good stability.
- In the case of muscle, brain and liver, the most stable gene was ef1-α for A. tropicus adults.
- Based on BestKeeper, NormFinder, and geNorm analyses, the most stable genes for A. tropicus were ef1-α, followed by 18s rrna and actb, so they are adequate as reference genes and can be used individually; however, it is advisable to use any of them to quantify the relative gene expression in A. tropicus.
Selected from the article's own text.
Abstract
INTRODUCTION
Tropical gar (Atractosteus tropicus) is a tropical fish, characterized by being a very important carnivorous species in southeastern Mexico (Márquez-Couturier et al., 2006). In the last 30 years, several studies have been carried out with the species, from the aspects of reproduction, larviculture, digestive physiology, feeding and nutrition. This has allowed advances in A. tropicus aquaculture techniques. Nutrition and energy requirements studies let maximizing growth in less time by improving small-scale culture to seek profitability (Lee, 2002).
In this sense, A. tropicus is considered an ancestral species since it has kept its physiognomy intact by not suffering genetic duplication that separated them from the diversification of the Teleostean lineage 320-350 million years ago (Braasch et al., 2016). That is why the interest of carrying out molecular biology works to understand and expand the knowledge of the different physiological and metabolic processes of the species.
The quantification of gene expression through RT-qPCR is one of the most commonly used techniques, due to its precision, sensitivity and high performance. There are two methods: absolute and relative quantification (Schmittgen and Livak, 2008). The absolute quantification is determined by defining the exact number of copies by extrapolating the value from a standard or calibration curve while the relative quantification is not necessary a calibration curve, changes in the expression of a gene in response to a treatment are analyzed, comparing and relativizing another untreated control and normalizing with an endogenous control or reference gene whose expression does not change in response to any kind of treatment or condition (Wan et al., 2010). A reference gene must be reliable to conduct a good relative expression study (Dundas and Ling, 2012). Ideal reference genes must be stably expressed in various cells, tissues and organs; different populations; different stages of development; different stages of the cell cycle; and different treatment circumstances (Li et al., 2019). Currently, for the analysis of the stability of the reference gene there are different algorithms such as BestKeeper (Pfaffl et al., 2004), geNorm (Vandesompele et al., 2002) and NormFinder (Andersen et al., 2004). These are tools using different algorithms where BestKeeper uses peer correlation analysis of each internal gene with an optimal normalization factor, NormFinder adjusts the data to a mathematical model, which allows to compare intra and intergroup variation and the calculation of expression stability and finally genNorm uses comparisons between pairs and the geometric average of the Cq values to establish the most stable genes (Wang et al., 2012).
Currently, the alpha elongation factor (ef1-α), beta-actin (actb), 18S ribosomal RNA (18s rrna), beta 2 microglobulin (b2m), tubulin alpha (α-tub) and glyceraldehyde 3-phosphate dehydrogenase (gapdh) genes are considered the most stable and used as reference genes. The ef1-α gene encodes a critical protein that acts in the formation of the cytoskeleton of cells (Ingerslev et al., 2006); actb gene encodes an essential protein of the cytoskeleton that is an essential component of cells to maintain the necessary activities of life and the performance of an important role in cell secretion, phagocytosis, migration, cytoplasmic transmission and cytoplasmic segregation and recombination (Guo et al., 2013). The 18s rrna gene is an essential component of eukaryotic cells and part of RNA ribosomes (Wang et al., 2018). The b2m gene encodes a protein found on the surface of virtually all body cells and is released by cells into the blood, especially B cells (Winchester et al., 2003; McCurley and Callard, 2008). The α-tub gene encodes a type of tubulin that exists as a dimer in the cell with tubulin and is involved in important physiological functions such as cell division and differentiation, substance transport, and signal transduction (Fortes et al., 2016). Finally, the gapdh gene encodes a protein that acts in glycolysis for energy creation (Nicholls et al., 2012). These reference genes have been studied in marine fish such as Paralichthys olivaceus (Zheng and Sun, 2011), Danio rerio (Casadei et al., 2011; McCurley and Callard, 2008), Gasterosteus aculeatus (Hibbeler et al., 2008), Solea senegalensis, and Hippoglossus hippoglossus (Infante et al., 2008; Øvergård et al., 2010), Salmo salar (Kortner et al., 2011), Gadus morhua (Olsvik et al., 2008) and in freshwater fish such as Siniperca chuatsi (Zhou et al., 2010) Cyprinus carpio (Tang et al., 2012) Oreochromis niloticus (Yang et al., 2013) Ctenopharyngodon idella (Su et al., 2011) and Oncorhynchus mykiss (Salem et al., 2015). The objective of the study was to determine the best reference genes in the expression in different tissues in A. tropicus, knowing the most stable gene is of vital importance for future relative expression studies in the areas of physiology, biomedicine and genomics in this species.
MATERIALS AND METHODS
Fish
A total of 20 male adults A. tropicus were obtained. Individuals (550-580 g and from 30 to 35 cm total length) from captivity at the facilities of the Tropical Aquaculture Laboratory of the DACBiol-UJAT. The organisms were kept in polyethylene tanks measuring 1.94 m in diameter and 0.70 m in height. The diet provided was based on balanced feed for trout and contained 46% protein and 16% lipids with pellet sizes ranging from 5.5 to 9.0 mm (El Pedregal® Silver Cup, Toluca, Mexico).
Sampling, total RNA extraction and cDNA synthesis
Subsequently, individuals of A. tropicus were euthanized by thermal shock (-4 ºC) according to the methodology of Matthews and Varga (2012) and dissected to obtain six tissues: intestine, muscle, gill, stomach, brain and liver. Extraction of RNA was performed from tissues pooled per replicate using the Trizol Reagent (Invitrogen, Carlsbad, USA) obtaining an integrity value of 9.7. cDNA was synthesized using one microgram of RNA and random primer with an iScriptTM Select 170-8896 cDNA synthesis kit (Bio-Rad, Hercules, California, USA) following the manufacturer’s instructions.
Quantitative polymerase chain reaction (qPCR)
Resulting cDNA from adult tissues were diluted in 200 μL-distilled water. The qPCR reactions were performed in a 96-well CFX96 Real-Time System Thermal Cycle (Model C1000, California, USA) thermocycler. The reaction mixture included 10 μl of Eva Green master mix, 2-μl cDNA and 0.2 μM of each primer. The specific primers used in this analysis are given alfa elongation factor (ef1-α), beta-actina (actb) (from sequences of Atractosteus tropicus), 18S ribosomal RNA (18s rrna) (from sequences of Lepisosteus osseus), beta-2-microglobulin (b2m), Tubulin alpha (α-tub) and glyceraldehyde 3-phosphate dehydrogenase (gapdh) (from sequences of Lepisosteus oculatus) (Table I). The thermal program included 2 min at 95 °C, followed by 38 cycles at 95 °C for 10 s, 60 °C for 30 s and extension at 70° C for 5 s. All reactions were performed in duplicate. A standard curve for each pair of primers was generated to estimate amplification efficiencies based on known amounts of cDNA (four serial dilutions corresponding to cDNA transcribed from 100 to 0.1 ng of total RNA). In the melting curve analysis, it was determined that the melting temperature peak varied between 81.5 and 83 °C, which corresponded to the product obtained by these primers. In addition, the absence of primer dimers and nonspecificities was confirmed.
RESULTS
Analysis of specificity and reliability of qPCR primers
The primers for qPCR of the six candidate reference genes elongation factor alpha (ef1-α), beta-actin (actb), 18S ribosomal RNA (18s rrna), beta-2-microglobulin (b2m), Tubulin alpha (α-tub) and glyceraldehyde 3- phosphate dehydrogenase (gapdh) were subjected to PCR analysis specific ordinary before qPCR. The results showed that the six reference genes produced a single band (Fig. 1). The melting curves of the six candidate reference genes are all single peaks, indicating that the primers’ specificity is right, and no primer-dimers are present (Fig. 2). Besides, standard curves were performed to calculate amplification efficiency (E) and correlation coefficients (R2) according to the Cq values of each candidate reference gene amplified by qPCR using the A. tropicus brain cDNA (Fig. 3).
Table I. Primer sequences and amplification parameters of six candidate reference genes of Atractosteus tropicus used in qPCR analysis.
| Gene | Primer sequences (5´–3) | Product size (bp) | Amplification efficiency (%) | R2 | GenBank accession numbers |
| 18s rrna | F: GGTAACGGGGAATCAGGGTT R: TCCAATTACAGGGCCTCGAA | 156 | 100.18 | 0.9974 | AF188369.1 |
| gapdh | F: GGAATCAACGGATTTGGCCG R: TCACCTCCCCATGAAAACGG | 163 | 97.40 | 0.9972 | XM_006642348.2 |
| b2m | F: TTTACCTGGACTGGGGGCTA R: GCGAGGCGCCATAAATCAAC | 139 | 94.23 | 0.9924 | XM_015346206.1 |
| actb | F: GAGCTATGAGCTGCCTGATGG R: GTGGTCTCATGAATGCCACAGG | 119 | 97.10 | 0.9956 | KT351351.1 |
| α-tub | F: TCAGCCTCTTTTTGTCAGGCT R: GCATGTGATGAGCAAAGACCA | 181 | 94.35 | 0.9977 | XM_015359451.1 |
| ef1-α | F: CCTGCAGGACGTCTACAAGATCG R: GACCTCAGTGGTCACGTTGGA | 120 | 99.82 | 0.9891 | KT351350.1 |
BestKeeper gene analysis
The stability analysis shows BestKeeper SD and CV values of the six genes of references in the different tissues analyzed (Table II). Likewise, the results obtained in this study are shown in order of the most stable at least stable ef1-α, actb, 18s rrna, b2m, α-tub and gapdh in the intestine, ef1-α, actb, α-tub, b2m, 18s rrna and gapdh in the case of muscle, actb, ef1-α, 18s rrna, gapdh, b2m and α-tub in gill, 18s rrna, ef1-α, b2m, actb, gapdh and α-tub in stomach, ef1, 18s rrna, actb, b2m, α-tub and gapdh in brain and finally ef1-α, b2m, gapdh, actb, 18s rrna and α-tub liver.
Normfinder gene analysis
According to the results of the NormFinder analysis, they show both the stability value and the standard error of each candidate gene in the different tissues analyzed in adults of A. tropicus (Table III). Likewise, the results obtained in this study show that the most stable genes are 18s rrna, b2m and actb in the case of intestine, ef1-α, b2m and
Table II. BestKeeper analysis results of six candidate reference genes of Atractosteus tropicus.
| Intestine | Muscle | Gill | Stomach | Brain | Liver | |||||||||||||
| Gen name | SD (±cq) | CV (%cq) | r | SD (±cq) | CV (%cq) | r | SD (±cq) | CV (%cq) | r | SD (±cq) | CV (%cq) | r | SD (±cq) | CV (%cq) | r | SD (±cq) | CV (%cq) | r |
| 18s rrna | 0.12 | 0.53 | 0.99 | 1.25 | 4.82 | 0.84 | 0.40 | 1.71 | 0.54 | 0.03 | 0.13 | 0.96 | 0.14 | 0.57 | 0.93 | 0.31 | 1.56 | 1.00 |
| gapdh | 3.66 | 14.78 | 1.00 | 1.00 | 3.60 | 0.47 | 0.43 | 1.91 | 0.09 | 0.47 | 1.74 | 0.79 | 0.35 | 1.70 | 0.77 | 0.23 | 0.21 | 0.77 |
| b2m | 0.38 | 1.34 | 0.83 | 0.35 | 1.02 | 0.77 | 0.48 | 2.01 | 1.00 | 0.22 | 0.99 | 0.44 | 0.25 | 0.93 | 0,81 | 0.21 | 0.93 | 0.68 |
| actb | 0.12 | 0.36 | 0.98 | 0.10 | 0.31 | 0.81 | 0.01 | 0.26 | 0.82 | 0.41 | 1.47 | 1.00 | 0.20 | 0.86 | 0.74 | 0.29 | 1.12 | 1.00 |
| α- tub | 0.54 | 1.99 | 0.81 | 0.12 | 0.44 | 1.00 | 0.61 | 2.45 | 0.72 | 0.78 | 3.24 | 0.09 | 0.29 | 1.46 | 0.90 | 0.42 | 1.64 | 0.99 |
| ef1-α | 0.10 | 0.49 | 0.53 | 0.01 | 0.002 | 0.62 | 0.08 | 0.27 | 0.51 | 0.10 | 0.55 | 1.00 | 0.13 | 0.49 | 1.00 | 0.12 | 0.66 | 0.78 |
SD, Standard; CV, coefficient of variance, r, coefficient of correlation.
Table III. NormFinder analysis results of six candidate reference genes of Atractosteus tropicus.
| Gen name | Intestine | Muscle | Gill | Stomach | Brain | Liver | ||||||
| Stability value | Standard error | Stability value | Standard error | Stability value | Standard error | Stability value | Standard error | Stability value | Standard error | Stability value | Standard error | |
| 18s rrna | 0.004 | 0.0055 | 0.067 | 0.0060 | 0.706 | 0.0052 | 0.085 | 0.0042 | 0.689 | 0.0145 | 0.233 | 0.0086 |
| gapdh | 0.971 | 0.0086 | 1.545 | 0.0086 | 0.117 | 0.0040 | 0.613 | 0.0048 | 0.048 | 0.0067 | 0.011 | 0.0045 |
| b2m | 0.004 | 0.0065 | 0.014 | 0.0058 | 0.117 | 0.0042 | 0.504 | 0.0088 | 0.290 | 0.0157 | 0.014 | 0.0048 |
| actb | 0.152 | 0.0089 | 2.190 | 0.0080 | 0.753 | 0.0068 | 0.085 | 0.0043 | 0.336 | 0.0092 | 0.026 | 0.0080 |
| α- tub | 0.164 | 0.0293 | 0.163 | 0.0094 | 0.929 | 0.0059 | 1.421 | 0.0065 | 0.050 | 0.0086 | 0.051 | 0.0172 |
| ef1-α | 1.368 | 0.0178 | 0.014 | 0.0056 | 0.706 | 0.0172 | 0.085 | 0.0043 | 0.046 | 0.0055 | 0.266 | .00290 |
18s rrna in muscle, gapdh, b2m, 18s rrna in gill, 18s rrna, actb and ef1-α in stomach ef1-α, gapdh and α-tub in brain and finally gapdh, b2m and actb in liver.
geNorm gene analysis
The results of the geNorm analysis of each candidate reference gene in the different tissues analyzed in adults of A. tropicus show that the M values of the six candidate reference genes are all less than 1.5, indicating that the seven genes are suitable genes of reference (Fig. 4). The stability of the expression of the seven candidate reference genes in both is classified in descending order according to the principle that the lower the M value, the better the stability of the gene expression: 18s rrna, α-tub, actb, b2m, ef1-α, and gapdh in intestine, ef1-α, actb, 18s rrna, b2m, gapdh, α-tub in the case of muscle, actb, ef1-α, 18s rrna, gapdh, α-tub and b2m in gill, 18s rrna, ef1-α, gapdh, α-tub, b2m and actb in stomach, ef1-α, gapdh, actb, b2m, 18s rrna and tuba in brain and finally 18s rrna, ef1-α, gapdh, actb, α-tub and b2m in liver.
DISCUSSION
The qPCR is an effective method based on the polymerase chain reaction (PCR), which can amplify and quantify DNA molecules or specific complementary DNA (cDNA). This method allows us to access reliable data and precise information on the genetic expression of the cells under study, and frequently it is combined with a retro-transcription reaction (RT-qPCR). This method has become a more suitable choice for performing a rapid and quantitative examination for specific gene expression (Wang and Zhang, 2012). Nevertheless, selecting a suitable reference gene is the precondition for analysis of the relative expression of a target gene in quantitative real-time PCR (Wang et al., 2018).
Considering the above-mentioned, the most important characteristic of any reference gene candidate is the stability of its expression, regardless of in which tissues, developmental restrictions or physiological states are expressed (Yang et al., 2013). Likewise, Schaeck et al. (2016) suggest using at least two reference genes for normalization and that these genes are previously validated using a larger set of reference genes (n=10) to identify the most stable genes for each tissue/ cell type and each experimental condition. In this sense, algorithms such as BestKeeper, NormFinder and GenNorm (Wang et al., 2012) are used to evaluate the stability of these genes. Thanks to these algorithms, the stability of the reference gene candidate can be identified and evaluated for the correct normalization being therefore, an essential tool for an adequate selection. However, due to the characteristics of each of these platforms, it is necessary to select what gathers the requirements of the research work (De Spiegelaere et al., 2015).
Regarding our results, in the case of intestine and stomach the most stable gene was 18s rrna, which correspond with the work done in species such as Nile tilapia (Oreochromis niloticus), carp (Ctenopharyngodon Idella), Asian sea bass (Lateolabrax maculatus) and American catfish (Ictalurus punctatus) (Yang et al., 2013; Su et al., 2011; Wang et al., 2018; Small et al., 2008), presenting good stability in other tissues such as heart, liver, muscle, spleen, skin and kidney without being affected by any treatment.
It is important to mention that 18s rrna is considered an appropriate gene in embryogenesis in Zebra fish (Danio rerio), fathead minnow (Pimephales promelas), Channel catfish (Ictalurus punctatus) and Atlantic salmon (Salmo salar) (McCurley and Callard, 2008; Filby and Tyler, 2007; Small et al., 2008; Jorgensen et al., 2006; Kortner et al., 2011). Additionally, 18S rRNA gene has been detected in ancestral species such as longnose gar (Lepissoteus osseus), green sturgeon (Acipenser medirostris) in muscle and in bowfin (Amia calva) in fin (Krieger and Fuerst, 2002). Studies on the expression of growth hormone in larvae of alligator gar (Atractosteus spatula) used the 18s rrna gene to normalize the relative expression (Cahu et al., 2004; Revol et al. 2005; Panserat and Kaushik, 2010). It is important to highlight that for A. tropicus this gene can be used for nutrigenomic studies with tissues such as the intestine and stomach since it has good stability.
In the case of muscle, brain and liver, the most stable gene was ef1-α for A. tropicus adults. These results are consistent with those reported in species such as common carp (Cyprinus carpio), reporting greater stability in the liver, brain, hypothalamus, heart and kidneys (Tang et al., 2012), in O. niloticus (Yang et al., 2013) in muscle and heart. Similarly, ef1-α has been reported in common lancelet (Branchiostoma lanceolatum), Senegal sole (Solea senegalensis), Atlantic halibut (Hippoglossus hippoglossus), grass carp (Ctenopharyngodon idella), Korean rockfish (Sebastes schlegeli) (Carlos et al., 2008; Infante et al., 2008; Tang et al., 2012; Wang and Zhang, 2012; Liman et al., 2013), showing high stability in the different tissues analyzed in these species. On the other hand, ef1-α would be the ideal reference gene in studies involving the expression of genes involved in metabolism and neurofunctional (Diotel et al., 2010; Zheng et al., 2013), as well as in rainbow trout (Oncorhynchus mykiss) when analyzing the gene expression in liver and muscle tissues using different diets (Kolditz et al., 2008). Finally, for A. tropicus, EF1-α was an excellent reference gene for analysis of relative gene expression of lipogenic genes during the initial ontogeny for A. tropicus (Jiménez-Martínez et al., 2019) and in juveniles feed with diets supplemented with different concentrations of β-glucans (Nieves-Rodríguez et al., 2018).
In gills, actb gene was highly stable in adults of A. tropicus, which are agreed with species such as Turbot (Scophthalmus maximus) (Dang and Sun, 2011) and bastard halibut (Paralichthys olivaceus) (Zheng and Sun, 2011), been the best reference gene not only for gill, also for liver, spleen, kidney, heart muscle, brain and intestine. Likewise, actb is considering the best reference gene in different tissues in teleosts (Deloffre et al., 2012). It is important to point-out that gill tissue is the first line of defense against pathogens suspended in the aquatic environment, therefore, cells need to be fastly replicated (Hibbeler et al., 2008). Finaly, ACTB has been used as reference gene for toxicology, osmorrgulation and hypoxia studies (Wong et al., 2001; Lin et al., 2004; Bridle et al., 2006).
In the case of ef1-α and b2m they were the least stable genes in our study, however in bastard halibut (Paralichthys olivaceus) stands out, in which it mentions that α-tub is the best reference gene for spleen, heart, muscle and gill tissues (Zheng and Sun, 2011). While b2m alone in the geNorm program was one of the most stable in branchia A. tropicus similar to those occurring in larval development and tissues in the zebrafish Danio rerio under treatments such as different chemicals (McCurley and Callard, 2008).
Based on BestKeeper, NormFinder, and geNorm analyses, the most stable genes for A. tropicus were ef1-α, followed by 18s rrna and actb, so they are adequate as reference genes and can be used individually; however, it is advisable to use any of them to quantify the relative gene expression in A. tropicus.
ACKNOWLEDGMENTS
This study was supported by the projects SAGARPA-2011-08-164673 and CB-2016-01-282765. The author thanks to the Consejo Nacional de Ciencia y Tecnología and Programa Institucional de Superación Académica for the scholarship awarded.
Statement of conflict of interest
The authors have declared no conflict of interest.
Ethical approval
All applicable international, national, and/or institutional guidelines for the care and use of animals were followed by the authors.
Figures
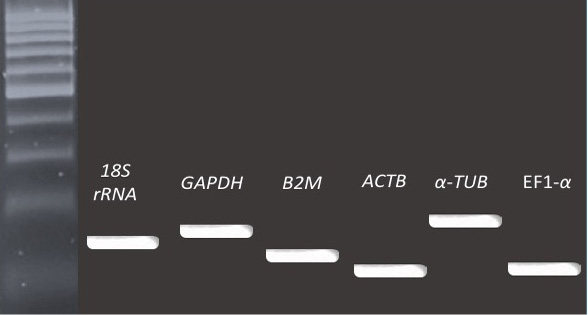
Agarose gel with PCR products of six candidate reference genes of Atractosteus tropicus. six candidate reference genes of Atractosteus tropicus for qPCR. (A) alfa elongation factor (ef1-α), (B) beta-actin (actb), (C) 18S ribosomal RNA (18s rrna), (D) beta-2-microglobulin (b2m), (E) Tubulin alpha (α- tub) and (F) Glyceraldehyde 3-phosphate dehydrogenase (gapdh).
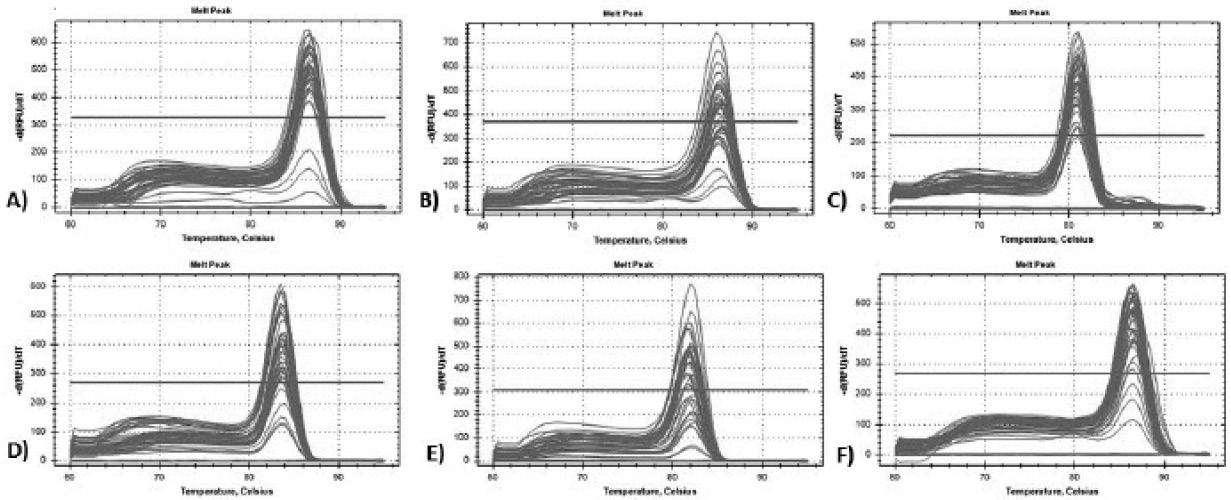
Melting curve analyses of six candidate reference genes of Atractosteus tropicus for qPCR. (A) alfa elongation factor (ef1- α), (B) beta-actin (actb), (C) 18S ribosomal RNA (18s rrna), (D) beta-2-microglobulin (b2m), (E) Tubulin alpha (α- tub) and (F) Glyceraldehyde 3-phosphate dehydrogenase (gapdh).
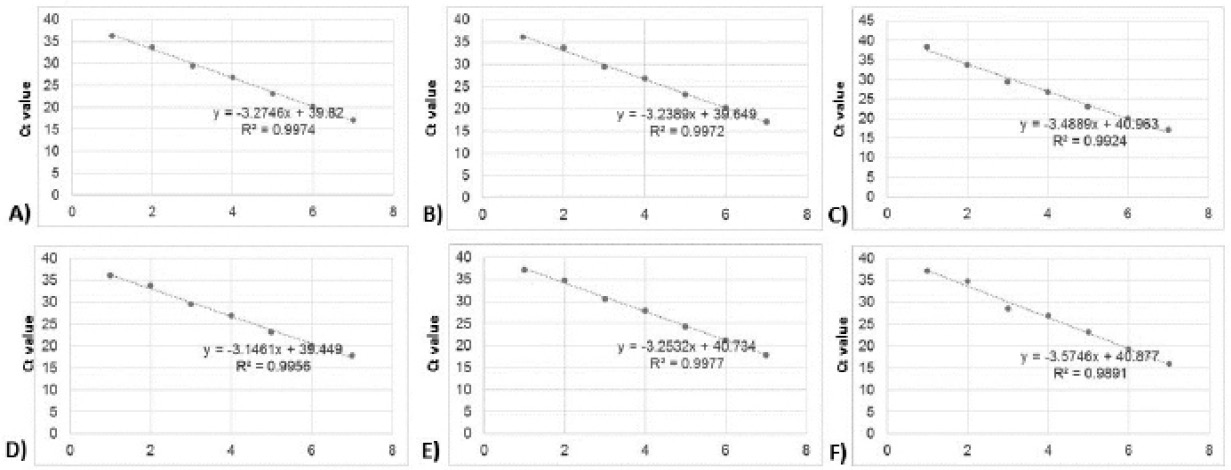
Standard curves for the determination of efficiency (E) and correlation coefficients (R2) of six candidate reference genes of Atractosteus tropicus for qPCR. (A) alfa elongation factor (ef1- α), (B) beta-actin (actb), (C) 18S ribosomal RNA (18s rrna), (D) beta-2-microglobulin (b2m), (E) Tubulin alpha (α- tub) and (F) Glyceraldehyde 3-phosphate dehydrogenase (gapdh).
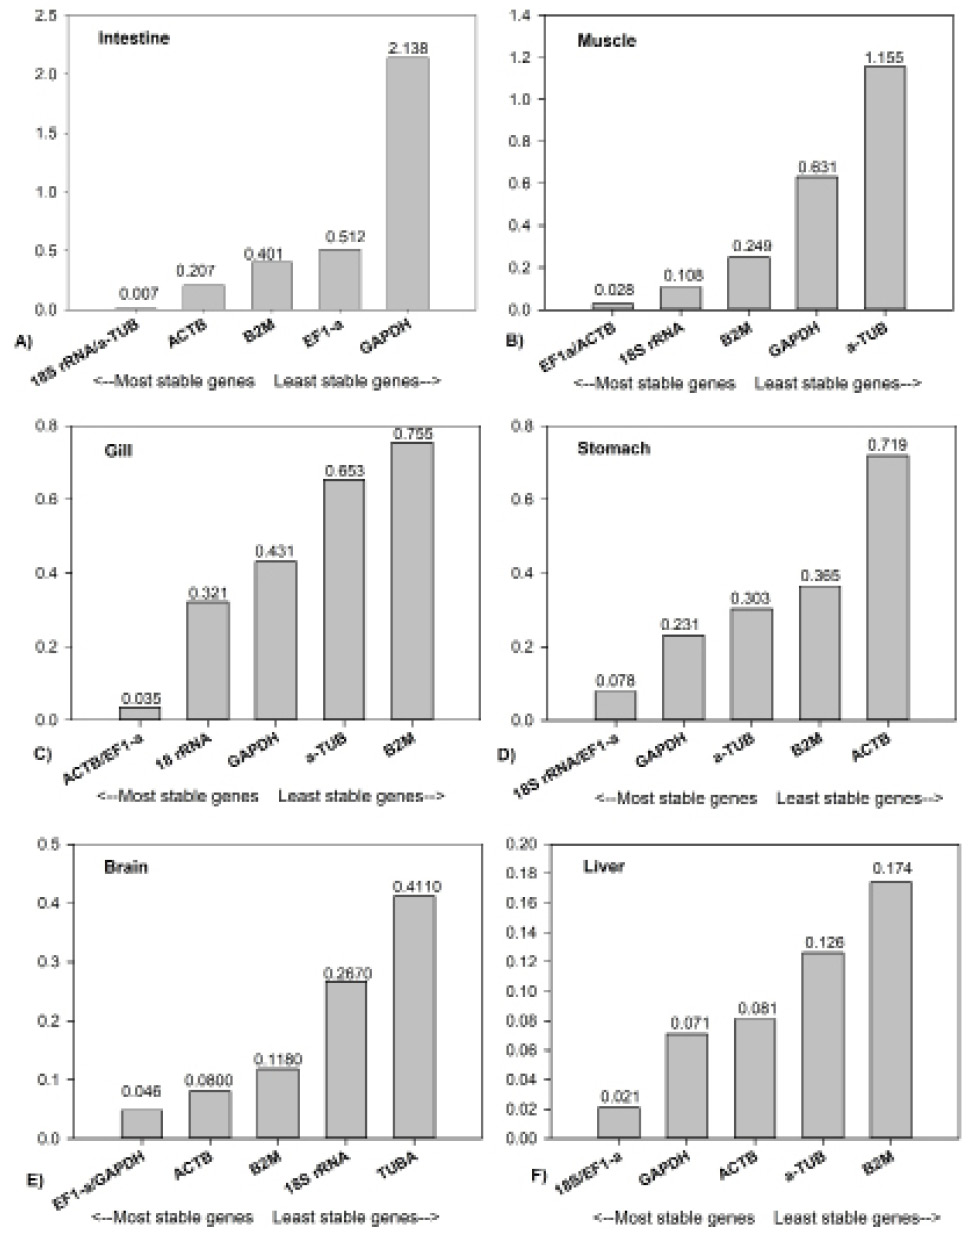
geNorm analysis results of six candidate reference genes of Atractosteus tropicus.
References
- The original cycle thresholds (cq values) of the six candidate reference genes were obtained from Bio-Rad CFX-96 Manager, and the data was sorted by Excel to assess differences in the expression levels of six candidate reference genes. Subsequently, the stability analysis of the candidate reference genes was carried out using three software packages, including BestKeeper v1 (https://www.gene-quantification.de/bestkeeper.html#download), geNorm integrated in qBasePlus (https://www.gene-quantification.de/hkg.html#genorm) and NormFinder v20 (https://www.moma.dk/normfinder-software/). The results of the three software packages were compared and analyzed to determine which gene is the most appropriate reference gene according to the methodology of Li et al. (2019).
Services
Article usage statistics
Loading…