
Quantitative real time polymerase chain reaction PCR (qPCR) may be utilized as a sensitive and reliable technique for the determination of circulating miRNA expression. Despite recent advancements, there is not a single consensus on the use of reference gene for quantification of circulating miRNAs through qPCR analyses in ALL. In the current study, we identified the reference gene that is the most suitable for qPCR normalization in patient and control plasma samples of ALL. Three highly reported reference genes namely RNU6-2, mir-16-5p and cel-mir-39-1 were selected as the candidate genes for normalization. Preliminary, quantification was performed through real time PCR in eight samples. The geNorm algorithm and comparative delta Cq method were used for selection of suitable reference gene out of the three candidate genes. The validation studies were, thereafter, performed on 112 samples including 87 patients and 25 normal healthy controls. The geNorm algorithm exhibited circulating mir-16-5p with the highest expression stability demonstrated by geNorm M value of 0.418. The comparative delta Cq method showed no significant difference in Cq values of ALL patients and healthy controls suggesting that mir-16-5p is the most stable normalizer for miRNA expression profiling assays in ALL. The results revealed that circulating mir-16-5p may be utilized as a suitable reference gene for normalization and improved quantification of miRNA.
Research Article · Volume 51, Issue 2, 3 March 2019 · Open Access
mir-16-5p as a Suitable Reference Gene for Normalization of Quantitative Real Time PCR in Acute Lymphoblastic Leukemia
· · · ·
Affiliations & Notes ⌄
- 1Institute of Biochemistry and Biotechnology, University of the Punjab, Lahore-54590 2Department of Physics, The University of Lahore, Lahore 3School of Biological Sciences, University of the Punjab, Lahore-54590 , * Corresponding author: saima.ibb@pu.edu.pk
Article Info ⌄
- Journal:
- Pakistan Journal of Zoology
- Published:
- 3 March 2019

From the article
- We identified mir-16-5p as a suitable reference gene out of three candidate genes for normalization of qPCR analysis.
- The present results proved the potential of mir-16-5p as a suitable reference gene to normalize qPCR analyses for determination of miRNA expression levels in ALL.
- In our study, mir-16-5p showed highest expression stability in plasma of ALL and normal controls out of three previously reported reference genes, RNU6-2, cel-mir-39-1 and mir-16-5p.
- This is the first study that reported mir-16-5p with highest suitability to function as reference gene for qPCR normalization experiments in miRNA expression profiling of ALL.
Selected from the article's own text.
Abstract
Introduction
MicroRNAs (miRNAs) are small non-coding RNAs, discovered first time in c. elegans in 1993 (Lee et al., 1993), play the major role in the regulation of gene expression either by suppressing their target messenger RNA (mRNA) and/or by up regulating the target genes in the 3′-untranslated region (3′-UTR) (Iorio and Croce, 2012; Reid et al., 2012). They are involved in different biological and molecular mechanisms like cell proliferation and stem cell formation (Hasani et al., 2014; Qin et al., 2018). Several miRNAs are engaged in the regulatory processes of hematopoiesis as they regulate differentiation of hematopoietic stem cells at different stages (Marcucci et al., 2011). A strong relationship between miRNA expression level and acute lymphoblastic leukemia (ALL) has been elucidated. ALL is the most common childhood malignancy worldwide including Pakistan with peak incidence at 6 years of age. The diagnosis of ALL involves bone marrow biopsy for which the children become reluctant due to its invasiveness. So the diagnosis of ALL demands the search for non-invasive techniques than can be utilized in developed and under-developed countries like Pakistan. Studies have demonstrated the potential of miRNAs in the diagnosis and prognosis of ALL. However, accurate miRNA quantification remained challenging in miRNA expression profiling studies. The miRNA profiling by quantitative real-time PCR (qPCR) is relatively more specific, reproducible, easily available and cost effective. It also requires very little amount of sample, even a single cell is sufficient for miRNA profiling. As miRNA expression levels are low in circulating fluid like plasma, so qPCR is well adapted for plasma miRNA profiling (El-Halawani et al., 2014). It has been considered a robust method for quantification of miRNA in ALL. However, quantification through qPCR demands normalization for accurate quantification of miRNA expression (Roberts et al., 2014; Schwarzenbach et al., 2015). Normalization controls for biological and technical variations in the qPCR assays. Several reports have been published on the selection of reference gene for different experiments; still there is no harmony on the use of reference gene for normalization of miRNA quantification using real-time PCR in ALL. The present research was established to determine suitable reference genes as a normalizer in qPCR assays for profiling circulating miRNA in ALL. We determined the stability of three reference genes including RNU6, mir-16-5p and c. eleg-mir-39 in plasma of ALL. We observed that circulating mir-16-5p exhibited highest stable expression in patients and control samples of ALL rendering it the reference gene most suitable for qPCR normalization in miRNA profiling.
Materials and methods
Study patients, controls and plasma samples
In this study, blood samples were obtained from 112 study subjects including patients (n=87) and normal controls (n=25). Patients registered at INMOL (Institute of nuclear medicine and oncology), Lahore, Pakistan from January, 2013 to November, 2016 and newly diagnose with ALL were included in this study. Normal controls were healthy individuals who have not any malignancy or infectious disease like hepatitis, HIV and tuberculosis. ALL patients and controls those have gone through any medical or surgical treatment were excluded from the study. Plasma was isolated within two to three hours after sample collection and stored at -80°C in aliquots until further use. Informed written consent was taken from the enrolled subjects to draw blood and use for the current research. The research protocols were approved by the review board of the ethical committee of School of Biological Sciences, University of the Punjab, Lahore, Pakistan with reference number 284/15 according to the rules of the Helsinki declaration approving human related research.
miRNA extraction from plasma
The total RNA containing miRNA was extracted from plasma using miRNA easy kit for serum/plasma from Qiagen (Hilden, Germany) according to the instructions from the manufacturer. The total RNA containing miRNA was stored quickly at -20°C till further processing.
Quantification of miRNA
The quantity of eluted miRNA in the total RNA was evaluated by NanoDrop (ND-2000) from Thermo scientific (USA). The optical density (OD) was taken at 260 nm against RNase free water blank.
Primer assays of candidate genes
The sequences of primers for candidate genes were obtained from miRNA database (www.mirbase.org). Primer assays (10X) were obtained from Qiagen (Hilden, Germany). Details on primer sequences, type and their accession number are provided in Table I.
Reverse transcription
The cDNA of total RNA containing miRNA was synthesized by reverse transcription reactions utilizing miScript II RT Kit from Qiagen (Hilden, Germany) following the protocols established by the company. The cDNA synthesized was kept at -20ºC for further analysis.
miRNA expression analysis by relative qPCR
The quantification cycle (Cq) of three reference genes including RNU6, cel-mir-39-1 and mir-16-5p was determined through real time PCR using SYBR green dye in miScript PCR kit from Qiagen (Hilden, Germany). The template used for real time PCR was cDNA synthesized by reverse transcription. The reactions were performed using real time thermal cycler CFX96TM system from BioRad®. Exogenous control i.e. c. elegans mir-39 was spiked in during RNA extraction as a normalization control and NTC (no template control) was considered as the negative control. All reactions were performed in duplicate and to check inter-run variations, two independent samples were run in all qPCR experiments.
Melt curve analysis
Melt curve analysis was performed to check the specificity of the amplification products. Melt curves were run from 65°C to 95°C using CFX96TM real time thermal cycler from BioRad®.
Statistical analyses
Raw data of fluorescent signals was analyzed by BioRad CFX96TM manager software (Version 3.1) with baseline subtracted curve fit and threshold set at 10.0 for Cq determination. The mean Cq values were calculated using duplicate Cq values. The data was analyzed using statistical tools including SPSS statistics 21 and prism software with GraphPad, version 7.0. Student’s t test was used for validation and Mann Whitney test was applied to compare two groups. All P values were two-sided, and the values less than 0.05 reflected statistically significant results.
Results
Study subjects characteristics
The study consisted of 112 subjects including 87 patients and 25 normal controls. There were 69 males and 18 females, and 16 males and 9 females in patients and control samples, respectively. The minimum age was 4 years in ALL patients and controls and the maximum age was 48 and 47 years in ALL patients and normal controls, respectively. There were 69% children and 31% adult cases in ALL patients. The basic demographic and clinical features of the enrolled subjects are presented in Table II. There was no significant difference in age, height and weight of patients and healthy controls (P>0.05). However, significant differences were observed in clinical features of the patients and controls (P<0.05).
Quantification of miRNA
The quantification of miRNA performed using NanoDrop showed concentration of miRNA at 260 nm and 280 nm. The optical density (OD) at A260/A280 gives an estimation of the RNA purity. The RNA with absorbance of A260/A280 ratio from 1.8 to 2.1 was used in the downstream processing.
Relative quantification revealed stable expression of circulating mir-16-5p
In our preliminary experiment, relative quantification was performed on 8 samples by taking three frequently reported reference genes including RNU6-2, and mir-16-5p and cel-mir-39-1. All samples were measured in the same run for the candidate reference targets to control for inter-run variation. Cq (quantification cycle) values of all three candidate genes were presented in Figure 1.
Results of comparative delta Cq method
The mean Cq ± standard deviation of RNU6-2, mir-16-5p and cel-mir-39-1 were calculated using comparative delta Cq method that showed mean values of 23.16±0.2963, 25.13±0.1193 and 25.18±0.4669, respectively. The mir-16-5p represented lowest standard deviation, exhibiting highest suitability for normalization. There was no statistically significant difference in mean Cq values of patients and control samples (P>0.05) as described in Table III.
Discussion
In this study, three candidate genes, RNU6-2, mir-16-5p and cel-mir-39-1 were analyzed for normalization of miRNA quantification in plasma samples of ALL and healthy controls as normal subjects. It was revealed that mir-16-5p showed non–significant difference in its expression in ALL patients and healthy controls (P>0.05) that demonstrated its stable expression in all samples (Table III). Further, geNorm analysis showed mir-16-5p lowest M score of 0.418 with highest stability. It has been reported that a reference gene must show stable expression in all the samples analyzed with no significant difference in expression (Das et al., 2016). We identified mir-16-5p as a suitable reference gene out of three candidate genes for normalization of qPCR analysis. Different strategies have been established to determine expression of circulating miRNAs including microarray, quantitative real-time PCR (q-PCR) (Yang et al., 2009), northern blotting (Lu et al., 2005), flow cytometry (Fichtlscherer et al., 2010), and deep sequencing (Wu et al., 2011). qPCR is well adapted for miRNA expression levels due to its high specificity, sensitivity and reproducibility (Mestdagh et al., 2008). As miRNA is present in a very little amount in circulation, so qPCR is best utilized for analyzing miRNA profiling in plasma. It requires a small amount of RNA sample as little as a single cell, while greater amount of sample (>1 μg) is required for profiling with other methods including microarray (El-Halawani et al., 2014). The qPCR has been reported as the gold standard method for quantitative expression profiling of miRNAs in serum/plasma and tissues as well. Normalization of qPCR analysis is mandatory to acquire accurate results in miRNA expression profiling. Although, exogenous miRNA spiked-in during extraction procedure endows check for technical variations, however, it is unable to normalize miRNA concentration in plasma due to sample to sample variation in patients and healthy controls. Therefore, selection of a suitable reference gene is mandatory to accurately interpret miRNA expression and improve its reliability and reproducibility. There is extensive literature on selection of reference genes for normalization of qPCR experiments in cells and tissues (Han et al., 2014; Rihani et al., 2013; Wotschofsky et al., 2011). Previously, RNU6-2 and RNU43 have been reported as normalizer in miRNA expression studies (Zhu et al., 2012). The candidate genes selected as reference for normalization as highly similar mature paralogous sequences do not exist for these particular miRNAs. A study on circulating miRNA profiling in ALL reported U6 as a reference gene (Swellam and El-Khazragy, 2016). However, there are certain limitations with respect to stability and abundance, in the use of snRNA and rRNA for expression profiling of circulating miRNAs. Recent studies reported that RNU6 is not a suitable reference gene for normalization of miRNA expression and the use of stably expressed miRNA has been suggested (Mase et al., 2017; Xiang et al., 2014). Our results also showed that stability of RNU6-2 was lower than mir-16-5p. A number of miRNAs have been reported as reference genes for normalization of qPCR analysis of circulating miRNA including miR-16, mir-93 in gastric carcinoma (Song et al., 2012), mir-191 and mir-148 in breast cancer (Hu et al., 2012). A study on plasma miRNA in B-ALL reported the use of multiple reference genes including mir-106a, mir-26b, mir-30a and mir-30d (Luna-Aguirre et al., 2015). Despite recent improvements in miRNA quantification strategies, there is no study reporting the use of reference gene for circulating miRNA profiling in ALL We designed our experiment to choose appropriate reference gene in qPCR normalization for miRNA expression studies in ALL. We identified mir-16-5p as the most suitable reference gene out of three candidate reference genes including RNU6-2, mir-16-5p and cel-mir-39-1 for qPCR normalization. Comparative delta Cq method identified mir-16-5p as the most stable normalizer gene for miRNA profiling in ALL. Furthermore, qBase+ was used to analyze quantification results (Hellemans et al., 2007) that uses geNorm algorithm to calculate expression stability (GeNorm M) (St-Pierre et al., 2017). The mir-16-5p showed lowest M value representing highest stability. The use of mir-16 has previously been described as a suitable reference genes for miRNA expression profiling in prostate cancer (Zhao et al., 2018) and cancer cell lines (Rihani et al., 2013). The mir-16 has also been reported as a reference gene to calculate normalized expression of plasma samples in chronic kidney disease (Lange et al., 2017). The present results proved the potential of mir-16-5p as a suitable reference gene to normalize qPCR analyses for determination of miRNA expression levels in ALL.
Conclusion
In our study, mir-16-5p showed highest expression stability in plasma of ALL and normal controls out of three previously reported reference genes, RNU6-2, cel-mir-39-1 and mir-16-5p. This is the first study that reported mir-16-5p with highest suitability to function as reference gene for qPCR normalization experiments in miRNA expression profiling of ALL.
Acknowledgements
The authors acknowledge the higher education commission (HEC), Pakistan for providing partial funding support to accomplish the present research.
Statement of conflict of interest
The authors declare that there is no conflict of interests regarding the publication of this article.
Figures
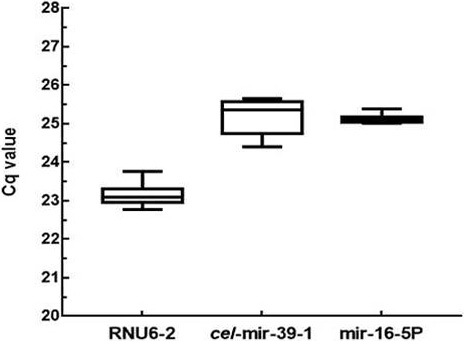
Comparison of quantitative real time PCR for RNU6-2, cel-mir-39-1 and mir-16-5p as reference genes determined through qPCR. Boxes represent mean and standard deviation and whiskers represent minimum and maximum values.
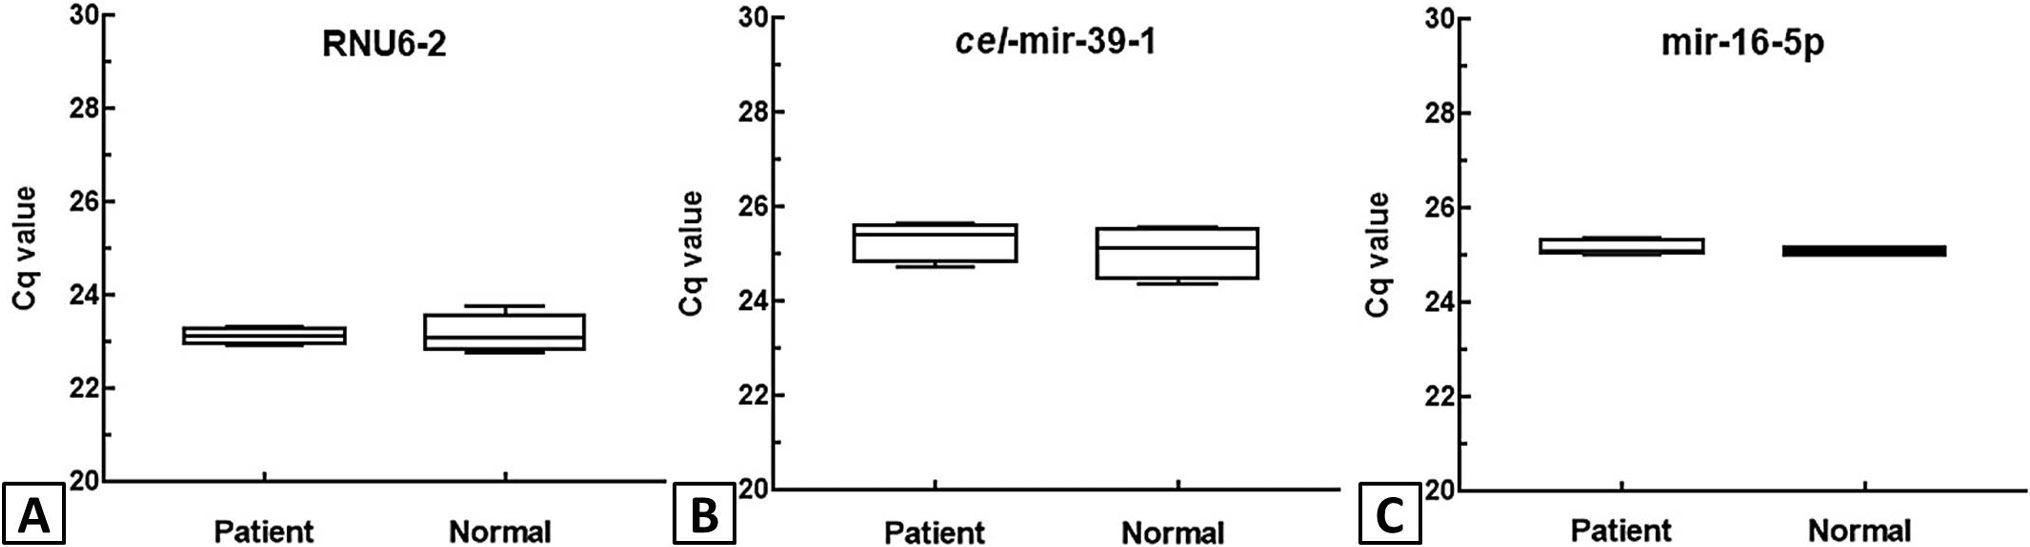
Determination of quantification cycle (Cq value) of the three candidate reference genes RNU6-2 (A) cel-mir-39-1 (B) and mir-16-5p (C) in the patient and normal control samples of ALL determined through qPCR. The values for each distribution are given as mean ± standard deviation as shown in box and whiskers plot.
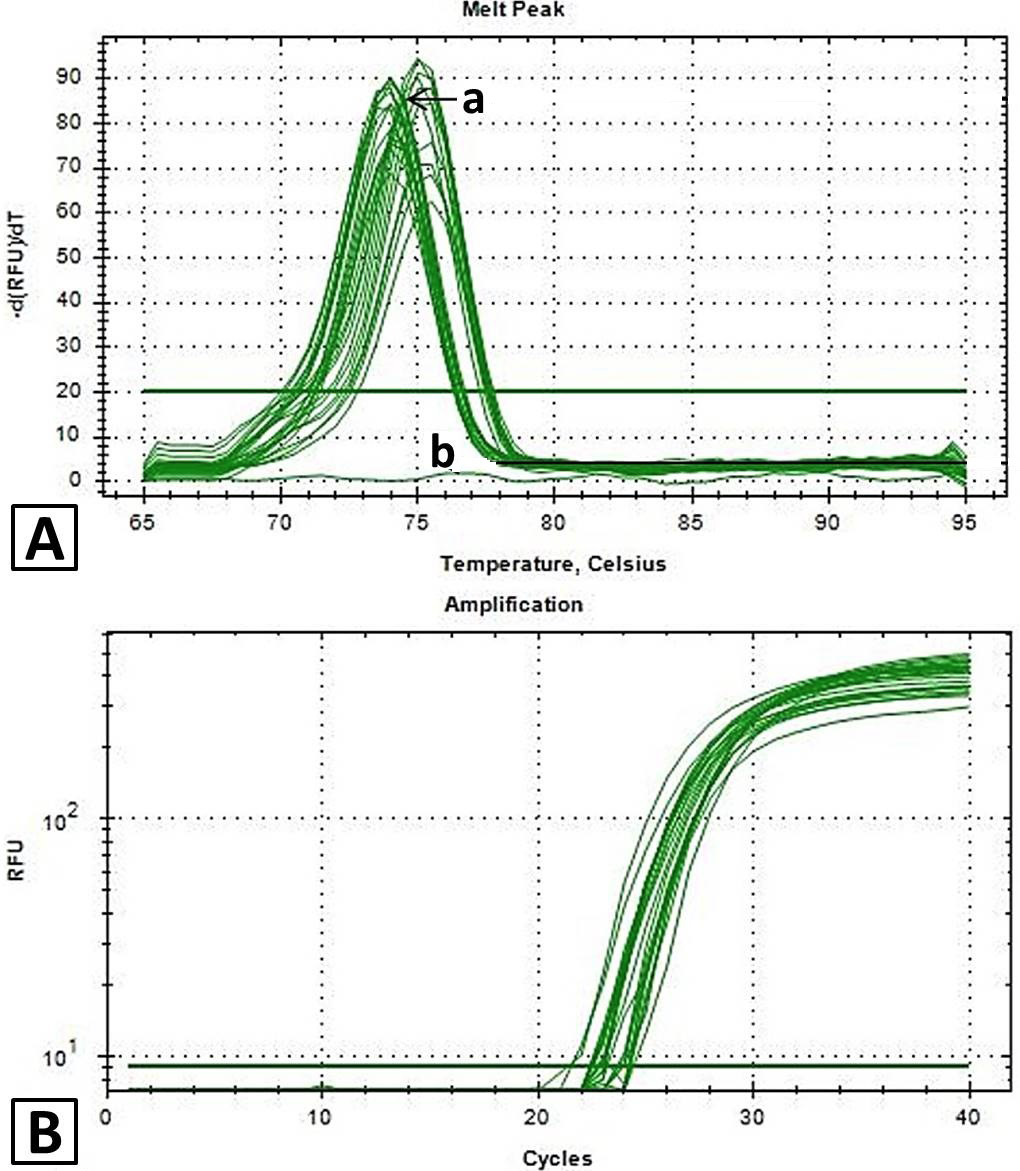
A, melt curve analysis of candidate reference genes for normalization of qPCR in ALL. A singe peak at melting temperature 75.5°C showed amplified products are specific and no non-specific amplification were occurred (a, specific amplification curves; b, NTC-no template control); B, amplification curves of candidate reference genes through qPCR in ALL showing relative fluorescence unit (RFU) of more than 103.
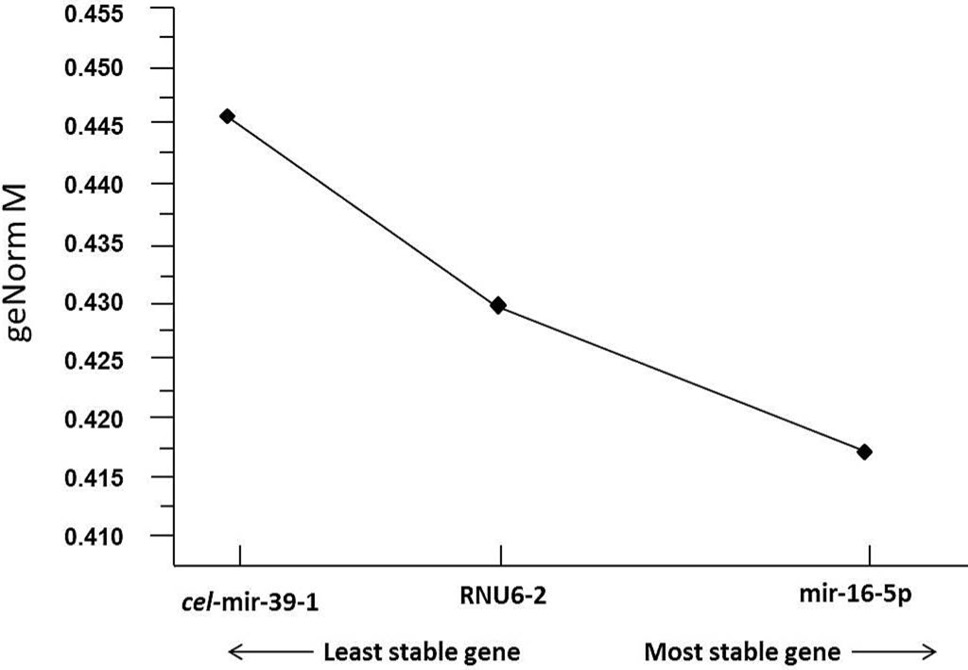
GeNorm analysis of average expression stability by qBase+ software: GeNorm results (M values) for candidate reference genes analyzed (normalized against c. elegans mir-39 as spike in control) indicated mir-16-5p as the most suitable reference gene with highest expression stability.
References
- Since normalization is the prerequisite for quantification of miRNAs in miRNA expression profiling, we designed our experiment to select for the suitable reference gene for miRNA profiling in ALL. For this purpose, preliminary experiment was performed on eight samples by taking three frequently reported reference genes including RNU6-2 (snRNA), mir-16-5p and cel-mir-39-1. The validation studies for the expression stability of the most stable gene were performed in 112 plasma samples of ALL. Stability of expression for all the candidate reference genes was measured by qPCR and the GeNorm M (average stability of expression) was calculated through qBase+ software (BioGazelle, Zwijnaarde, Belgium).
Services
Article usage statistics
Loading…