
This study comprehensive analysis the mitochondrial DNA (mtDNA) control-region variation in the Rajput population of Punjab, Pakistan, with the dual objective of evaluating forensic utility and exploring maternal genetic ancestry. Complete mtDNA control-region sequences were generated from 281 unrelated Rajput individuals and analyzed using HaploGrep3 and PhyloTree Build 17. A total of 277 unique haplotypes were identified, representing 19 macro-haplogroups. Nineteen macro-haplogroups were identified, dominated by M (41.99%) and U (21.71%), followed by R, H, T, and W, with minor West Eurasian, East Asian, and African contributions. These distributions indicate strong South Asian and West-Eurasian maternal components, complemented by low-frequency East Asian and African inputs. The Rajput population exhibited exceptionally high genetic diversity (HD = 0.996 ± 0.002) and a very low random match probability (RMP = 0.0042), highlighting the discriminatory potential of mtDNA markers in forensic identification. Phylogenetic and population-structure analyses (NJ, MDS, FST (fixation index), and haplogroup heatmaps) revealed that the Rajputs cluster primarily with South Asian populations while retaining close affinities to West Eurasian maternal lineages, reflecting historical admixture along Indo-Iranian migration corridors. This first extensive mtDNA study on the Rajput population contributes critical reference data for Pakistan’s forensic and anthropological mtDNA database and enhances understanding of South Asian maternal genetic diversity.
Research Article · Volume 58, Issue 6, 24 September 2026 · Open Access
Maternal Genetic Diversity and Historical Gene Flow in the Rajput Population of Pakistan Revealed by Mitochondrial DNA Control Region Analysis
· · · · · · ·
Affiliations & Notes ⌄
- 1Institute of Molecular Biology and Biotechnology, The University of Lahore, Lahore, Pakistan 2Department of Computer Science, Muhammad Ali Jinnah University, Karachi, Pakistan 3Precision Genomics Research Lab, Centre for Applied Molecular Biology, University of the Punjab, Lahore, Pakistan 4Institute of Rare Diseases, West China Hospital, Sichuan University, Chengdu 610000, China * Corresponding author: Muhammad.umer4@mlt.uol.edu.pk, umer.khan685@gmail.com
Article Info ⌄
- Journal:
- Pakistan Journal of Zoology
- Published:
- 24 September 2026

From the article
- It is the first comprehensive mitochondrial DNA (mtDNA) control-region analysis of the Punjab Rajputs of Pakistan.
- The findings show a strong South and West Eurasian maternal ancestry element of the Rajput gene pool supported with minimal quantities of East Asian and African inputs reflecting past gene flow across the Indo-Iranian corridor.
- Phylogenetic and population-structure analyses revealed tight affiliations of Rajputs with bordering South Asian populations but with differentiation from East Asian and African populations that was detectable.
- This research provides a valuable reference dataset for Pakistan’s forensic and anthropological mtDNA repositories, enhances understanding of South Asian maternal population structure, and aids in reconstructing the history and genetic heritage of the Rajput population.
Selected from the article's own text.
Abstract
INTRODUCTION
Mitochondrial DNA (mtDNA) is a circular, double-stranded molecule approximately 16.6 kb in length, present in thousands of copies per cell . It is transmitted exclusively through the maternal line, with negligible recombination, allowing direct reconstruction of maternal genealogies across generations . This uniparental mode of inheritance preserves ancestral lineages and enables reconstruction of population histories, migration routes, and demographic events . Because mtDNA accumulates mutations at a relatively steady rate, its hypervariable control region is particularly informative for both forensic and anthropological studies .
Pakistan’s population is characterized by remarkable cultural and linguistic heterogeneity but remains under-represented in global mitochondrial datasets . Most prior studies have examined small regional groups or limited haplogroup subsets, restricting their use for forensic interpretation and population comparisons . Comprehensive mtDNA reference data from large, well-defined ethnic groups are essential for improving the reliability of forensic identification and for understanding the maternal genetic landscape of South Asia.
The Rajput community, one of the historically prominent lineages of South Asia, offers a unique opportunity to examine maternal ancestry. Originating in the northern regions of the Indian subcontinent, the Rajputs are traditionally regarded as descendants of ancient Indo-Aryan warrior clans . Following successive cultural and religious transitions, many Rajput groups in present-day Pakistan converted to Islam while maintaining distinct clan identities (Mahmood, 2020). Previous regional genetic analyses, including work in Khyber Pakhtunkhwa and northern Punjab, have revealed substantial mtDNA diversity among populations with Rajput affiliation, suggesting long-term demographic interactions shaped by repeated migration and admixture ; .
Although Rajputs have played a central role in South Asian history, their maternal genetic background remains poorly defined. The present study addresses this gap through a detailed mtDNA control region analysis, aimed at resolving their genetic affinities, historical connections, and potential forensic relevance.
Materials And Methods
Sample collection
To investigate maternal genetic diversity and population structure in the Rajput population of Punjab, Pakistan, 281 unrelated individuals were recruited from multiple districts to ensure broad geographic representation (Fig. 1). Peripheral and central districts were both included to capture the demographic breadth of the Rajput community.
DNA extraction and quality control
Genomic DNA was extracted from whole blood using the standard phenol–chloroform method. DNA purity and concentration were determined using a NanoDrop™ 1000 spectrophotometer (Thermo Fisher Scientific, USA), and integrity was confirmed by 1% agarose gel electrophoresis in 1× TAE buffer. Samples were visualized under UV illumination to ensure high-quality DNA suitable for downstream sequencing.
mtDNA amplification and sequencing
The complete mitochondrial control region (positions 16,024-16,569 and 1-576; 1,122 bp total) was amplified using primer pair F15975/R635, previously validated in forensic mtDNA studies across South Asia. Each 25 µL PCR reaction contained 10-50 ng DNA template, 0.4 µM of each primer, and 2× PCR master mix (Thermo Fisher Scientific). PCR cycling conditions were initial denaturation at 95 °C for 5 min; 35 cycles of 95 °C for 30 s, 56.4 °C for 45 s, and 72 °C for 1 min; followed by a final extension at 72 °C for 10 min. Amplicons were verified by electrophoresis and purified for sequencing. High-quality bidirectional sequencing was performed using the Sanger method (outsourced to West China Hospital, Sichuan University, Chengdu, China) to ensure complete coverage of HVS I-III.
Sequence editing and haplogroup assignment
Raw chromatograms were edited in Chromas (https://technelysium.com.au/wp/chromas/), and sequences were aligned to the revised Cambridge Reference Sequence using Geneious v11.1.5 . Haplotypes and haplogroups were assigned using HaploGrep 3 (https://haplogrep.i-med.ac.at/), based on PhyloTree Build 17 , supplemented by mtDNA Profiler . Confidence thresholds were applied as > 90% (high), 80–90% (moderate, manually verified), and < 80% (re-evaluated using diagnostic motifs and regional literature). This multi-step verification minimized misclassification caused by recurrent mutations or homoplasy.
Genetic diversity and polymorphism analysis
Aligned control-region sequences were analyzed in DNA SP v6.12.03 to compute key population-genetic parameters: number of polymorphic sites (S), haplotype diversity (HD), nucleotide diversity (π), mean pairwise differences (MPD), and Tajima’s D test for neutrality. Forensic parameters power of discrimination (PD), random match probability (RMP), and genetic diversity (GD) were estimated following international forensic standards. All polymorphic sites were recorded relative to the rCRS, and diversity indices were calculated to quantify maternal variation within the Rajput population.
Phylogenetic and comparative analyses
Pairwise F<sub>ST</sub> values were computed in Arlequin v3.5 using 10,000 permutations to test for significance. Neighbor-Joining phylogenetic trees were generated in MEGA v11 with the Tamura-Nei model and 1,000 bootstrap replicates. Median-joining and reduced-median networks were constructed in NETWORK v10.2.0.0 (http://www.fluxus-engineering.com) to visualize intra-population lineage relationships.
Comparative control-region datasets were retrieved from EMPOP and published global populations to contextualize Rajput haplogroup frequencies within broader South Asian and West Eurasian frameworks. Multidimensional-scaling (MDS) and principal-coordinate (PCoA) analyses were performed in R v4.3.2 using the vegan, ape, and pegas packages, providing complementary visualization of inter-population affinities.
Statistical and computational analyses
All statistical computations were executed in R v4.3.2 and Python v3.12 for reproducibility. Bray–Curtis and Gower distance matrices were used to evaluate haplogroup similarities across populations. Graphical visualizations including heatmaps, haplogroup frequency plots, and network graphs were produced using ggplot2, igraph, and ggraph. All numerical results were cross-checked across software platforms to ensure analytical consistency. Population genetic parameters including haplotype diversity (HD), nucleotide diversity (π), mean pairwise differences (MPD), and Tajima’s D were estimated in R (using the pegas and ape packages), and summary statistics plus random match probability (RMP) were computed with PopGenome.
RESULTS
A total of 281 participants were recruited from multiple districts of Punjab, Pakistan. Figure 1 represents the area of sample collection. The highest numbers were obtained from Gujranwala (116), Lahore (62), Sialkot (9), Sheikhupura (9), Faisalabad (9), Sargodha (7) and Kasur (7). The samples were also collected from southern and western districts of Punjab. This distribution reflects the geographic spread of the Rajput community in the region and ensured diverse genetic representation for subsequent analyses.
Amplification of the mitochondrial DNA (mtDNA) control region (positions 16,024-16,569 and 1-576), encompassing hypervariable segments HVSI, HVSII, and HVSIII, using primers F15975 and R635 yielded a 1,122 bp fragment. Sanger sequencing of this fragment identified polymorphic sites characteristic of the Rajput population when compared with the revised Cambridge Reference Sequence (rCRS).
Haplotype identification and haplogroup assignment
Across the Rajput mtDNA dataset, 19 maternal haplogroup clusters were detected. The dominant lineage was macro-haplogroup M (41.99%; n= 118), reflecting the core South Asian ancestry. Additional frequent clusters were U (21.71%; n= 61) and R (11.03%; n= 31), followed by H (7.47%; n= 21), T (4.27%; n= 12), W (3.56%; n= 10), N (2.49%; n= 7) and D (2.14%; n= 6). Lower-frequency lineages included J (1.78%; n= 5), HV (1.07%; n= 3), I (0.71%; n= 2), and single representatives of A, G, L3, K, and S (0.36% each; n= 1) (Fig. 2A). Rare lineages captured by individual samples (e.g., X2c, P2, JT, B, and L3e) further highlight low-level diversity within the cohort (Supplementary Table S1).
Grouping haplogroups by broad geography showed a clear South Asian component (M and subclades) comprising ~42% of lineages. West Eurasian contributions (U, R, H, T, W, J, HV, I, K) together accounted for ~54%, while East/Southeast Asian inputs (N, D, A, G, S, and occasional F/B clades) summed to ~6%; an African signal (L3e) occurred at 0.36%. This pattern indicates strong regional continuity complemented by historically documented west-to-east gene flow and minor trans-regional inputs (Fig. 2B).
Haplogroup calls from HaploGrep 3 (v3.2.1) passed stringent QC: 74 variants passed, 207 flagged as warnings, and 0 failed, supporting high-confidence assignments with a subset of positions warranting careful interpretation (Fig. 2C). The comparative frequency bars against global references emphasize the South Asian-West Eurasian duality with trace East Asian/African signatures typical of populations at the Indo-Gangetic crossroads.
To visualize the spatial distribution of major mitochondrial haplogroups across the sampled districts, a heatmap was constructed based on haplogroup frequency data (Fig. 2D). Each row represents a district, and each column represents a macro-haplogroup. The gradient scale (0–1) corresponds to relative haplogroup frequency within each population.
Genetic diversity and polymorphism analysis of the Rajput population
Analysis of 281 samples from the Rajput population yielded 277 haplotype instances (Table I).
This comprehensive data set provides a representative overview of the maternal genetic variation within the population. Among the three hypervariable regions of the mitochondrial control region, HVSI (positions 16,024-16,365) exhibited the highest variability, containing 173 variable sites within 342 bp (50.6%). HVSII (np 73-340) displayed 46 variable positions across 268 bp (17.2%), whereas HVSIII (np 438–574) showed no variation among Rajput individuals.
The combined HVSI-HVSII inter-region (np 16,366-16,569 and 1-72) was the second most polymorphic, with 92 variable sites in 275 bp (33.5%), while the HVSII-HVSIII segment (np 341-437) remained identical to the rCRS.
Table I. Forensic and genetics parameter indices in Rajput population.
|
Genetic Parameter |
Value |
|
Total number of samples |
281 |
|
Total No. of distinct haplotypes |
277 |
|
Unique haplotypes |
275 |
|
Shared haplotypes |
2 |
|
Polymorphic positions |
349 |
|
Random match probability |
0.0042 |
|
Power of discrimination |
0.9958 |
|
Genetic diversity |
0.996 |
Table II. Genetic parameters comparison of different sub-ethnic groups of Pakistan.
|
Populations |
Code |
Linguistic affiliation |
No. of samples |
No. of haplotypes |
GD |
ND |
MPD |
Tajima’s D |
RMP |
|
Rajput (present study) |
JU |
Indo-European |
281 |
277 |
0.996 |
0.630 (0.2426) |
417.67(239.56) |
–1.431 |
0.0042 |
|
Arain |
AR |
Indo-European |
50 |
33 |
0.9788 |
0.009 (0.0047) |
10.39 (4.8) |
1.28 |
0.0087 |
|
Gujar |
GJ |
Indo-European |
50 |
25 |
0.9478 |
0.010 (0.0054) |
12.09 (5.5) |
1.04 |
0.0082 |
|
Bijarani |
BJ |
Indo-European |
20 |
14 |
0.998 |
0.012 (0.0067) |
6.13 (2.5) |
1.27 |
0.0048 |
|
Chandio |
CN |
Indo-European |
20 |
14 |
0.997 |
0.012 (0.0065) |
5.96 (2.5) |
1.09 |
0.0061 |
|
Ghallu |
GH |
Indo-European |
20 |
16 |
0.994 |
0.013 (0.0069) |
6.74 (2.9) |
1.69 |
0.0078 |
|
Khoso |
KH |
Indo-European |
20 |
19 |
0.998 |
0.011 (0.0062) |
7.40 (3.4) |
1.52 |
0.0091 |
|
Nasrani |
NS |
Indo-European |
20 |
13 |
0.992 |
0.010 (0.0053) |
5.70 (4.6) |
1.33 |
0.0035 |
|
Solangi |
SL |
Indo-European |
15 |
9 |
0.991 |
0.012 (0.0068) |
5.36 (2.9) |
1.39 |
0.0072 |
|
Bangash (Bhatti et al., 2016) |
BG |
Indo-European |
20 |
15 |
0.973 |
0.009 (0.0053) |
5.10 (2.3) |
1.93 |
0.0045 |
|
Khattak (Bhatti et al., 2016) |
KT |
Indo-European |
20 |
13 |
0.942 |
0.010 (0.0054) |
6.50 (2.7) |
1.22 |
0.0098 |
|
Mahsuds (Bhatti et al., 2016) |
MS |
Indo-European |
20 |
9 |
0.910 |
0.010 (0.0055) |
8.68 (2.4) |
0.59 |
0.0069 |
|
Orakzai (Bhatti et al., 2016) |
OK |
Indo-European |
20 |
14 |
0.957 |
0.011 (0.0051) |
5.51 (2.4) |
1.11 |
0.0022 |
|
Sindhi |
SI |
Indo-European |
23 |
21 |
0.992 |
0.014 (0.0096) |
5.66 (2.7) |
1.58 |
0.0063 |
|
Pathan |
PT |
Indo-European |
44 |
39 |
0.993 |
0.012 (0.0066) |
5.67 (2.7) |
1.95 |
0.0057 |
|
Baluchi |
BA |
Indo-European |
39 |
26 |
0.974 |
0.011 (0.0038) |
4.39 (2.2) |
1.84 |
0.0210 |
|
Brahui |
BR |
Dravidian |
38 |
22 |
0.952 |
0.015 (0.0051) |
4.83 (2.44) |
1.70 |
0.0110 |
|
Hazara |
HZ |
Indo-European |
23 |
21 |
0.992 |
0.014 (0.0062) |
6.20 (3.1) |
1.60 |
0.0010 |
|
Hunza Burusho |
HU |
Language Isolate |
44 |
32 |
0.980 |
0.012 (0.0011) |
6.46 (3.1) |
1.86 |
0.0069 |
|
Kalash |
KL |
Indo-European |
44 |
12 |
0.851 |
0.019 (0.0012) |
3.85 (1.9) |
0.04 |
0.0255 |
|
Makrani |
MK |
Indo-European |
33 |
24 |
0.975 |
0.013 (0.0042) |
6.63 (3.2) |
1.81 |
0.0096 |
|
Parsi |
PA |
Indo-European |
44 |
22 |
0.943 |
0.010 (0.0025) |
4.66 (2.3) |
1.50 |
0.0075 |
|
Karachi |
KA |
Indo-European |
100 |
77 |
0.992 |
0.010 (0.0052) |
5.57 (2.6) |
2.21 |
0.0084 |
|
Brahui |
BR |
Dravidian |
38 |
22 |
0.952 |
0.015 (0.0051) |
4.83 (2.44) |
1.70 |
0.0110 |
|
Hazara |
HZ |
Indo-European |
23 |
21 |
0.992 |
0.014 (0.0062) |
6.20 (3.1) |
1.60 |
0.0010 |
|
Hunza Burusho |
HU |
Language Isolate |
44 |
32 |
0.980 |
0.012 (0.0011) |
6.46 (3.1) |
1.86 |
0.0069 |
|
Gujarati |
GJ |
Indo-European |
22 |
18 |
0.998 |
0.015 (0.0011) |
6.29 (3.0) |
1.88 |
0.0089 |
Altogether, the Rajput dataset revealed 311 polymorphic positions across the entire control region, corresponding to a Random Match Probability (RMP) of 0.0042, a Power of Discrimination (PD) of 0.9958, and a Genetic Diversity (GD) of 0.996, confirming the extensive mtDNA variability and high individualization capacity within the Rajput population of Punjab.
The negative Tajima’s D value (-1.431; p = 0.047) further supports a scenario of recent population expansion or purifying selection acting on mtDNA lineages. Comparative analysis with other Pakistani subpopulations indicated that Rajputs exhibit the highest diversity indices, underscoring their rich maternal genetic structure and extensive lineage heterogeneity (Table II).
To visualize how this diversity is distributed geographically, spatial haplotype-sharing networks were constructed in R (version 4.3.2; R Core Team, 2023) using custom scripts and visualization packages, including igraph and ggraph (Fig. 3A). At the median threshold (Fig. 3A), a dense web of connections was observed, indicating widespread sharing of identical haplotypes across districts. When restricted to the top 34% of sharing links (Fig. 3B), strong genetic connections persisted, particularly between central and northern districts such as Gujranwala, Sheikhupura, and Lahore. At the most stringent threshold (top 15%; Fig. 3C), only the strongest connections remained, with these districts acting as central hubs in the maternal genetic network. This pattern suggests high historical and recent maternal gene flow within the region, with certain urban centers serving as major points of genetic exchange.
Principal Coordinates Analysis (PCoA) based on mtDNA haplogroup frequencies revealed clear genetic differentiation among districts in Punjab (Fig. 4). Axis 1 accounted for 11.9% of the variance, separating Fort Abbas, Kamalia, Rahimyar Khan, and Pattoki on the far right from the central cluster of districts such as Gujranwala, Lahore and Pakpattan. Axis 2 explained 8.4% of the variance, distinguishing Hafizabad, Jhang, Sheikhupura, Kasur, and Sargodha at the upper positive side from Okara, Haroonabad, Multan, and D.G. Khan at the lower negative side.
The plot revealed that while most districts formed a genetically cohesive central cluster, a few-such as Fort Abbas, Kamalia, Rahimyar Khan, and Pattoki-exhibited notable genetic divergence. This pattern likely reflects localized founder effects or limited maternal gene flow in these peripheral regions, contrasting with the overall genetic similarity observed among the central Punjab districts. Overall, the analysis highlights that while central Punjab populations (e.g., Gujranwala, Lahore, Pakpattan) show genetic homogeneity, certain peripheral districts such as Fort Abbas, Kamalia, and Rahimyar Khan exhibit distinct haplogroup frequency patterns, suggesting localized maternal differentiation.
Genetic relationships and population structure of the Rajput population
Multiple sequence alignment of the complete mtDNA control region sequences was performed using Cluster W in MEGA, followed by the computation of pairwise F<sub>ST</sub> genetic distances. To elucidate inter-population affinities, a hierarchical clustering (UPGMA) tree was generated in R (Fig. 5A), incorporating a comprehensive panel of global reference populations, including Rajput, Pathan, Shina-Gilgit, Gujarati, Saudi Arabian, Iranian, Yemeni, Chinese, Pan American, Southeast Asian, African, and European groups (Spanish, Greek, Italian, Hungarian, Romanian).
The resulting dendrogram revealed that the Rajput population clustered closely with South Asian (Pathan, Shina-Gilgit, Gujarati) and West Asian (Saudi Arabian, Iranian) lineages, while maintaining clear separation from East Asian, African, and American branches. This topology indicates that the Rajputs share strong maternal affinities with Indo-Iranian and West Eurasian gene pools, reflecting historical gene flow across South Asia and the Arabian corridor, consistent with their complex, admixed maternal ancestry.
To visualize the internal clustering of haplogroups within the Rajput population, a Neighbor-Joining tree based on Gower distance was constructed using complete control-region variants (Fig. 5B). The topology revealed three major macro-haplogroup radiations-M (South Asian), U-R-H (West Eurasian), and N-D (East Asian) each forming distinct but interconnected branches. The high density of terminal nodes and mixed color distribution indicate extensive maternal heterogeneity and overlapping lineage structure within the Rajput population.
Global FST mapping (Fig. 6) further supported these findings. The lowest FST values-indicating the highest genetic affinity, were observed between the Rajput population, South Asian groups, and selected European populations. In contrast, the highest FST values occurred with African, East Asian, and Melanesian populations. These geographic patterns mirror the relationships observed in both the multidimensional scaling plot (Fig. 7) and the dendrogram analysis (Fig. 5), reinforcing the presence of strong South and West Eurasian genetic links alongside clear differentiation from more distant populations.
To further investigate inter-population differentiation, a pairwise F<sub>ST</sub>–based similarity heatmap was generated (Fig. 8), illustrating genetic relationships between the Rajput population and a wide panel of global groups. The matrix revealed that Rajputs exhibit the strongest mitochondrial affinity with neighboring South Asian populations, including Sindhi, Gujarati, Shina-Gilgit, and Indian Muslims, as well as moderate similarity with West Asian groups such as Iranian, Yemeni, and Saudi Arabian populations. In contrast, distinct genetic differentiation was evident from East Asian (Chinese, Deng, Maonan), African, and Pan-American clusters, which occupied the lowest similarity range (blue-green zones). The overall topology demonstrates that Rajputs align firmly within the broader South-Central Asian genetic continuum, showing a transitional maternal profile between Indo-Iranian and West Eurasian groups, consistent with regional gene flow across Punjab, Iran, and Arabia over historical timescales.
Taken together, the dendrogram, heatmap, MDS plot, and global FST mapping present a consistent narrative: the Rajput population forms a unique South Asian cluster with strong ties to neighboring ethnic groups yet retains signals of European-related maternal haplogroups. This genetic complexity, as revealed by FST values, MDS clustering, and heatmap comparisons, highlights both the regional specificity and external influences present in the Rajput maternal gene pool. These findings provide valuable insights into the maternal population structure of the Punjab region.
In the Rajput dataset (n = 281), a total of 277 distinct haplotypes were identified, of which the vast majority were unique, reflecting rich mitochondrial variability. Haplotype diversity was extremely high (HD = 0.996), and nucleotide diversity was 0.630 ± 0.2426, consistent with pronounced genetic heterogeneity across the mtDNA control region. The mean pairwise difference (MPD = 417.67 ± 239.56) further underscored substantial maternal lineage diversity. Tajima’s D was negative (0.00–1.431), suggesting a recent population expansion or purifying selection acting on mitochondrial lineages. The RMP (0.0042) indicates a very high discriminating capacity of mtDNA markers for individual identification within the Rajput population.
DISCUSSION
This study is the first to present a comprehensive analysis of the complete mitochondrial DNA (mtDNA) control region in Punjabi Rajputs and reveals exceptionally high levels of maternal genetic diversity. Screening 281 individuals detected 277 distinct haplotypes, of which 275 were unique and only two were identical. Of the hypervariable segments, 194 positions showed variation. This high level of polymorphism produced a haplotype diversity of 0.996, a very low random match probability of 0.0042, and an almost maximum power of discrimination of 0.9958. Mean pairwise difference (MPD= 417.67 ± 239.56) and negative Tajima’s D (–1.431; p= 0.047) also indicate a recent population expansion or purifying selection on mtDNA lineages. These results position the Rajput population among South Asia’s most genetically diverse groups reported to date and underscore their two-fold importance for anthropological research and forensic use ; . Collectively, these findings situate the Rajput population within the broader South Asian genetic landscape and highlight its substantial forensic relevance.
As compared with other ethnic groups of Pakistan, Rajputs are more diverse at the haplotype level and richer genetically. Values of observed HD are 0.993 in Pathans, 0.992 for Kashmiris and Hazaras, 0.992 for Sindhis, and 0.975 for Makranis. Smaller endogamous groups such as the Kalash (HD= 0.851) and Mahsuds (0.910) are less diverse than these ; ; . Amongst Pakistan’s Indo-European speech populations, most populations are rich in distinctive haplotypes, yet the Rajputs stand out because nearly 90 % of their haplotypes are unique . Such extreme heterogeneity among maternal lineages likely reflects historical gene flow, admixture, and comparatively loose endogamy in comparison to highly fragmented groups .
At the international level, Rajputs reveal mtDNA diversity as high as, or greater than control sets of Netherlands, Japan, Henan Han Chinese, Ghana, and Sudan. For example, European populations like the Netherlands (HD ≈ 0.996; RMP ≈ 0.0037) and East Asian populations like Japan (HD ≈ 0.999; RMP ≈ 0.0095) and Henan Han Chinese (HD ≈ 0.999; RMP ≈ 0.0061) show lower discriminatory power (Supplementary Table S2). Other African groups such as Ghana (HD ≈ 0.987; RMP ≈ 0.013) and Sudanese HVRI sequences (RMP ≈ 0.0207) are also less diverse ; ; ; . These international comparisons demonstrate that the Rajputs possess one of the most heterogeneous maternal gene pools reported to date, and forensic indices surpass most reference populations. Full control-region-based comparisons were employed throughout to maintain methodological consistency.
Haplogroup composition analysis indicated a very complex pattern of maternal admixture. Predominance of Macro-haplogroup M (41.99%) and its descendant clades is indicative of far-reaching South Asian origins, followed by haplogroup U (21.71%) distributed over broad South Asia, Europe, and the Near East, and haplogroup R (11.03%), yet another lineage found over broad Eurasia. Other haplogroups that contributed were haplogroups H (7.47%), T (4.27%), W (3.56%), N (2.49%), and D (2.14%), while contributing smaller percentages were J, HV, I, K, and S, which are typically linked to West Eurasian descent. Lineages that originated from East and Southeast Asia, such as A, G, F, and B, were also present, with occasional African haplogroups (L3a, L3d, L3h ≈ 0.36%) and Oceanian lineages (P, S, E ≈ 0.36%). Despite their relative frequency, these signatures are in accord with previous accounts from coastal Pakistani populations, including the Sindhi and Makrani, where African origins are due to marine trade and routes involving the Indian Ocean slave trade . Increasing archaeological and genetic evidence support the fact of prehistoric maritime trade networks extending across the Arabian Sea and the Bay of Bengal . The occurrence of Oceanian-associated haplogroups such as B4a along the South Indian coastline indicates prehistoric long-distance links between South Asia and the Indo-Pacific, and their occurrence among the Rajputs confirms the perception of South Asia as an extensive prehistoric centre of genetic interchange extending far beyond .
South Asian haplogroup frequencies trace indigenous origins within Punjab Rajputs the indigenous origin within Punjab Rajputs but the predominant West Eurasian element is a manifestation of the historic genetic contributions by virtue of Persian and Greek immigrations and some other Turkic and Mughal immigrations ; . East and Southeast Asian haplogroup presence is indicative of the maternal contribution via the trans-regional movement and trading paths such as the Silk Road, whereas African and Oceanian signatures indicate the highly diversified phylogenetic profile of Punjab . Random distribution pattern among the haplogroups thus indicates the Rajputs to be genetically diverse due to an interaction between the local continuity and immigration from other places.
From a forensic perspective, the Rajput mtDNA dataset demonstrates exceptional discriminating capacity. The very low RMP (0.0042), high HD (0.996), and near-maximal PD (0.9958) confirm its value as a robust forensic reference for the Pakistani population. Maternally inherited mtDNA is particularly valuable for degraded samples and maternal kinship analyses, and the examination of the complete control region adds substantial discriminatory power . Low haplotype sharing further enhances the precision of individual identification. Haplogroup assignments by HaploGrep 2 (PhyloTree Build 17) were highly reliable, with > 80 % of samples achieving > 90 % confidence, ≈ 10 % at 80–90 %, and < 5 % below 80 %, confirming the accuracy of lineage classification.
From an anthropological standpoint, the Rajput maternal diversity reflects the intricate demographic history of South Asia. Centuries of migration, assimilation, and cultural contact are evidenced by the coexistence of South Asian, West Eurasian, East Asian, and African/Oceanian haplogroups within a single population . This aligns with extensive data showing that South Asia served both as a source and recipient of ancient human dispersals. Consequently, the Rajputs constitute a living genetic archive offering valuable insight into the region’s complex population history.
Population affinities were evaluated using pairwise F<sub>ST</sub> values. The Rajputs showed low differentiation from Sindhis (F<sub>ST</sub> = 0.012) and Rajpoots (0.015), moderate divergence from Gujars (0.091) and Makranis (0.330), and high differentiation from Kalash (0.249). Comparisons with non-South Asian populations indicated very low genetic distances to Europeans but greater divergence from Africans (0.239) and Melanesians (0.089) ; . These results confirm a predominantly South- and West-Eurasian maternal ancestry with minor intercontinental admixture. However, caution is warranted because these F<sub>ST</sub> values are derived solely from mtDNA control-region data. Multidimensional scaling and dendrogram analyses are preliminary and expanded whole-mitogenome data will be required for more refined conclusions.
While informative, several limitations remain. MtDNA reflects only maternal inheritance, omitting paternal and autosomal information. Y-chromosome and autosomal genomic analyses are essential for complete demographic reconstruction. Additionally, comparative datasets from Afghanistan, Iran, northern India, and Central Asia remain scarce but are critical to contextualizing Punjab’s maternal genetic history. All reported positions refer to the revised Cambridge Reference Sequence (rCRS).
CONCLUSION
It is the first comprehensive mitochondrial DNA (mtDNA) control-region analysis of the Punjab Rajputs of Pakistan. In 281 unrelated individuals, 277 distinct haplotypes were found, equating to exceptionally high maternal genetic diversity (HD = 0.996 ± 0.002) and an extremely low random match probability (RMP= 0.0042). The most common haplogroups were M (41.99 %), U (21.71 %), R (11.03 %), and H (7.47 %) and others with representation of T, W, J, HV, I, N, D, and L3 lineages. The findings show a strong South and West Eurasian maternal ancestry element of the Rajput gene pool supported with minimal quantities of East Asian and African inputs reflecting past gene flow across the Indo-Iranian corridor. Phylogenetic and population-structure analyses revealed tight affiliations of Rajputs with bordering South Asian populations but with differentiation from East Asian and African populations that was detectable. Both high haplotype diversity and low sharing of haplotypes emphasize the forensic utility of mtDNA in case work and regional databases.
This research provides a valuable reference dataset for Pakistan’s forensic and anthropological mtDNA repositories, enhances understanding of South Asian maternal population structure, and aids in reconstructing the history and genetic heritage of the Rajput population.
Declarations
Acknowledgments
The authors gratefully acknowledge the support of the Institute of Molecular Biology and Biotechnology, University of Lahore, and thank all volunteers who participated in the study.
Funding
The research received no external funding.
IRB approval
The study was reviewed and approved by the Ethical Review Committee of the Institute of Molecular Biology and Biotechnology (IMBB), The University of Lahore (Ref-IMBB/BBBC/23/901).
Ethics statement
All participants provided written informed consent. Peripheral venous blood was collected from each participant with written informed consent. All experimental procedures were conducted at the Institute of Molecular Biology and Biotechnology, University of Lahore. Ethical approval was granted by the Institutional Review Board of the University of Lahore, and all protocols followed the 1964 Declaration of Helsinki and its later amendments.
Data availability statement
The raw mtDNA sequence data are not publicly available due to participant confidentiality. However, summary statistics and analyses supporting the conclusions of this article are available from the corresponding author on reasonable request.
Generative AI and AI-assisted technology statement
The authors declare that no generative AI and AI assisted technology was used in the creation of this manuscript.
Supplementary material
There is supplementary material associated with this article. Access the material online at: https://dx.doi.org/10.17582/journal.pjz/20251028103544
Statement of conflict of interest
The authors have declared no conflict of interest.
Figures
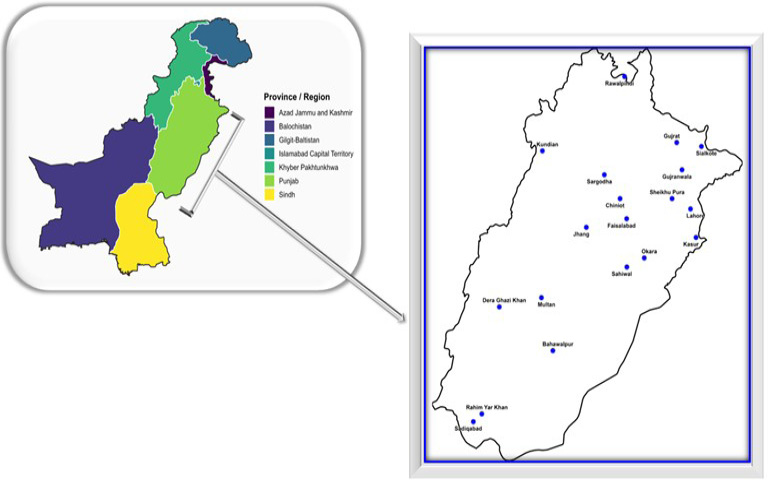
Geographic distribution of sampling sites for the Rajput population study. (Figure 4 shows magnified version of Punjab count).
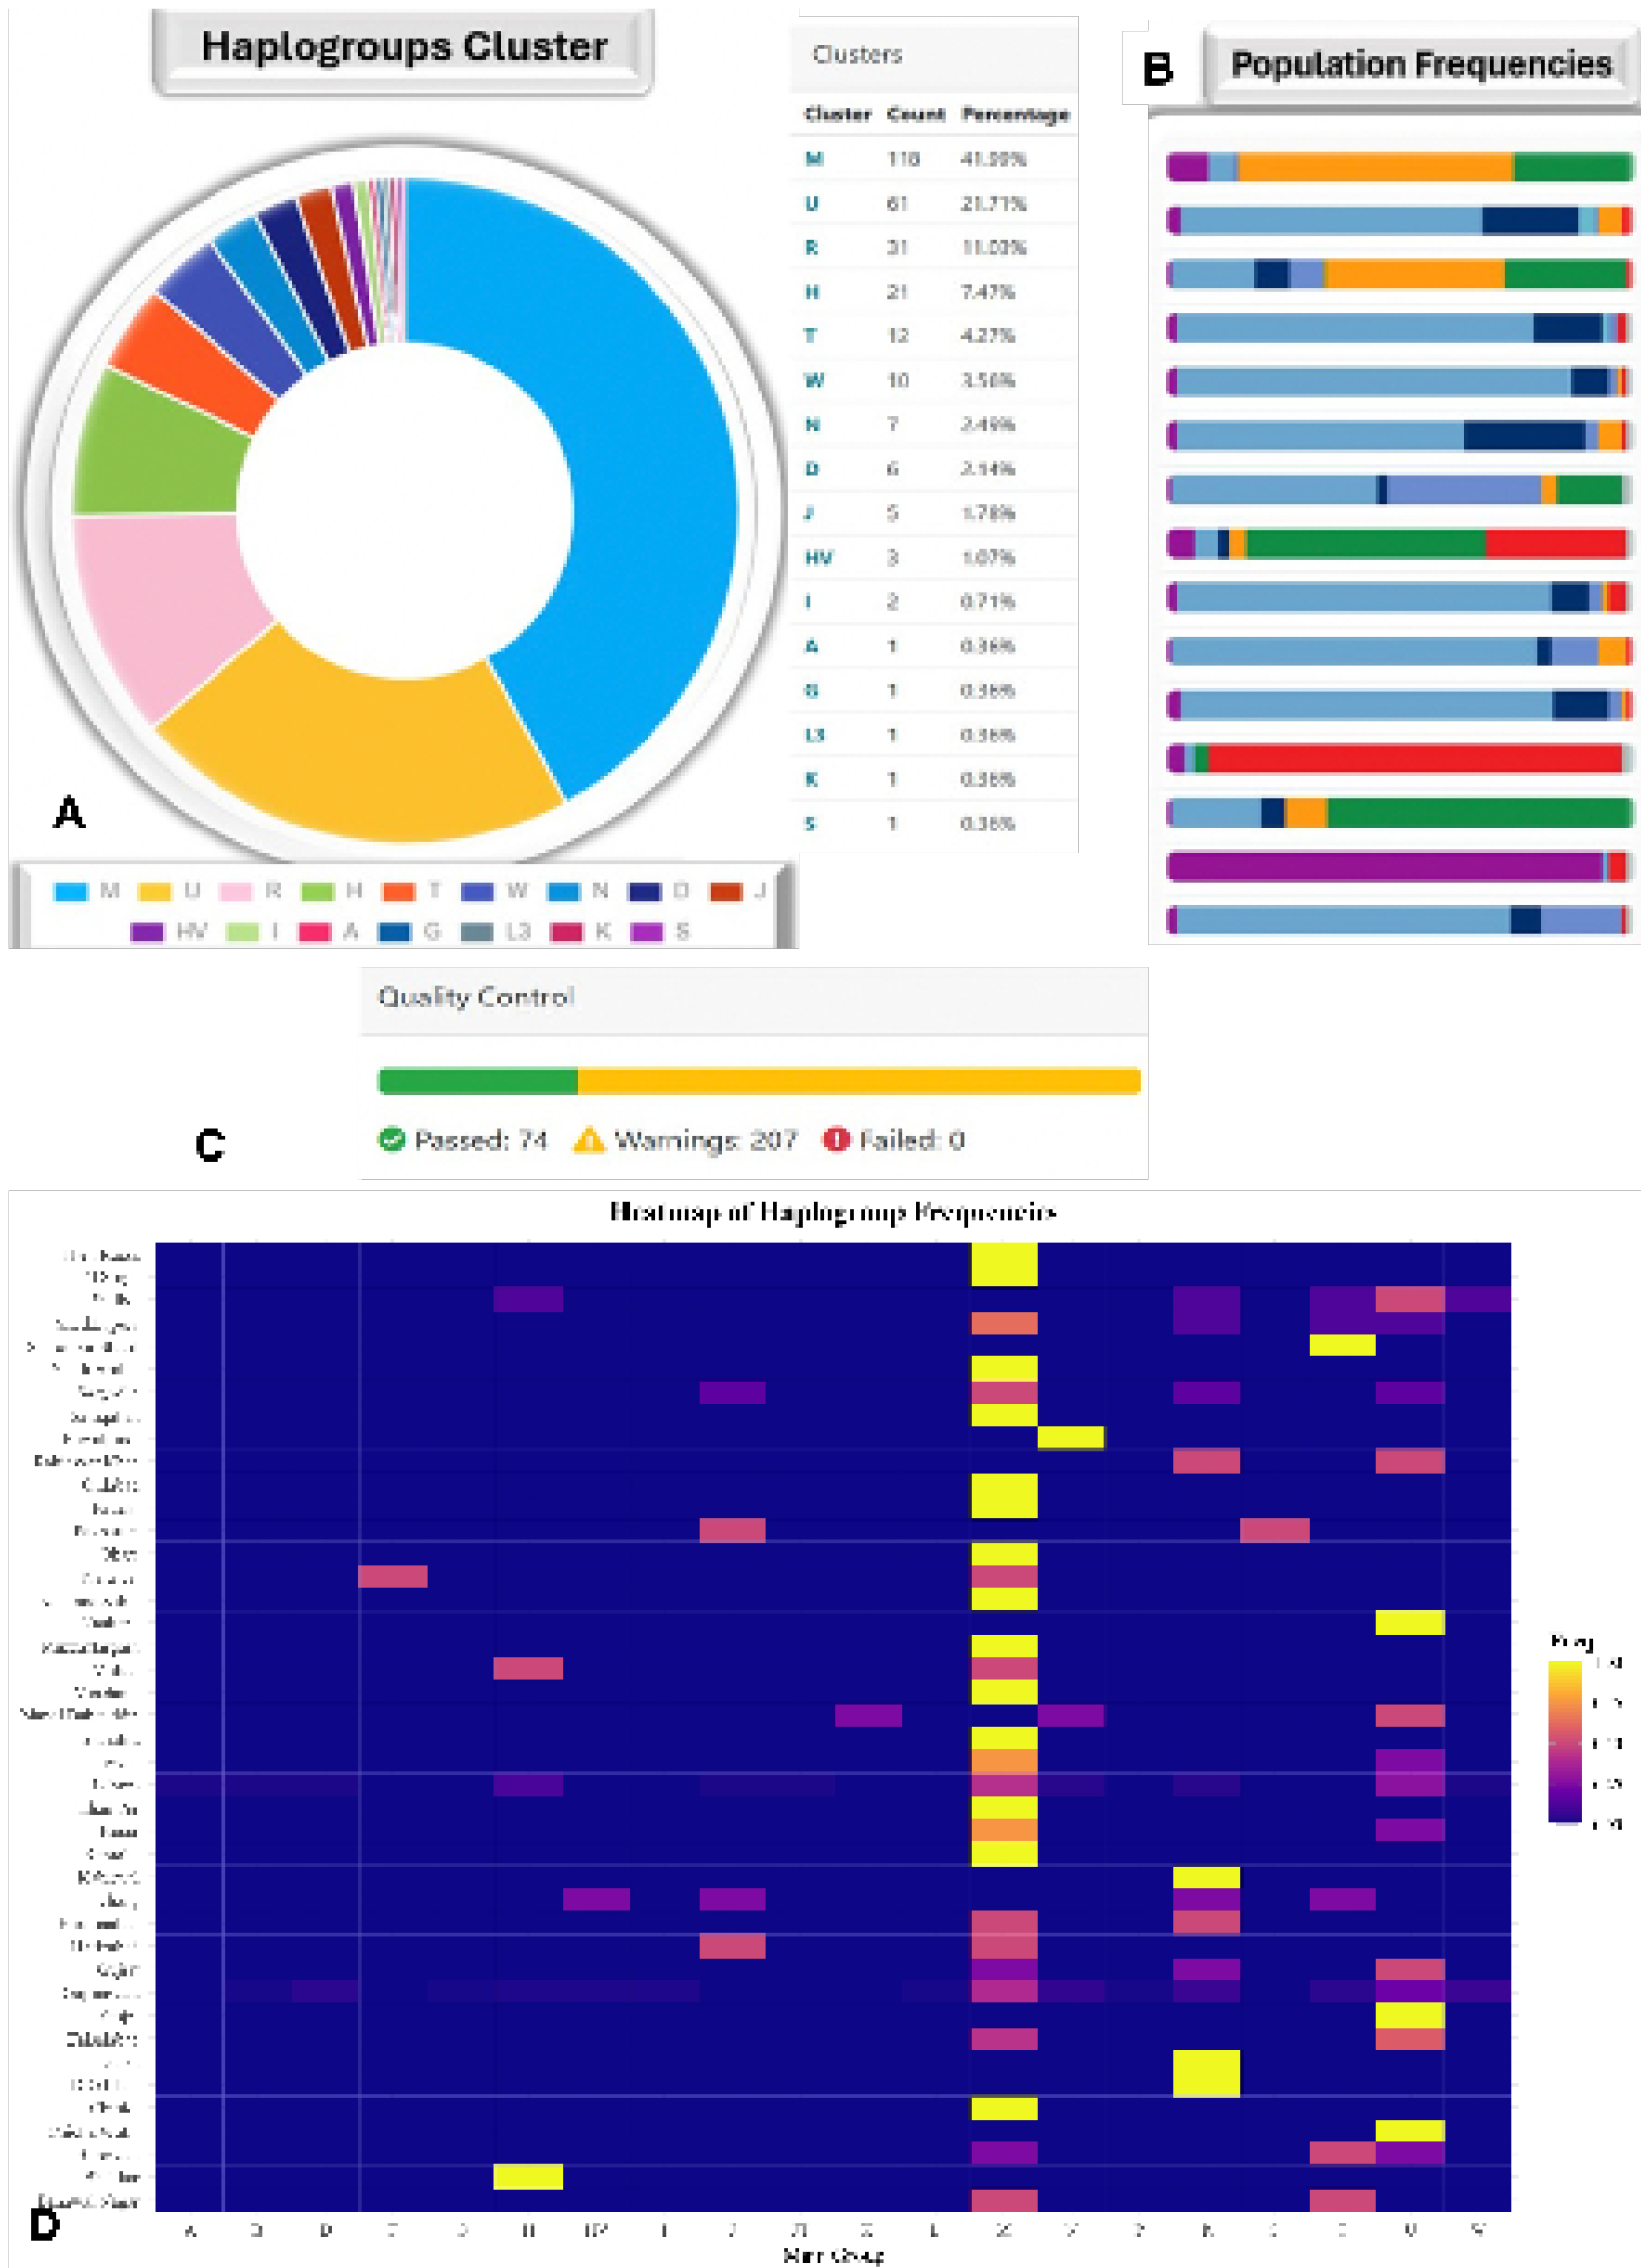
Haplogroup composition of Rajput mtDNA (HaploGrep 3 v3.2.1). (A) Donut plot of haplogroup frequencies (M= 41.99%, U = 21.71%, R = 11.03% most common). (B) Cluster counts with population frequency comparisons to global references. (C) QC summary (74 passed, 207 warnings, 0 failed). (D) Heatmap of mtDNA haplogroup frequencies among Rajput populations across Punjab districts. Rows represent districts and columns represent macro-haplogroups. Color intensity reflects the relative frequency of each haplogroup (yellow= high, purple= low).
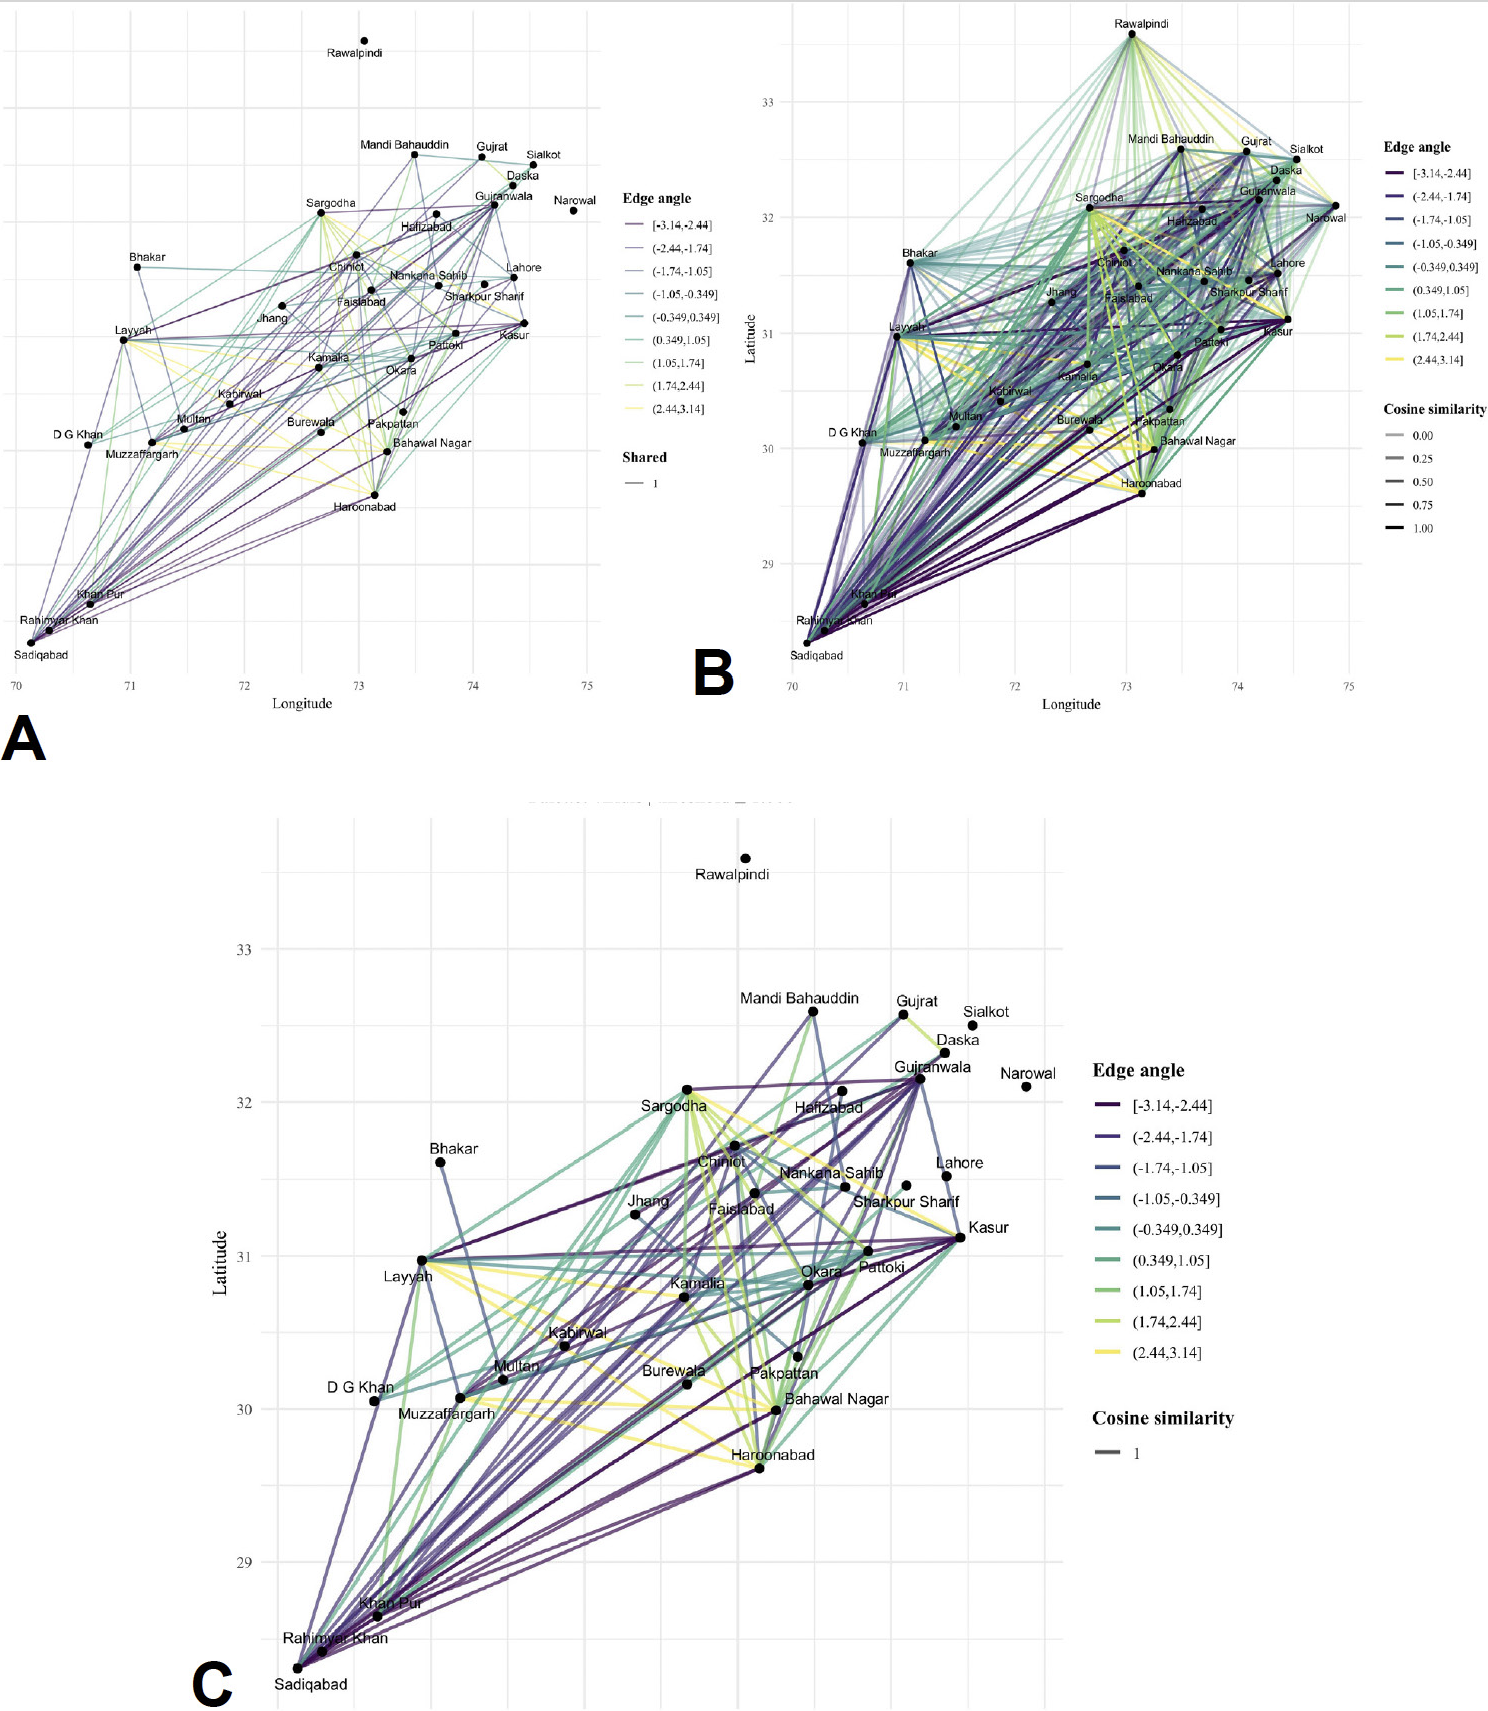
Spatial networks of mitochondrial haplotype sharing among Rajput population sampling locations. (A) All identical haplotypes complete sharing network ( ≥ Main group shared) (edges > median). (B) High-sharing links (top 50%). (C) Very-high-sharing links (top 15%). Nodes represent sampling locations; edge thickness reflects the number of shared haplotypes; edge colors correspond to edge angle categories shown in the legend.
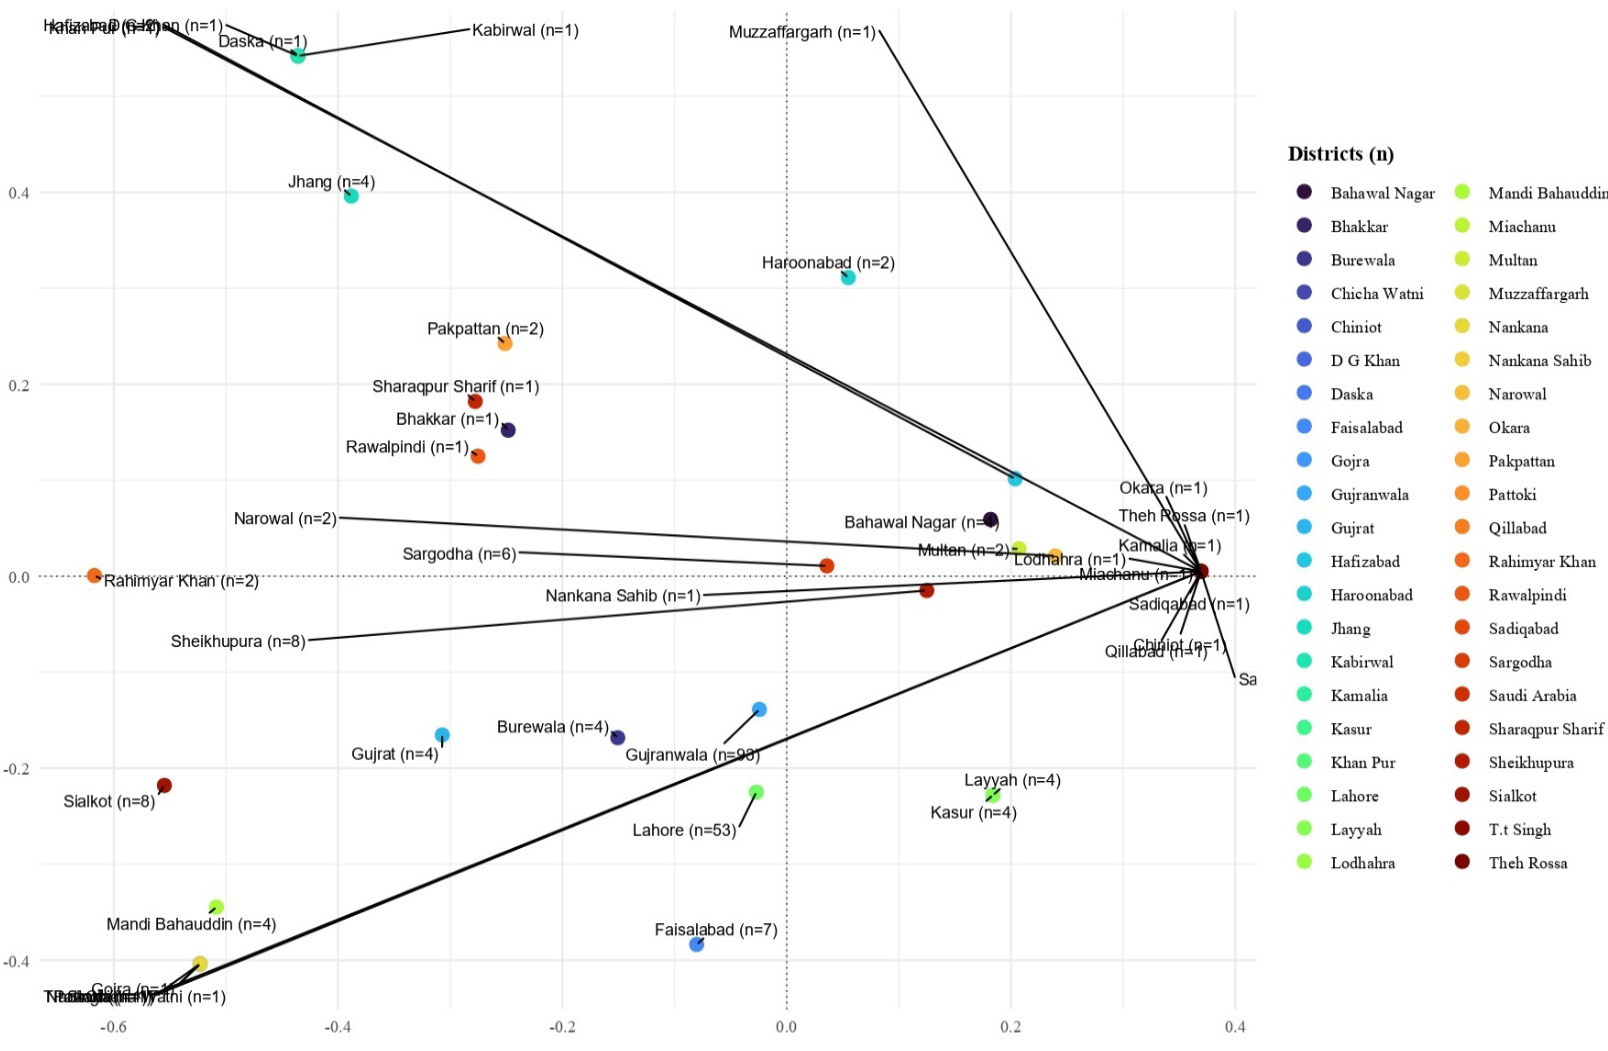
Principal coordinates analysis (PCoA) of mtDNA haplogroup frequency differentiation among Punjab districts.
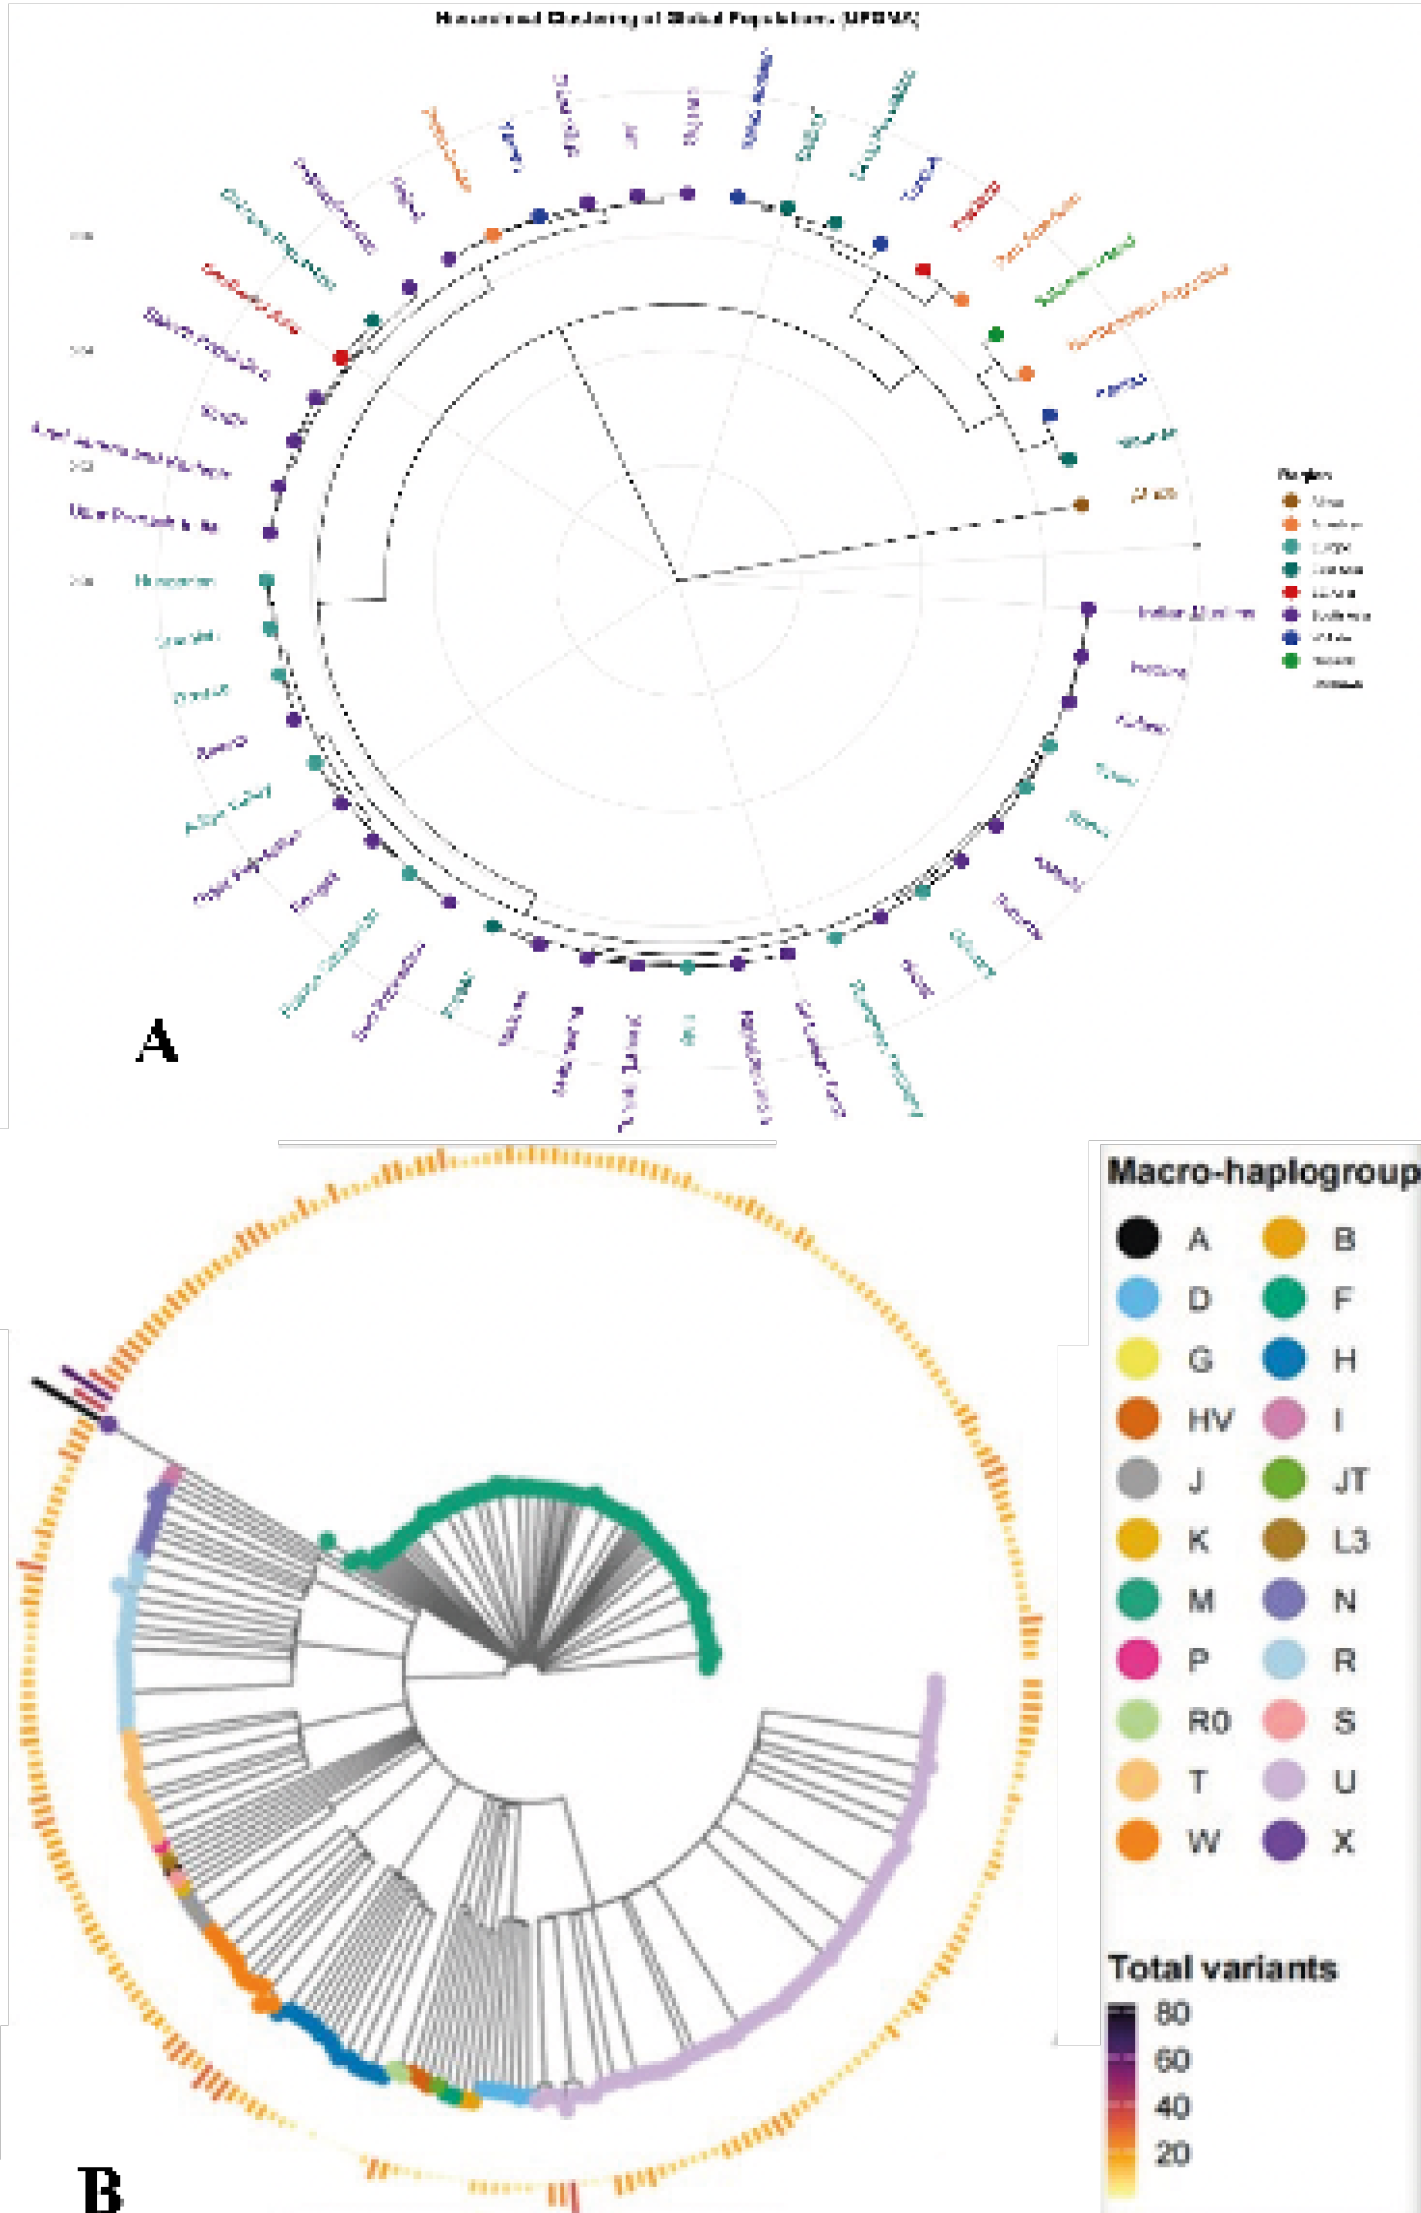
(A) A neighbor-joining (N/J) tree illustrating the genetic relationships among the Rajput, Kashmiri, Hazara, Makrani, Kalash, Rajpoot, Yemeni, Iraqi, Maharashtrian, Northern Asian, Kuwaiti, Vietnamese, Cham, Kinh, Finnish, Serbian, Afric Americ (Washington), Adige Valley, Fassa Valley, Korean, Tajik, Mongol, Chinese, Filipino, Egyptian, Solomon Islands, Greek, Indian Muslim, Chiang Mai (Thai), and Sindhi populations was constructed using the neighbor-joining tree method. (B) Rajput mtDNA haplogroups structure (NJ on Gower distance). Circular neighbor-joining tree illustrating clustering of individual haplotypes according to Gower genetic distance. Colored rings correspond to macro-haplogroups (legend at right). Outer bar intensity denotes total variant count per sequence, highlighting major lineage diversification across South Asian and West Eurasian maternal pools.
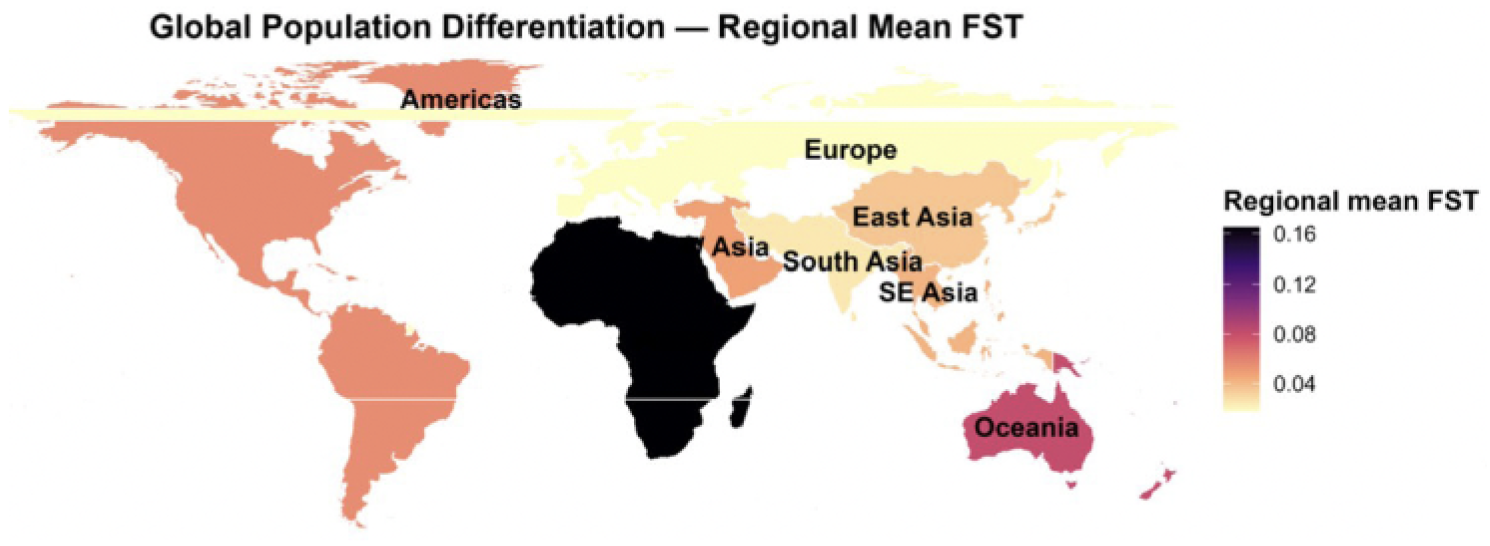
Global FST values between the Rajput population and populations from eight major geographic regions. Lower FST values (yellow) indicate greater genetic similarity, while higher values (orange to red) indicate greater differentiation. Insets (A–H) display regional maps for North America, Europe, Africa, East Asia, South America, South Asia, Southern Arabia, and Melanesia, respectively.
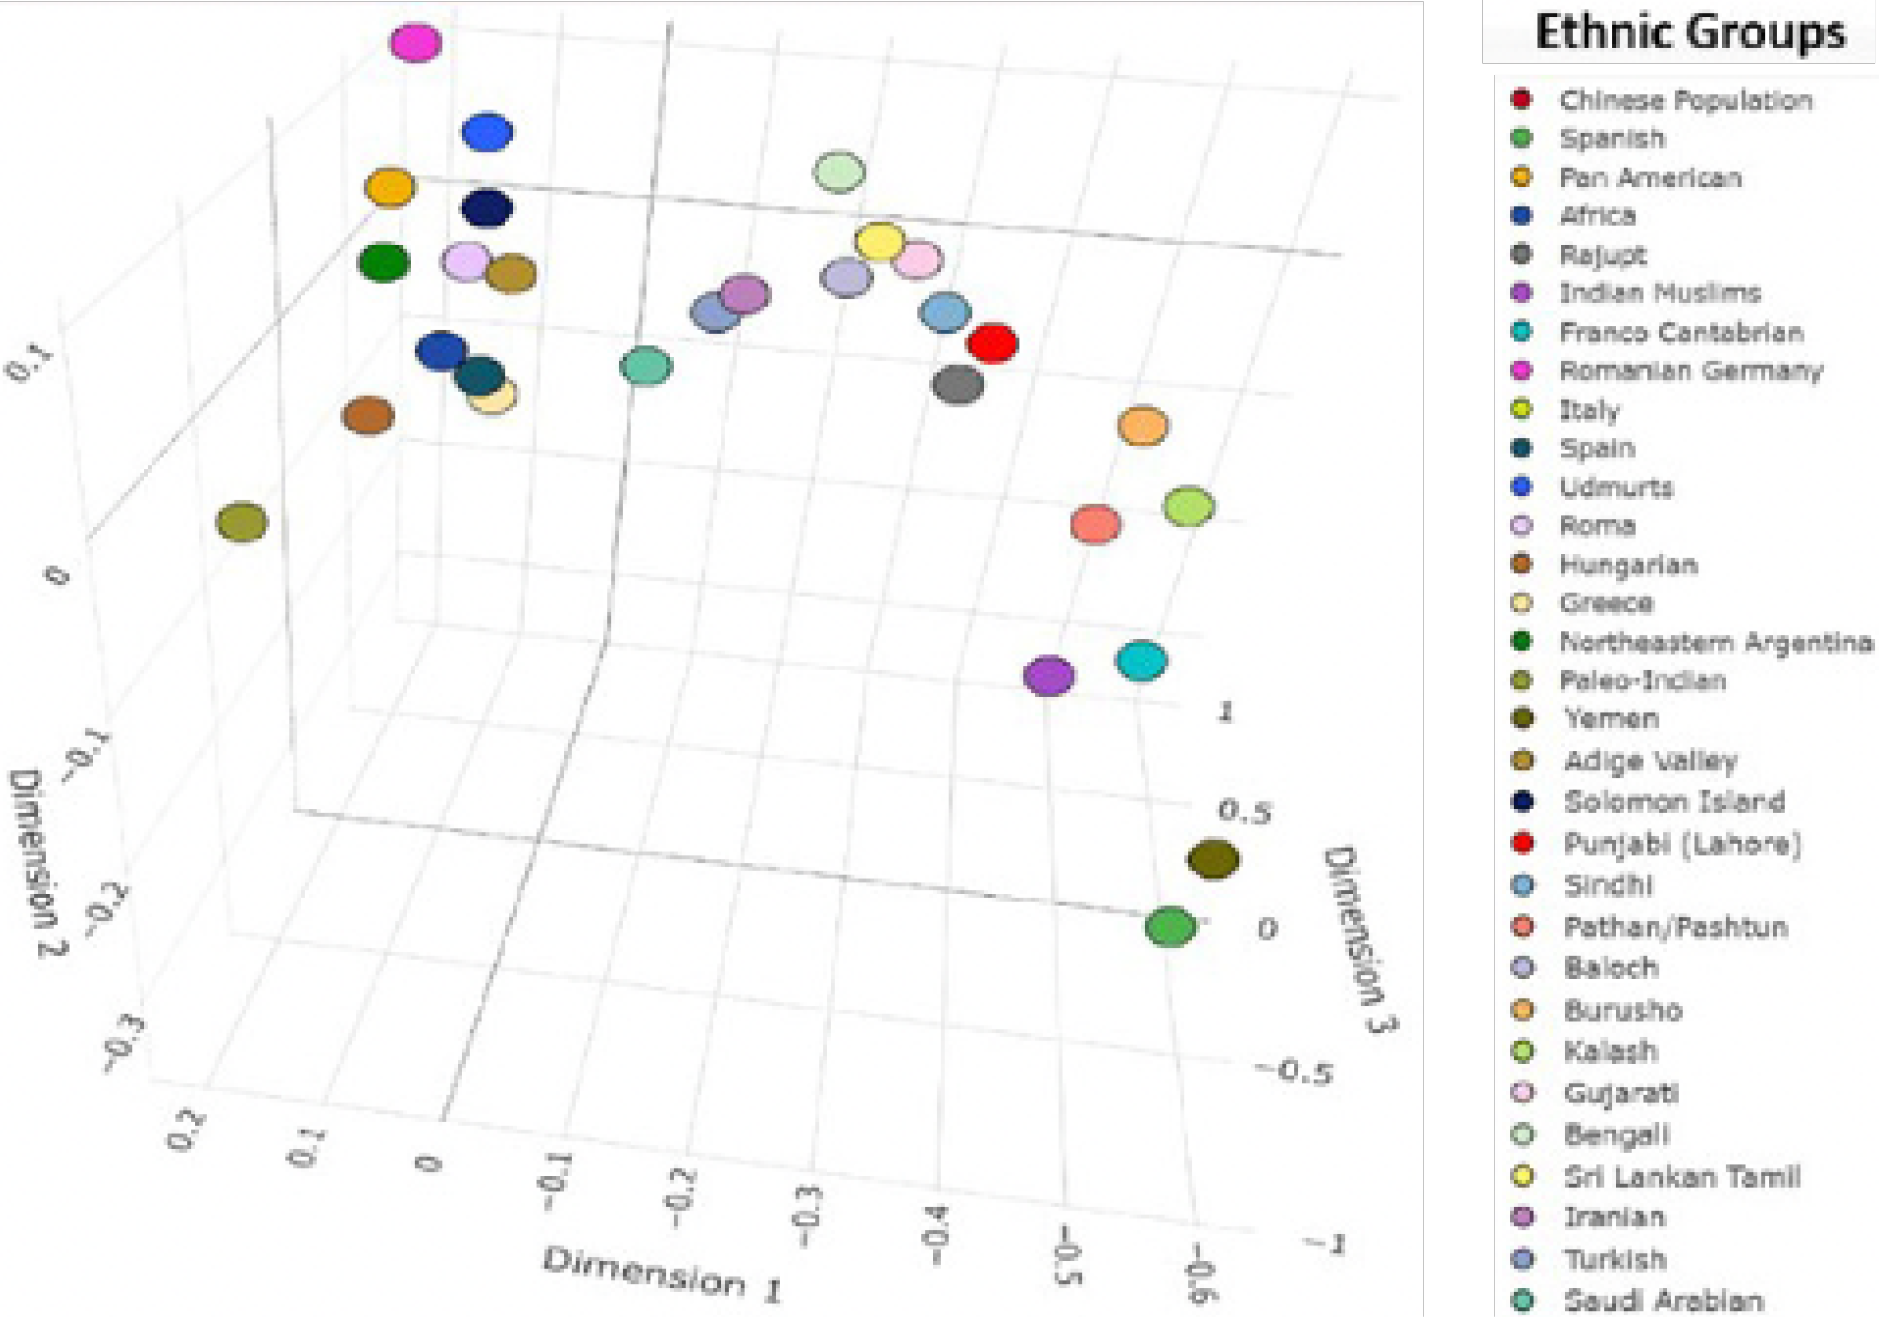
Multidimensional based on Fst genetic distance of mitochondrial control region sequence of Rajput population and other ethnic groups around the globe. Hence, FST plot or multidimensional scaling (MDS) is derived from FST or fixation index which accurately depict the level of genetic differentiation of populations. It can be used in showing relation and similarity of the different populations by using different colored markers. The points identified are much more unique for each population and the location of the points is much more determined by genotypic relationships or co-differences.
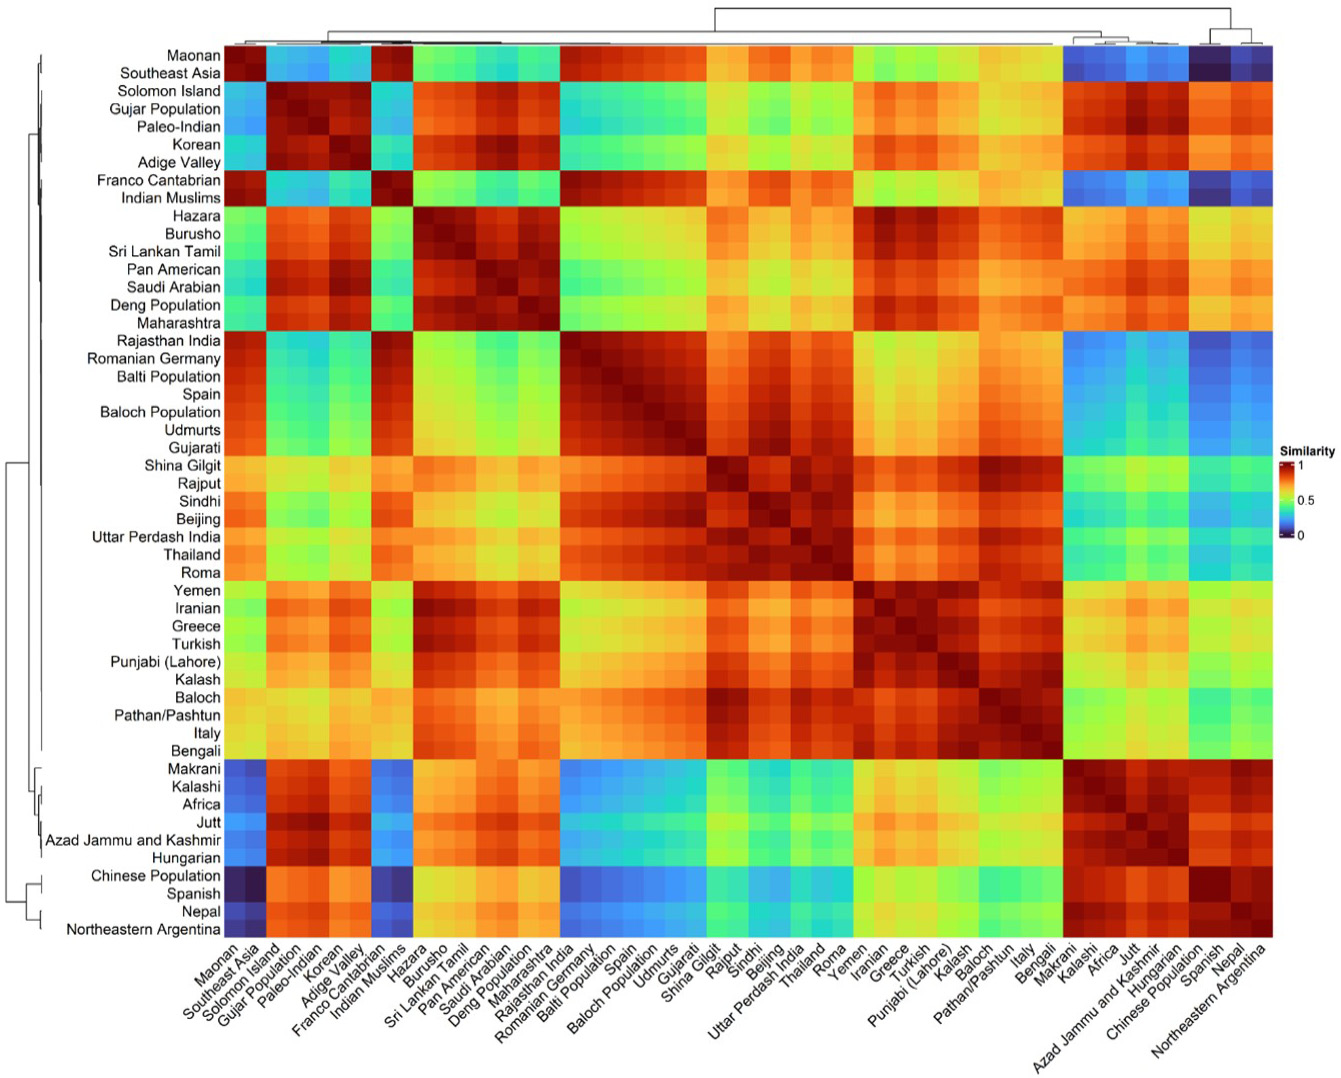
Genetic similarity heatmap shows visualization of the genetic relationships between the rajput population and global populations using FST values. The cooler colors (blue/green) indicating higher genetic similarity and warmer colors (orange/red) indicating greater genetic differentiation.
References
- Ahmad, F., Afzal, M. and Shahzad, M.S., 2023. Genetic characterization of mitochondrial DNA control region of Arain ethnic group in Pakistan. J. Popul. Ther. Clin. Pharmacol., 30: 1577–1591. https://doi.org/10.53555/jptcp.v30i18.3311[CrossRef]
- Akbari, M., Nilsen, H.L. and Montaldo, N.P., 2022. Dynamic features of human mitochondrial DNA maintenance and transcription. Front. Cell Dev. Biol., 10: 984245. https://doi.org/10.3389/fcell.2022.984245[CrossRef]
- Anderson, S., Bankier, A.T., Barrell, B.G., de Bruijn, M.H.L., Coulson, A.R., Drouin, J., Eperon, I.C., Nierlich, D.P., Roe, B.A., Sanger, F., Schreier, P.H., Smith, A.J.H., Staden R. and Young I.G., 1981. Sequence and organization of the human mitochondrial genome. Nature, 290: 457–465. https://doi.org/10.1038/290457a0[CrossRef]
- Andrews, R.M., Kubacka, I., Chinnery, P.F., Lightowlers, R.N., Turnbull, D.M. and Howell, N., 1999. Reanalysis and revision of the Cambridge reference sequence for human mitochondrial DNA. Nat. Genet., 23: 147. https://doi.org/10.1038/13779[CrossRef]
- Ansari, A.I., Khan, O.Y. and Ansari, M.A., 2018. Genetic diversity in mitochondrial DNA control region among sub-ethnic groups of Punjabi population from Pakistan. Int. J. Biol. Biotechnol., 15: 453–458.
- Bhatti, S., Abbas, S., Aslamkhan, M., Attimonelli, M., Trinidad, M.S., Aydin, H.H., de Souza, E.M.S. and Gonzalez, G.R., 2018. Genetic perspective of uniparental mitochondrial DNA landscape on the Punjabi population, Pakistan. Mitochond. DNA A, 29: 714–726. https://doi.org/10.1080/24701394.2017.1350951[CrossRef]
- Bhatti, S., Aslamkhan, M., Attimonelli, M., Abbas, S. and Aydin, H.H., 2017. Mitochondrial DNA variation in the Sindh population of Pakistan. Aust. J. Foren. Sci., 49: 201–216. https://doi.org/10.1080/00450618.2016.1144788[CrossRef]
- Bodner, M., Amory, C., Olivieri, A., Gandini, F., Cardinali, I., Lancioni, H., Huber, G., Xavier, C., Pala, M., Fichera, A. and Schnaller, L., 2022. Helena’s many daughters: More mitogenome diversity behind the most common West Eurasian mtDNA control region haplotype in an extended Italian population sample. Int. J. mol. Sci., 23: 6725. https://doi.org/10.3390/ijms23126725[CrossRef]
- Chaitanya, L., an Oven, M., Brauer, S., Zimmermann, B., Huber, G., Xavier, C., Parson, W., de Knijff, P. and Kayser, M., 2016. High-quality mtDNA control region sequences from 680 individuals sampled across the Netherlands to establish a national forensic mtDNA reference database. Foren. Sci. Int. Genet., 21: 158–167. https://doi.org/10.1016/j.fsigen.2015.12.002[CrossRef]
- Excoffier, L. and Lischer, H.E.L., 2010. Arlequin suite ver 3.5: A new series of programs to perform population genetics analyses under Linux and Windows. Mol. Ecol. Resour., 10: 564–567. https://doi.org/10.1111/j.1755-0998.2010.02847.x[CrossRef]
- Kearse, M., Moir, R., Wilson, A., Stones-Havas, S., Cheung, M., Sturrock, S., Buxton, S., Cooper, A., Markowitz, S., Duran, C. and Thierer, T., 2012. Geneious basic: An integrated and extendable desktop software platform for the organization and analysis of sequence data. Bioinformatics, 28(12): 1647–1649. https://doi.org/10.1093/bioinformatics/bts199[CrossRef]
- Kumar, S., Stecher, G., Li, M., Knyaz, C. and Tamura, K., 2018. MEGA X: molecular evolutionary genetics analysis across computing platforms. Mol. Biol. Evol., 35: 1547–1549. https://doi.org/10.1093/molbev/msy096[CrossRef]
- Lee, M.T., Mouri, A., Kubota, H., Lee, H.J., Chang, M.H., Wu, C.Y., Knutson, D.E., Mihovilovic, M., Cook, J., Sieghart, W. and Nabeshima, T., 2022. Targeting α6 GABAA receptors as a novel therapy for schizophrenia: A proof-of-concept preclinical study using various animal models. Biomed. Pharmacother., 150: 113022. https://doi.org/10.1016/j.biopha.2022.113022[CrossRef]
- Mabuchi, T., Susukida, R., Kido, A. and Oya, M., 2007. Typing the 1.1 kb control region of human mitochondrial DNA in Japanese individuals. J. Foren. Sci., 52: 355–363. https://doi.org/10.1111/j.1556-4029.2006.00366.x[CrossRef]
- Mahmood, S., 2020. (Re) imagining Rajputhood and scheduled-caste identity along the Tharparkar-Rajasthan borderland in Sindh, Pakistan. Pak. J. Hist. Cult., 41: 252–270.
- Merriwether, D.A., Hodgson, J.A., Friedlaender, F.R., Allaby, R., Cerchio, S., Koki, G. and Friedlaender, J.S., 2005. Ancient mitochondrial M haplogroups identified in the Southwest Pacific. Proc. natl. Acad. Sci. USA, 102: 13034–13039. https://doi.org/10.1073/pnas.0506195102[CrossRef]
- Metspalu, M., Kivisild, T., Metspalu, E., Parik, J., Hudjashov, G., Kaldma, K., Serk, P., Karmin, M., Behar, D.M., Gilbert, M.T.P. and Endicott, P., 2004. Most of the extant mtDNA boundaries in South and Southwest Asia were likely shaped during the initial settlement of Eurasia by anatomically modern humans. BMC Genet., 5: 26. https://doi.org/10.1186/1471-2156-5-26[CrossRef]
- Nakamura, T., Zhao, H., Yamagata, Y., Okabe, K., Hirayama, S., Chirifu, M., Ikemizu, S., Morioka, H., Nakabeppu, Y. and Yamagata, Y., 2021. Structure of the mammalian adenine DNA glycosylase MUTYH: insights into the base excision repair pathway and cancer. Nucl. Acids Res., 49: 7154–7163. https://doi.org/10.1093/nar/gkab492[CrossRef]
- Previderè, C., Grignani, P., Alessandrini, F., Biondo, R., Boschi, I., Caenazzo, L., Carboni, I., Carnevali, E., De Stefano, F., Domenici, R., Fabbri, M. and Giardina, E., 2013. The 2011 GeFI collaborative exercise: concordance study, proficiency testing and Italian population data on the new ENFSI/EDNAP loci D1S1656, D2S441, D10S1248, D12S391, D22S1045. Foren. Sci. Int. Genet., 7: e15–e18. https://doi.org/10.1016/j.fsigen.2012.08.001[CrossRef]
- Pugach, I., Delfin, F., Gunnarsdóttir, E., Kayser, M. and Stoneking, M., 2013. Genome-wide data substantiate Holocene gene flow from India to Australia. Proc. natl. Acad. Sci. USA, 110: 1803–1808. https://doi.org/10.1073/pnas.1211927110[CrossRef]
- Quintana-Murci, L., Chaix, R., Wells, R.S., Behar, D.M., Sayar, H., Scozzari, R., Rengo, C., Al-Zahery, N., Semino, O., Santachiara-Benerecetti, A.S. and Coppa, A., 2004. Where west meets east: the complex mtDNA landscape of the southwest and central Asian corridor. Am. J. Hum. Genet., 74: 827–845. https://doi.org/10.1086/383236[CrossRef]
- Rakha, A., Shin, K.J., Yoon, J.A., Kim, N.Y., Siddique, M.H., Yang, I.S., Yang, W.I. and Lee, H.Y., 2011. Forensic and genetic characterization of mtDNA from Pathans of Pakistan. Int. J. Legal Med., 125: 841–848. https://doi.org/10.1007/s00414-010-0540-7[CrossRef]
- Rozas, J., Ferrer-Mata, A., Sánchez-DelBarrio, J.C., Guirao-Rico, S., Librado, P., Ramos-Onsins, S.E. and Sánchez-Gracia, A., 2017. DnaSP 6: DNA sequence polymorphism analysis of large data sets. Mol. Biol. Evol., 34: 3299–3302. https://doi.org/10.1093/molbev/msx248[CrossRef]
- Sharma, S. and Verma, K., 2023. Haplotype diversity of mitochondrial DNA in the Jat population of Haryana. J. Forens. Sci. Med., 9: 320–330. https://doi.org/10.4103/jfsm.jfsm_4_22[CrossRef]
- Shehzadi, A., 2021. Haplotype diversity of 17 Y-chromosomal STRs in Jat population of Pakistan. Pakistan J. Zool. (Preprint). https://doi.org/10.17582/journal.pjz/20210805110806[Full text][CrossRef]
- Siddiqi, M.H., Rakha, A., Khaliq, S., Akhtar, T., Rakha, A., Abbas, G., Ali, A., Haider, N., Ali, A., Hayat, S., Masooma, S., Ahmad, J. and Tariq, M.A., 2015. Genetic characterization of the Makrani people of Pakistan from mitochondrial DNA control-region data. Leg. Med., 17: 134–139. https://doi.org/10.1016/j.legalmed.2014.09.007[CrossRef]
- Singh, M., Sarkar, A., Kumar, D. and Nandineni, M.R., 2020. The genetic affinities of Gujjar and Ladakhi populations of India. Sci. Rep., 10: 2055. https://doi.org/10.1038/s41598-020-59061-9[CrossRef]
- Tariq, M., Ahmad, H., Hemphill, B.E., Farooq, U. and Schurr, T.G., 2022. Contrasting maternal and paternal genetic histories among five ethnic groups from Khyber Pakhtunkhwa, Pakistan. Sci. Rep., 12: 1027. https://doi.org/10.1038/s41598-022-05076-3[CrossRef]
- van Oven, M. and Kayser, M., 2009. Updated comprehensive phylogenetic tree of global human mitochondrial DNA variation. Hum. Mutat., 30: E386–E394. https://doi.org/10.1002/humu.20921[CrossRef]
- Xu, Y., Mortensen, O.V. and Mathiasen, J.R., 2020. Functional studies of a dopamine transporter allosteric modulator and its effect on cocaine-induced behavior. M.Sc. thesis, Drexel Univ., USA.
Supplementary material
Services
Article usage statistics
Loading…