Research Article · Volume 14, Issue 4, 30 September 2026 · Open Access
Phylogenetic Study of Bligon Goats from Kulon Progo Regency Based on Mitochondrial DNA (mtDNA) Displacement Loop (D-Loop) Region Sequence
· · · · · · · ·
Affiliations & Notes ⌄
1Department of Biochemistry, Faculty of Veterinary Medicine, Universitas Gadjah Mada, Yogyakarta, Indonesia 55281
2Undergraduate Student of Veterinary Medicine, Faculty of Veterinary Medicine, Universitas Gadjah Mada, Yogyakarta, Indonesia 55281
3Research Center for Applied Zoology, National Research and Innovation Agency (BRIN), Bogor, Indonesia, 16911
4Kulon Progo Agriculture and Food Office, Yogyakarta, Indonesia 55652. *Correspondence | Krisna Noli Andrian, Department of Biochemistry, Faculty of Veterinary Medicine, Universitas Gadjah Mada, Yogyakarta, Indonesia 55281
A comprehensive analysis of mitochondrial D-loop and HV1 sequences reveals that Bligon goats exhibit strong maternal lineage conservation while retaining detectable genetic variation at finer scales.
All Bligon goats consistently belong to haplogroup B, confirming shared evolutionary origins with other Indonesian local goat breeds.
This finding indicates that, maternally, Bligon goats do not represent a distinct lineage but are part of the broader Indonesian local goat genetic pool, suggesting a pattern of genetic continuity rather than divergence.
The combined use of conserved and hypervariable mitochondrial regions provides a scientifically robust framework for genetic characterization, conservation planning, and sustainable management of indigenous goat genetic resources in Indonesia.
Selected from the article's own text.
Abstract
Bligon goats are a significant indigenous genetic resource in Indonesia; however, updated information on their maternal genetic structure remains limited. Mitochondrial DNA (mtDNA) analysis of the Displacement Loop (D-loop), particularly the hypervariable region 1 (HV1), is widely used to investigate genetic diversity, maternal lineage, and phylogenetic relationships in livestock. This study aimed to analyze mitochondrial DNA diversity, genetic distance, and phylogenetic relationships of Bligon goats from Kulon Progo Regency, Yogyakarta. Blood samples from 15 adult female Bligon goats were collected for genetic analysis. The mtDNA D-loop (734 bp) and HV1 (481 bp) regions were amplified by PCR, and nine representative samples were sequenced. Sequence alignment, polymorphism analysis, genetic distance estimation (K2P), and phylogenetic reconstruction (NJ, 1,000 bootstrap) were performed using MEGA. Genetic diversity indices, including haplotype diversity (Hd) and nucleotide diversity (π), were calculated using DnaSP. PCR amplification produced clear amplicons for both regions. The D-loop showed high conservation, whereas the HV1 segment exhibited 7 polymorphic sites (4 singleton and 3 parsimony-informative), all transitions. Genetic distances were low for the D-loop (0.000–0.006) but higher for HV1 (0.0000–0.0595). Bligon goats were closely related to Indonesian local breeds and more divergent from Boer and wild goats (Capra ibex). Phylogenetic analysis assigned all samples to haplogroup B. Bligon goats exhibit conserved maternal lineages and belong to haplogroup B, supporting shared ancestry with Indonesian local goat breeds and providing valuable data for genetic conservation efforts.
Livestock are a crucial commodity in Indonesia’s agricultural sector, particularly serving as a source of protein, income, and subsistence for local communities. Indonesia possesses rich genetic resources of local goat breeds, characterized by high diversity and wide distribution. ; . The local goat breeds commonly found in Indonesia include the Kacang, Gembrong, Peranakan Etawa (PE), and Jawarandu goats. The Bligon (also known as Jawarandu) goat is a prominent local crossbreed extensively raised by smallholder farmers in Central Java and Yogyakarta. This breed originated from deliberate crossbreeding between Kacang does and Peranakan Etawa (PE) bucks, aiming to combine the superior production traits of the Etawa lineage, such as larger body size and higher milk yield, with the adaptability and low-input management of the Kacang goat. Notably, the Bligon goat demonstrates superior reproductive performance compared to the Peranakan Etawa .
Kulon Progo is recognized as one of the main centers of goat production in Yogyakarta, with a reported population of 130,782 goats in 2026 . In this region, PE and Bligon goats are widely maintained due to their high economic value and production performance. However, breeding practices have been largely farmer-driven, characterized by frequent crossbreeding and limited livestock recording. In recent years, the introduction of exotic breeds, particularly Boer goats, to improve growth and meat production has increased the risk of genetic admixture within the local population . This condition may accelerate the dilution of the original maternal lineages of Bligon goats. Therefore, maternal lineage identification is essential to assess genetic origins and to support sustainable breeding and conservation strategies for local goat resources.
Understanding goat lineage can be traced through phylogenetic analyses of mitochondrial DNA . Mitochondrial DNA (mtDNA) analysis is a widely used method for identifying lineage information in domesticated animals. This analysis enables the tracing of an individual’s maternal lineage. It involves examining the frequency of polymorphic markers identified from population samples and comparing them with available databases. Genetic studies of mitochondrial DNA commonly utilize the Displacement Loop (D-loop) sequence. The D-loop is a non-coding control region of mtDNA characterized by a relatively high nucleotide mutation rate compared to the other areas. This feature makes the D-loop suitable for studying genetic variability and phylogenetic relationships among populations, as it can reveal mutations arising during the evolutionary process. Furthermore, the D-loop region provides sufficient genetic information for constructing phylogenetic trees. The D-loop region sequence also exhibits high variability, which is associated with the geographic distribution of populations .
Genomic studies based on mitochondrial DNA Displacement Loop (D-loop) gene sequences have been widely conducted to trace the phylogeny and haplogroups of various populations. Previous research on the genetic characterization of Indonesian local goats using the D-loop region revealed a close genetic relationship among the native Indonesian goat breeds, indicating a shared maternal lineage and limited genetic divergence within the population . The D-loop region also contains the most polymorphic segments of mtDNA, known as hypervariable segment 1 (HV1) and hypervariable segment 2 (HV2), which serve as mutation hotspots. The HV1 region, in particular, contains the highest density of sequence variation in goats, making it notably informative for resolving maternal lineages and identifying haplogroups . Compared with the remainder of the control region, the HV1 segment has a markedly higher mutation density per base. For instance, a study on the Indonesian Gembrong goat identified 338 polymorphic sites within a 558-bp HV1 fragment (~61% of sites), highlighting its high mutation density relative to the broader control region . Given that HV1 captures a substantial proportion of the polymorphic variation across the entire D-loop while requiring shorter sequence lengths, it provides an efficient and cost-effective marker for phylogenetic analysis.
Differences in sample origins and the considerable time gap since the previous research may have led to genetic changes in the Bligon goat population, thereby necessitating a reassessment to obtain more up-to-date and relevant information. This study aims to investigate the phylogenetic information of Bligon goats from Kulon Progo Regency, Yogyakarta Province, based on mitochondrial DNA D-loop region sequences.
MATERIALS AND METHODS
Sample collection
The study used 15 blood samples collected from three different farms in Balong Kulon Hamlet, Banjarsari Village, Samigaluh District, Kulon Progo Regency, Special Region of Yogyakarta Province, with 5 samples obtained from each farm. To improve the representation of genetic diversity and minimize the likelihood of sampling closely related individuals, goats were selected based on farmer information and observable differences, ensuring that sampled goats were not from the same immediate family line within each herd. A total of 3 mL of blood was collected from the jugular vein of adult female Bligon goats and stored in EDTA tubes to prevent coagulation.
DNA isolation
DNA extraction was performed using the Geneaid gSYNC DNA Extraction Kit Quick Protocol (Geneaid Biotech, Taiwan). The isolation procedure consisted of several steps, including cell lysis, DNA binding, washing, and elution, to ensure the extraction of high-quality DNA.
Polymerase chain reaction (PCR)
PCR amplification was performed on the extracted DNA targeting the mitochondrial DNA D-loop hypervariable-1 (HV1) region using specific primers. The HV1 region was amplified using a forward primer 5′-CAGTCGAACATCCCTACATTATTATTGG-3′) and a reverse primer (5′-TTAGTCTTATTGATTTGGAGGGCGTTA-3′). The HV1 region was selected for its high polymorphism density and mutation rate, making it particularly suitable for assessing genetic variation, maternal lineage, and phylogenetic relationships among closely related goat populations, compared to more conserved regions of the mitochondrial genome. In addition, amplification of the broader D-loop region was carried out using the AHDL primer set, consisting of the forward primer AHDL-F (5′-CGCCAACACCACACAATATT-3′) and the reverse primer AHDL-R (5′-ATAGCTGAGTCCAAGCATCC-3′), producing a PCR product of approximately 734 bp. PCR was carried out in a 50 μL reaction mixture consisting of 25 μL of 2x MyTaq HS Red Mix (Meridian Bioscience, USA), 15 μL of nuclease-free water, six μL of DNA template, and two μL of each specific primer. Amplification was conducted using a Cleaver GTC96S thermal cycler (Cleaver Scientific Ltd., UK).
The thermal cycling protocol involved an initial denaturation at 94°C for 5 minutes, followed by 35 cycles of denaturation at 94°C for 30 seconds, primer annealing at 53°C (D-Loop) and 50°C (HV1) for 40 seconds, and extension at 72°C for 1 minute. A final extension step at 72°C for 10 minutes was included to ensure complete elongation of the PCR products.
Agarose gel electrophoresis and sequencing
PCR products were evaluated with electrophoresis on a 1% agarose gel to verify successful amplification. Electrophoretic separation was performed at 100V for 40 minutes, and the DNA bands were visualized under ultraviolet illumination using a UV transilluminator. The confirmed amplicons from nine representative samples were subsequently subjected to Sanger sequencing at the Integrated Research and Testing Laboratory (LPPT), Universitas Gadjah Mada.
Data analysis
Sequence data analysis was conducted using MEGA software. The nucleotide sequences obtained from DNA sequencing were aligned using the Clustal W algorithm with default parameters. Multiple sequence alignment (MSA) results were used to identify polymorphic sites among the samples. The Bligon goat sequences were primarily compared with the Samosir goat sequence (MF048904) as a local reference, along with other goat sequences retrieved from the National Center for Biotechnology Information (NCBI) GenBank database, including Boer goat (MH760795.1), Laos goat (AB044298.1), and wild goat (AB004076.1).
Genetic diversity, including haplotype diversity (Hd) and nucleotide diversity (π), was calculated in DnaSP from aligned nucleotide sequences. Genetic distance analysis was performed by calculating pairwise distances using the Kimura Two-Parameter (K2P) model. Genetic distances were computed by comparing the Bligon goat samples with several reference sequences, including Samosir goat (MF048904.1), Ibex (NC020623), Capra hircus complete genome (NC_005044.2), Capra hircus Marica (LC571963.1), Capra hircus Kacang (LC571973.1), and Capra hircus Boer (MH760795.1). In addition, nucleotide base composition was analyzed using the Compute Nucleotide Composition model in MEGA.
Phylogenetic relationships among the Bligon goat samples were inferred by constructing a Neighbor-Joining (NJ) phylogenetic tree based on the Kimura Two-Parameter model with 1,000 bootstrap replications to assess node reliability. The phylogenetic analysis incorporated 27 goat reference sequences obtained from the NCBI GenBank database, representing six mitochondrial haplogroups (A, B, C, D, F, and G).
A total of 16 representative goat reference sequences were included to define haplogroup structure: goats from Italy (EF618134), France (EF617779), and Jordan (EF618200) for haplogroup A; Samosir goat (MF048904), and goats from Azerbaijan (EF617706), Mongolia (AJ317833), and China (DQ121578) for haplogroup B; goats from China (DQ188892), Switzerland (AJ317838), and Spain (EF618413) for haplogroup C; goats from China (DQ188893) and Austria (EF617701) for haplogroup D; a goat from Sicily (DQ241349) for haplogroup F; and goats from Turkey (EF618535) and Egypt (EF617727) for haplogroup G.
RESULTS AND DISCUSSION
PCR amplification and sequence analysis
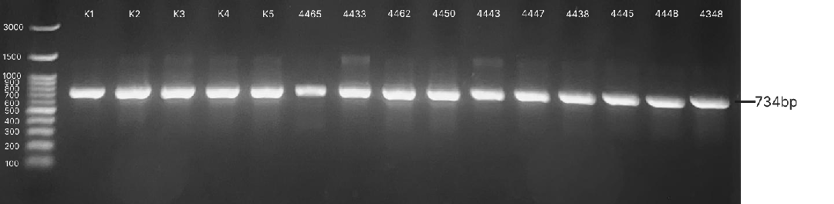
PCR amplification of mitochondrial DNA successfully targeted two analytical regions: The D-Loop region and the hypervariable-1 (HV1) segment within the D-Loop. Amplification of the D-Loop region yielded a single, distinct DNA fragment of approximately 734 bp for all Bligon goat samples. Visualization using 1% agarose gel electrophoresis revealed sharp, well-defined, and uniformly intense bands (Figure 1), indicating consistent amplification efficiency and comparable DNA quality across samples. The absence of non-specific amplification products, primer-dimer artifacts, or degradation smears demonstrates high primer specificity, optimal annealing conditions, and intact mitochondrial DNA templates. These findings confirm the technical reliability of the PCR protocol for downstream sequencing and comparative genetic analyses .
Amplification of the HV1 region produced DNA fragments of approximately 481 bp, consistent with the expected size of the HV1 segment. Although minor variation in band intensity was observed among samples, all amplicons were clearly detectable, confirming sufficient DNA concentration for sequencing. The successful amplification and sequencing of both the D-Loop and HV1 regions further demonstrate that mitochondrial DNA is a robust marker for assessing maternal lineage structure in Bligon goats .
High-quality Sanger sequencing chromatograms were obtained for all PCR products, characterized by clear peak resolution and minimal background noise. Following sequence trimming and alignment using the Clustal W algorithm in MEGA software , two datasets were generated: One representing the D-Loop region and the other representing the HV1 segment. The high quality of sequence data supports the reliability of the observed genetic patterns.
Analysis of the D-Loop region revealed a high degree of sequence conservation among Bligon goat samples, with most nucleotide positions remaining invariant. This conserved pattern reflects the functional constraints of the mitochondrial control region, which plays a critical role in regulating mtDNA replication and transcription ; ; . The strong conservation observed in this region also suggests that stable maternal lineages have been maintained through long-term breeding practices.
For the HV1 dataset, a consensus sequence length of 481 bp was retained for analysis, comprising only Indonesian local goat sequences. Sequence alignment identified 464 monomorphic sites, indicating substantial conservation even within this hypervariable segment. However, seven polymorphic sites were detected, consisting of four singleton mutations and three parsimony-informative sites (Table 1). Polymorphic sites in Bligon goats were distributed throughout the HV1 region at nucleotide positions 179, 191, 205, 265, 329, 332, and 354.
All detected substitutions were transition mutations (A↔G and C↔T), with no transversion mutations. This pattern is consistent with established mitochondrial evolutionary mechanisms, as transitions are generally less disruptive to DNA structure and therefore accumulate more readily over time . The presence of parsimony-informative sites further supports the usefulness of the HV1 region for phylogenetic reconstruction despite its relatively short sequence length. Among reference sequences, the Boer goat exhibited the highest number of polymorphic sites, whereas Bligon goats showed closer sequence similarity to Indonesian local goat breeds.
Table 1: Polymorphic site positions in Bligon goats based on HV1 gene sequences.
Sample
Sites
179
191
205
265
329
332
354
LC571963.1 Capra hircus Marica
C
T
A
G
T
C
T
LC571973.1 Capra hircus Kacang
.
.
.
.
.
.
.
MH760795.1 Capra hircus Boer
.
.
G
.
C
T
.
MF048904.1 Capra hircus Samosir
.
.
.
.
C
.
.
K2 HV1
.
.
G
.
.
.
.
K3 HV1
.
.
G
.
.
.
.
K5 HV1
.
.
G
.
.
.
.
4462 HV1
.
.
.
.
.
T
.
4448 HV1
.
.
.
A
C
.
C
4447 HV1
.
.
.
.
.
.
.
4438 HV1
.
C
G
.
.
.
.
4445 HV1
.
.
.
.
.
.
.
4348 HV1
T
.
.
.
.
.
.
Table 2: Genetic distances among samples based on the D-loop region.
No.
Sample
1
2
3
4
5
6
7
8
9
1
K2
2
K3
0.0000
3
K5
0.0000
0.0000
4
4462
0.0030
0.0030
0.0030
5
4448
0.0060
0.0060
0.0060
0.0060
6
4447
0.0000
0.0000
0.0000
0.0030
0.0060
7
4445
0.0030
0.0030
0.0030
0.0030
0.0060
0.0030
8
4438
0.0015
0.0015
0.0015
0.0015
0.0045
0.0015
0.0015
9
4348
0.0030
0.0030
0.0030
0.0030
0.0060
0.0030
0.0030
0.0015
Table 3: Genetic distances between Bligon goats and reference sequences.
No.
Sample
1
2
3
4
5
6
7
8
9
10
11
12
13
1
LC571963.1 Capra hircus Marica
2
LC571973.1Capra hircus Kacang
0.0021
3
MH760795.1 Capra hircus Boer
0.0572
0.0595
4
MF048904.1 Capra hircus Samosir
0.0042
0.0063
0.0572
5
K2 HV1
0.0021
0.0042
0.0549
0.0063
6
K3 HV1
0.0021
0.0042
0.0549
0.0063
0.0000
7
K5 HV1
0.0021
0.0042
0.0549
0.0063
0.0000
0.0000
8
4462 HV1
0.0021
0.0042
0.0549
0.0063
0.0042
0.0042
0.0042
9
4448 HV1
0.0063
0.0084
0.0595
0.0063
0.0084
0.0084
0.0084
0.0084
10
4447 HV1
0.0021
0.0042
0.0549
0.0063
0.0000
0.0000
0.0000
0.0042
0.0084
11
4438 HV1
0.0021
0.0042
0.0595
0.0063
0.0042
0.0042
0.0042
0.0042
0.0084
0.0042
12
4445 HV1
0.0000
0.0021
0.0572
0.0042
0.0021
0.0021
0.0021
0.0021
0.0063
0.0021
0.0021
13
4348 HV1
0.0021
0.0042
0.0595
0.0063
0.0042
0.0042
0.0042
0.0042
0.0084
0.0042
0.0042
0.0021
Genetic diversity analysis revealed 9 sequences with 7 segregating sites (S) and 6 distinct haplotypes (h). The haplotype diversity (Hd) was 0.83333, indicating a high level of haplotypic variation among samples. The average number of nucleotide differences (Kt) was 1.88889, while nucleotide diversity (π) was 0.00393. These values indicate the presence of multiple maternal lineages within the sampled population despite the generally conserved nature of the mitochondrial sequences.
Genetic distance analysis
Pairwise genetic distances were calculated using the Kimura Two-Parameter (K2P) model , which accounts for differential rates between transition and transversion mutations and is widely applied in mitochondrial DNA studies. Analyses were conducted separately for the D-Loop and HV1 datasets using MEGA software.
D-loop region
Genetic distance values among Bligon goat samples based on the D-Loop region ranged from 0.000 to 0.006 (Table 2). Several samples exhibited a genetic distance of 0.000, indicating identical mitochondrial haplotypes. This narrow distance range reflects substantial mitochondrial homogeneity within the Bligon goat population ; ; ; . Such low levels of divergence suggest limited maternal introgression and are characteristic of indigenous livestock populations maintained under traditional breeding systems ; . The close genetic relationship observed with the Samosir goat further supports the existence of shared maternal ancestry among Indonesian goat populations .
HV1 region
Genetic distance analysis based on the HV1 region revealed greater variability, with values ranging from 0.0000 to 0.0595 (Table 3). One Bligon sample (4445 HV1) showed an identical HV1 sequence to the Marica goat (0.0000). Overall, genetic distances between Bligon goats and Indonesian local breeds ranged from 0.0000 to 0.0063 for Marica goats, 0.0021 to 0.0084 for Kacang goats, and 0.0042 to 0.0063 for Samosir goats. In contrast, the greatest genetic distances were observed between Bligon goats and Boer goats, particularly in samples 4448 HV1, 4438 HV1, and 4348 HV1, with values ranging from 0.0549 to 0.0595, indicating substantial genetic divergence .
The broader genetic distance range observed in the HV1 region reflects its higher mutation rate and highlights its sensitivity to detecting recent evolutionary divergence . The close genetic relationship between Bligon goats and Indonesian local breeds likely reflects a shared geographic origin and domestication history. In contrast, the pronounced divergence from Boer goats suggests geographic isolation and distinct evolutionary trajectories.
Phylogenetic analysis
Phylogenetic relationships were reconstructed using the Neighbor-Joining (NJ) method under the K2P model with 1,000 bootstrap replications ; ; . Reference sequences representing the six recognized Capra hircus mitochondrial haplogroups (A, B, C, D, F, and G) were included.
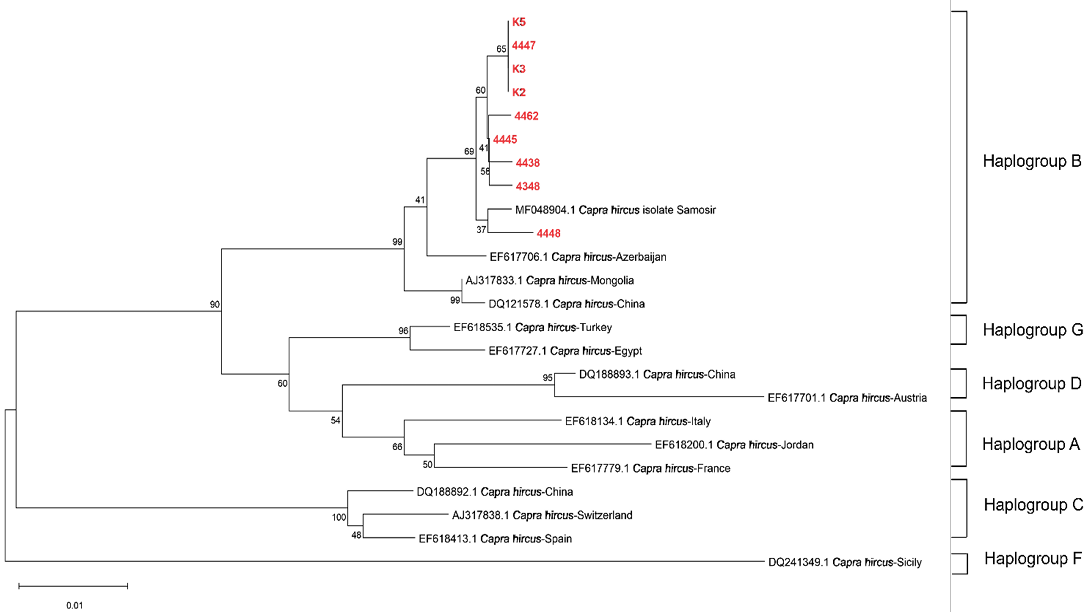
The phylogenetic tree based on the D-Loop region revealed a single, strongly supported clade containing all Bligon goat samples, corresponding to haplogroup B (Figure 2). Within this clade, Bligon goats clustered closely with Indonesian local goats (Kacang, Marica, and Samosir) and goats from China, Mongolia, Laos, and Azerbaijan. The strong bootstrap support observed in the D-Loop tree confirms the robustness of this haplogroup assignment.
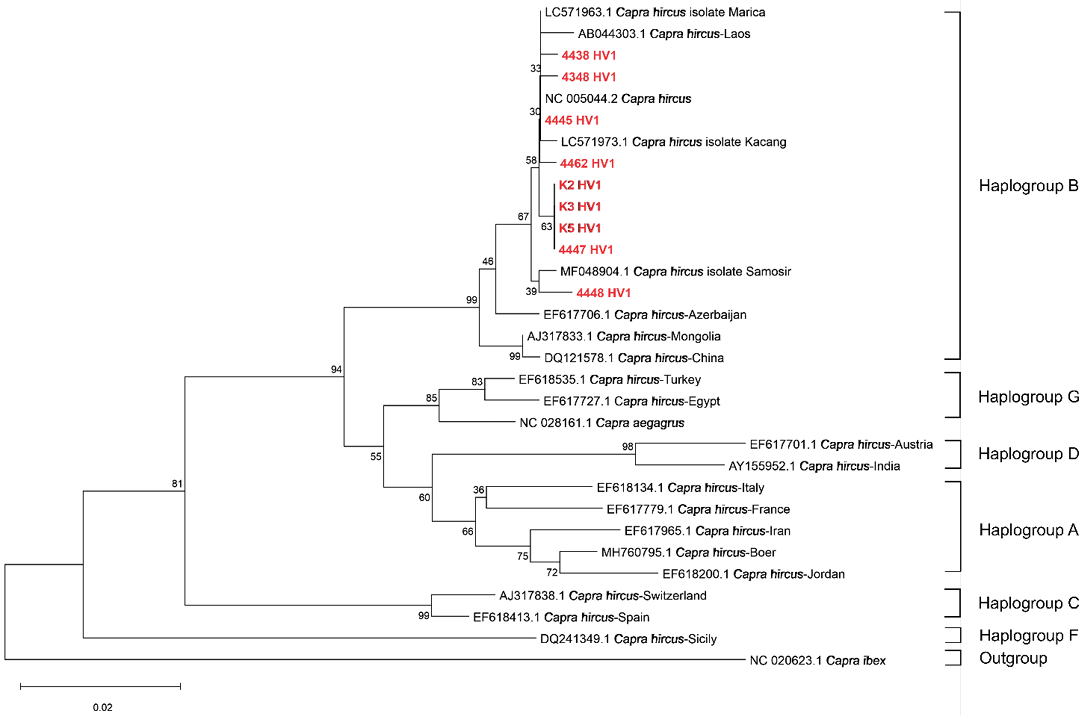
HV1-based phylogenetic reconstruction (Figure 3) revealed finer-scale branching patterns with variable bootstrap support. Despite this reduced resolution at sub-branch levels, all Bligon goat samples consistently remained within haplogroup B across both datasets. The weaker bootstrap support observed in some HV1 branches is likely attributable to the high mutation rate of this region rather than phylogenetic inconsistency.
The exclusive placement of Bligon goats within haplogroup B confirms that this breed belongs to a maternal lineage predominantly distributed throughout East and Southeast Asia. The absence of haplogroup A, which is commonly reported in Asian goat populations, may reflect regional genetic structuring rather than a genetic bottleneck or founder effect specific to the sampled population. This interpretation is supported by previous studies showing that Indonesian local goats are predominantly assigned to haplogroup B, suggesting a shared maternal lineage and historical population expansion within the region ; .
Although the present findings provide important insights into the maternal genetic structure of Bligon goats, the relatively small sample size (n= 9) and limited geographic sampling may not fully reflect the breed’s overall genetic diversity. Future studies incorporating larger sample sizes and broader geographic coverage are therefore recommended to provide a more comprehensive understanding of genetic diversity, population structure, and maternal lineage distribution within Bligon goat populations.
CONCLUSION
A comprehensive analysis of mitochondrial D-loop and HV1 sequences reveals that Bligon goats exhibit strong maternal lineage conservation while retaining detectable genetic variation at finer scales. All Bligon goats consistently belong to haplogroup B, confirming shared evolutionary origins with other Indonesian local goat breeds. This finding indicates that, maternally, Bligon goats do not represent a distinct lineage but are part of the broader Indonesian local goat genetic pool, suggesting a pattern of genetic continuity rather than divergence. The combined use of conserved and hypervariable mitochondrial regions provides a scientifically robust framework for genetic characterization, conservation planning, and sustainable management of indigenous goat genetic resources in Indonesia.
Acknowledgment
We thank the Government of Kulon Progo Regency for granting permission and supporting this study.
Novelty Statement
Previous studies on goat genetic diversity have mainly focused on the genetic characterization of local and indigenous breeds. However, information on the maternal genetic diversity and phylogenetic relationships of Bligon goats from Kulon Progo, Yogyakarta, remains limited. This study is novel in characterizing the mitochondrial genetic diversity, genetic distances, and phylogenetic relationships of Bligon goats based on the D-loop and HV1 regions, providing baseline information for their genetic conservation and management.
Author’s Contribution
Yudith VP, Aris H, and Krisna NA: Research design; Yudith VP, Jasmine Q, Haniya F, and Krisna NA: Methodology; Krisna NA: Validation; Yuriati, Tri A, and Reski A: Sample collection; Yudith VP, Jasmine Q, Haniya F, and Krisna NA: Data analysis; Yudith VP, Jasmine Q, Haniya F, and Krisna NA: Writing—original draft preparation; Krisna NA and Medania P: Writing—review and editing. All authors have read and agreed to the published version of the manuscript.
Ethical approval
The use of goats in this study was conducted following ethical guidelines reviewed and approved by the Ethical Clearance Commission of the Veterinary Medicine Faculty, Universitas Gadjah Mada (UGM). This approval was validated through the Ethical Clearance Statement No: 086/EC-FKH/Int./2022, issued on October 15th, 2022.
Generative AI and AI assisted technology statement
During the preparation of this work, the author(s) used Grammarly to assist with English grammar and writing. After using this tool/service, the author(s) reviewed and edited the content as needed and took full responsibility for the publication’s content.
Conflict of interest
The authors have declared no conflict of interest.
Figures
Figure 1:.
Agarose gel electrophoresis of PCR-amplified D-loop gene fragments from Bligon goat DNA samples. Distinct DNA bands were observed at the expected size of 734 bp, alongside a 100 bp DNA ladder.
Figure 2:.
The phylogenetic tree, based on D-loop sequences, illustrates the genetic relationships among Bligon goat samples and reference Capra hircus breeds from six haplogroups.
Figure 3:.
The phylogenetic tree, based on HV1 sequences, illustrates the genetic relationships among Bligon goat samples and reference Capra hircus breeds from six haplogroups.
References
Ang YS, Lai PS, Yung LYL (2020). Design of split proximity circuit as a plug-and-play translator for point mutation discrimination. Anal. Chem., 92: 11164–11170. https://doi.org/10.1021/acs.analchem.0c01379[CrossRef]
BPS-Statistics-Indonesia (2026). Livestock population by regency/municipality and kind of livestock in Yogyakarta province (heads).
Ferreira T, Rodriguez S (2024). Mitochondrial DNA: Inherent complexities relevant to genetic analyses. Genes, 15(5). https://doi.org/10.3390/genes15050617[CrossRef]
Gupta N (2019). DNA extraction and polymerase chain reaction. J. Cytol., 36: 116–117. https://doi.org/10.4103/JOC.JOC_110_18[CrossRef]
Haryanto A, Pantoro RC, Purwaningrum M, Andrian KN, Amalia R, Yuriati Y, Atmojo T (2025). Genetic diversity and phylogenetic analysis of bligon goats using partial mitochondrial cytochrome B gene. J. Anim. Health Prod., 13: 609–616. https://doi.org/10.17582/journal.jahp/2025/13.3.609.616[Full text][CrossRef]
Kaur A, Sharma AS, Singh J (2018). Construction of phylogenetic tree using MEGA. 2018 international conference on computing, power and communication technologies (GUCON), pp. 531–534. https://api.semanticscholar.org/CorpusID:90263647.
Kim G, Lee E, Kim K, Kim D, Kim S, Jin D, Song H, Mun S, Jeong H, Kim J, Choi B (2024). Mitochondrial genomes of Korean native black goats reveal shared phylogeographic patterns and demographic history. Animals, 14: 2949. https://doi.org/10.3390/ani14202949[CrossRef]
Kumar S, Stecher G, Suleski M, Sanderford M, Sharma S, Tamura K (2024). MEGA12: Molecular evolutionary genetic analysis version 12 for adaptive and green computing. Mol. Biol. Evol., 41: msae263. https://doi.org/10.1093/molbev/msae263[CrossRef]
Lestari DA, Purbowati E, Sutopo S, Kurnianto E (2018). Phylogenetical relationships between Kejobong goat and other goats based on the mtDNA D-loop sequence analysis. Trop. Anim. Sci. J., 41: 85–93. https://doi.org/10.5398/tasj.2018.41.2.85[CrossRef]
Mannen H, Iso K, Kawaguchi F, Sasazaki S, Yonezawa T, Dagong MIA, Bugiwati SRA (2020). Indonesian native goats (Capra hircus) reveal highest genetic frequency of mitochondrial DNA haplogroup B in the world. Anim. Sci. J., 91: e13485. https://doi.org/10.1111/asj.13485[CrossRef]
Nguluma AS, Kyallo M, Tarekegn GM, Loina R, Nziku ZC, Chenyambuga SW, Pelle R (2021). Mitochondrial DNA D-loop sequence analysis reveals high variation and multiple maternal origins of indigenous Tanzanian goat populations. Ecol. Evol., 11: 15961–15971. https://doi.org/10.1002/ece3.8265[CrossRef]
Pakpahan S, Artama WT, Widayanti R, Suparta IG (2015). Genetic variations and the origin of native Indonesian goat breeds based on mtDNA D-loop sequences. Asian J. Anim. Sci., 9: 341–350. https://doi.org/10.3923/ajas.2015.341.350[CrossRef]
Puspita RAA, Ibrahim A, Margawati ET, Subroto I, Jannah ZN, Panjono P, Andrian KN, Purwaningrum M, Haryanto A (2025). Preliminary study on phylogenetic analysis of Sakub sheep from Brebes regency based on the mitochondrial DNA (mtDNA) displacement loop (D-loop) gene sequence. Adv. Anim. Vet. Sci., 13: 1485–1490. https://doi.org/10.17582/journal.aavs/2025/13.7.1485.1490[Full text][CrossRef]
Silva NMV da, Pimenta-Filho EC, Arandas JKG, de Medeiros RB, Cavalcante-Neto A, Fonseca C, Ribeiro MN (2020). Genetic relationships between local Brazilian goat breeds based on mtDNA D-loop region similarity. Span. J. Agric. Res., 17: 407. https://doi.org/10.5424/sjar/2019174-14682[CrossRef]
Tamura K, Stecher G, Kumar S (2021). MEGA11: Molecular evolutionary genetics analysis version 11. Mol. Biol. Evol., 38: 3022–3027. https://doi.org/10.1093/molbev/msab120[CrossRef]
Warman AT, Sari RW, Atmoko BA, Budisatria IGS (2021). Kinerja induk kambing peranakan Etawah dan Bligon pada masa laktasi. J. Peternak. Indones., 23: 219–229. https://doi.org/10.25077/jpi.23.3.219-229.2021[CrossRef]
Widyas N, Nugroho T, Ratriyanto A, Prastowo S (2021). Crossbreeding strategy evaluation between Boer and Indonesian goat based on pre-weaning traits. Int. J. Agric. Technol., 17: 2461–2472.
Zein MS, Sulandari S, Jakaria J, Londra IM, Guntoro S, Partama IBG (2016). Genetic diversity and haplogroup of endangered Gembrong goat in Karangasem, Bali. J. Kedokt. Hewan, 10: 181–185. https://doi.org/10.21157/j.ked.hewan.v10i2.5134[CrossRef]
Phylogenetic Study of Bligon Goats from Kulon Progo Regency Based on Mitochondrial DNA (mtDNA) Displacement Loop (D-Loop) Region Sequence · ResearchersLinks