
The yak (Bos grunniens) is an indigenous domestic animal living at high altitudes in the Tibetan plateau that is economically important for the Tibetan people. In this study, we investigated the diversity and phylogeography of four geographic ecotype populations of the Naqu yak (133 individuals) using an 811-bp mitochondrial DNA D-loop region sequence. In total, 57 polymorphic sites, including 54 single-nucleotide polymorphisms and 3 single-nucleotide copy number variants, and 59 haplotypes were detected. The number of haplotypes within the population ranged from 17 (SN and JL) to 28 (DX). The haplotype diversity ranged from 0.9420 (SN) to 0.9770 (NR). The highest nucleotide diversity was found in the JL population (0.01479), whereas the lowest was found in the SN (0.00894) population. Phylogenetic analysis revealed that these four populations separated into two haplogroups; the first included SN, DX, and NR, and the second included JL. However, no significant divergence was found among the ecotype populations using a pair-wise difference comparison (FST). Thus, the Naqu yak has multiple maternal origins and demonstrates high diversity within 4 geographic ecotype yak populations. In addition, the yaks exhibit some diversity based on the number of unique haplotypes within each population; however, they have not heavily and significantly diverged because all the populations share the most high-frequency haplotypes. Therefore, this study not only shows that the different ecotype populations of the Naqu yak carry high genetic diversity but also indicates that frequent genetic material exchanges have led to smaller differences in genetic divergence between different ecotypes.
Research Article · Volume 50, Issue 6, 1 September 2018 · Open Access
Diversity Analysis of Chinese Tibetan Naqu Yak (Bos grunniens) Populations Using mtDNA
· · · · · · · · · ·
Affiliations & Notes ⌄
- 1Institute of Animal Husbandry and Veterinary Medicine, Tibet Academy of Agriculture and Animal Husandry Science, Lasa 850009, China 2Sichuan Academy of Grassland Sciences, Chengdu, Sichuan 611731, China 3Nagqu Grassland Station, Naqu 852000, China 4College of Animal Science and Technology, Southwest University, Chongqing 400715, China , Wang-Dui Basang and Tian-Wu An have contributed equally to this article. , * Corresponding author: eguangxin@126.com
Article Info ⌄
- Journal:
- Pakistan Journal of Zoology
- Published:
- 1 September 2018

From the article
- Additionally, the haplotype numbers of the four ecotype populations ranged from 17 to 28, revealing that the Naqu yak populations carried wide and abundant genetic diversity.
- However, no significant divergence in FST was found among the 4 Naqu yak populations, and their genetic distances recapitulated the geographic distances between populations.
- The Naqu yak has multiple maternal origins and high diversity within different geographic ecotype yak populations.
- Additionally, the yaks are highly diverse within populations, although they are not heavily divergent, because all populations share the highest frequency haplotypes.
Selected from the article's own text.
Abstract
Introduction
The domestic yak (Bos grunniens), which was domesticated from the wild yak (Bos mutus), is a long-haired, domesticated bovid that is found throughout the Himalayan region of the Indian subcontinent, the Tibetan Plateau and as far north as Mongolia and Russia. The yak plays important food, economic, and cultural roles in the Asian range and is an important domestic animal for the local people.
Mitochondrial genome sequence (mtDNA) analysis is a popular tool to estimate the phylogenic evolution and migration of humans (e.g., ; , wild (e.g., ; and domestic animals ; ; . In particular, previous studies have investigated yak diversity and population structures in different habitat locations in China, including Gansu and Qing-Hai (e.g., , Xin-Jiang (e.g., and Tibet (e.g., ; , using mtDNA.
Naqu, which is located in the northern part of the Tibet Autonomous Region in the hinterland of the Qinghai-Tibet Plateau, is one of the main farm sources of yaks in Tibet. This region has an average altitude of more than 4500 meters.
Studies of the domestication history of the Naqu yak and estimations of the gene flow among different ecotype yak populations in this area are important and will help improve the genetics of the local yak.
Materials and methods
Venous blood samples were obtained from 133 individual yaks from 4 ecotype populations in the Tibetan Naqu; their geographic information is presented in Table I. The blood samples were collected in EDTA tubes and frozen at -20°C prior to extraction. Genomic DNA was isolated using standard procedures ; the DNA quality was verified on a 1% agarose gel and quantified using a DTX microplate reader (Beckman Coulter, USA).
The high-variability region of the mitochondrial DNA control region (D-loop) was amplified using the mDNA-F (5’- GTA AAG AGC CTC ACC AGT AT -3’) and mDNA-R (5’- GTC GGG AGA CTC ATC TAG GC - 3’) from Mipam et al. (2012). PCR amplification was conducted in a PTC-100TM PCR instrument (MJ Research, Inc., MA, USA) with a total reaction volume of 50 μL containing 150 ng of DNA, 5 μL of 10× PCR standard reaction buffer, 4 μL (10 pmol/μL) of dNTPs, 2 μL (50 mmol/μL) of MgCl2, 1 μL (10 pmol/μL) of each forward and reverse primer, and 2.5 U of Taq DNA polymerase from Promega (Beijing, China). The PCR program was described in Mipam et al. (2012). The PCR products were directly sequenced using mDNA-F with the Genetic Analyzer 3130 xl (Applied Biosystems, USA).
The D-loop sequence alignments were constructed using the ClustalX software v2.0 . DnaSP 5.10 was used to screen haplotypes and to estimate polymorphisms and the average numbers of nucleotide differences between populations (Kxy). The best fitting model of DNA substitution for BI was obtained using jModelTest (0.1.1) . The maximum likelihood phylogenetic network of D-loops among all individuals was constructed with the MEGA (5.0) software , and the bootstrap values to support the nodes of the tree were based on 1000 iterations of the heuristic search. Pairwise differences in populations (FST; were displayed using the Arlequin software version 3.5.1.3 . In addition, a visual haplotype phylogenetic network and frequency distribution were conducted and subjected to median-joining network analysis according to the methods of Bandelt et al. (1999) and Lyimo et al. (2014) using Network 4.1 (http://www.fluxus-engineering.com/sharenet.htm).
Results
All of the Naqu yak sequences were aligned to the complete yak mitochondrial genome (GenBank No. KM223416) . A total of 133 sequences covering bp 1 to 359 and 15872 to 16319 (811 bp total) were obtained as reference sequences (M223416) of the yak mitochondrial D-loop region and submitted to GenBank (MG213580 to MG213712). In addition, 57 polymorphic sites, including 54 single-nucleotide polymorphisms and 3 single-nucleotide copy number variants, were identified in the D-loops of these 133 individuals.
The nucleotide polymorphisms ranged from 0.00894 (SN) to 0.01479 (JL). Tajima’s D ranged from -1.31787 (SN) to 0.26375 (NR), and the P-values of Tajima’s D in all the populations were not significant based on the chi-square test (P > 0.10; Table II).
Table I.- Geographic information for the sampling locations of the four Naqu yak populations.
| Ecotype population | Code | Sample size | Altitude (m) | Location | ||
| Jili Strain | JL | 26 | 4501 | 30.64081 | 93.23253 | Jiali town, Naqu, Tibet, China |
| Neirong Strain | NR | 30 | 4619 | 32.10777 | 92.30334 | Neirong town, Naqu, Tibet, China |
| Nima Strain | SN | 24 | 4541 | 31.78470 | 87.23677 | Nima town, Naqu, Tibet, China |
| DangXiong Strain | DX | 53 | 4293 | 30.47312 | 91.10116 | Dangxiong town, Naqu, Tibet, China |
Table II.- Nucleotide and haplotype polymorphisms of the mtDNA D-loop within the Naqu yak populations.
| Population | Sample size | Nucleotide polymorphism | Haplotype polymorphism | |||
| Nucleotide diversity (π) | Tajima’s D | Tajima’s D P-value | Number of haplotype | Haplotype diversity | ||
| JL | 26 | 0.01479 | 0.13439 | P > 0.1 | 17 | 0.9600 |
| NR | 30 | 0.01408 | 0.26375 | P > 0.1 | 22 | 0.9770 |
| SN | 24 | 0.00894 | -1.31787 | P > 0.1 | 17 | 0.9420 |
| DX | 53 | 0.01196 | -0.36650 | P > 0.1 | 28 | 0.9427 |
A total of fifty-nine haplotypes were identified in the 133 individuals. The DX population carried the largest number of haplotypes (28), whereas the SN and JL populations had the smallest number of haplotypes (17). The haplotype diversity of the four populations ranged from 0.9420 (SN) to 0.9770 (JL; Table II). The phylogenetic relationship of the 59 haplotypes was constructed using the maximum likelihood method, and two haplogroups were identified from the 59 haplotypes (Fig. 1). The highest frequency haplotypes were Hapotype_2, Haplotype_4, and Haplotype_8, which were shared by the four populations. Additionally, 13 of the 59 haplotypes were shared by two or three populations, and 43 haplotypes were unique (Fig. 2).
Table III.- Genetic divergence between populations with Kxy and matrix of the pairwise FST.
| Code | JL | NR | SN | DX |
| JL | \ | 12.31282 | 10.46635 | 11.70972 |
| NR | -0.01721 | \ | 10.37778 | 11.61887 |
| SN | 0.01724 | 0.00840 | \ | 9.40330 |
| DX | 0.00452 | -0.00318 | -0.00492 | \ |
Above diagonal, Kxy; below diagonal, FST.
In the FST analysis of the Naqu yak populations, the largest difference was found between JL and SN (FST=0.01724, P=0.25225±0.0445), and the smallest difference was found between JL and NR (FST=-0.01721, P=0.71171±0.0497 (Table III; Fig. 3). The FST distribution indicated that these four populations were separated into two groups; the first group contained JL, and the second group included SN, DX, and NR, which was consistent with the phylogenetic patterns of these four populations constructed using Kxy (Fig. 4; Table III). However, no significant divergence was observed between the populations according to the chi-square test of FST.
Discussion
Recently, mitochondrial DNA polymorphisms have been widely used to estimate the gene flow and phylogenetic relationships of maternal lineages in domestic animals (e.g., ; ; ; and wild animals (e.g., ; . The domestic yak (Bos grunniens) is a large and commercially important animal living in the Qinghai-Tibetan Plateau of China with a high-altitude climate . Various research efforts have addressed the diversity and population structure analysis of domestic yaks from different geographic distributions (e.g., ; ; ; .
Naqu is an important habitat of the Tibetan domestic yak in the northern part of the Tibetan Autonomous Region, as well as a junction between several Chinese yak breeding areas. Therefore, studying the diversity of different Naqu yak populations and assessing the gene flow with other yak populations from neighboring areas will contribute to our understanding of their genetic diversity status and help inform conservation policies.
First, the nucleotide polymorphisms of the D-loop region in this study ranged from 0.00894 to 0.01479; this range was larger than the number of polymorphisms detected in the Zhongdian yak (0.00534) but similar to the findings for 8 other Chinese Tibetan yak populations (0.00451 to 0.01438) . Additionally, this value was much larger than the number of polymorphisms found in the mtDNA ND6 gene . This observation is consistent with the hypothesis that the D-loop region contains the most polymorphisms in the mitochondrial DNA ; . Second, in comparison with previous studies, the haplotype diversity (Hi) of the 4 Naqu yak populations (0.9420 to 0.9770) was higher than the diversities among the eight different known Tibetan populations (0.827 to 0.927; , the Tianzhu white yak (Gansu, China), and the Jiulong yak (Sichuan, China) but was lower than the diversity of the Maiwa yak (Sichuan, China; . Additionally, the haplotype numbers of the four ecotype populations ranged from 17 to 28, revealing that the Naqu yak populations carried wide and abundant genetic diversity. In particular, the finding that 72.88% of all haplotypes were unique not only indicated high diversity within each ecotype population but also inferred that their genetic characteristics followed their geographical and ecological distributions.
However, no significant divergence in FST was found among the 4 Naqu yak populations, and their genetic distances recapitulated the geographic distances between populations. This finding is consistent with the grazing features on the Tibetan Plateau, including the nomadic process, which results in gene exchange among domestic animal populations accompanied by human migration (China National Commission of Animal Genetic Resources, 2011).
In addition, according to the phylogenetic network constructed using the maximum likelihood method, two D-loop haplotype haplogroups were identified from the 59 Naqu yak haplotypes; this finding was consistent with previous studies of the two known domestic sites in the Chinese Tibetan yak (e.g., ; . Finally, no significant differences were found based on Tajima’s D test (P > 0.10) of D-loop sequences in those populations, indicating that no historical population expansion occurred in the Naqu yak population.
Conclusion
The Naqu yak has multiple maternal origins and high diversity within different geographic ecotype yak populations. Additionally, the yaks are highly diverse within populations, although they are not heavily divergent, because all populations share the highest frequency haplotypes. Our work underlines the importance of Naqu yak genetic diversity studies not only to obtain a better understanding of the current domestic Naqu yak status but also to enhance and provide data for the development of biological genetic conservation strategies in the Qinghai-Tibet Plateau.
Acknowledgments
This work was supported by National Technical System for Beef and Yak Industry (CARS-37), and the National Natural Science Foundation of China (No. 31172195).
Statement of conflict of interest
Authors have declared no conflict of interest.
Figures
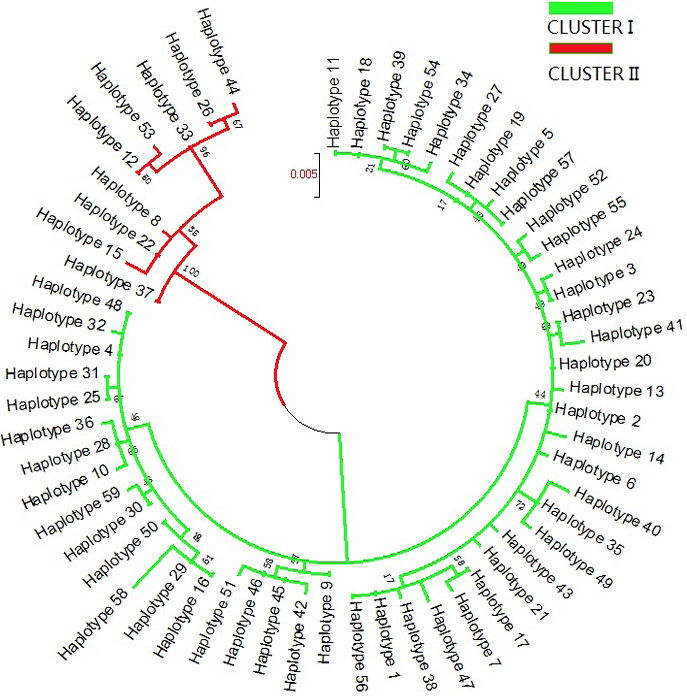
Molecular phylogenetic analysis of 59 Naqu yak mtDNA D-loop haplotypes using the maximum likelihood method. The evolutionary history was inferred using the maximum likelihood method based on the Tamura-Nei model (Tamura and Nei, 1993). The tree with the highest log likelihood (-1693.9317) is shown. The percentage of trees in which the associated taxa clustered together is shown next to the branches. Initial tree(s) for the heuristic search were obtained automatically by applying the neighbor-joining and BioNJ algorithms to a matrix of pairwise distances estimated using the maximum composite likelihood (MCL) approach and then selecting the topology with a superior log likelihood value. The rate variation model allowed some sites to be evolutionarily invariable ([+I], 46.4858% sites). The tree is drawn to scale, with branch lengths measured in the number of substitutions per site. The analysis involved 59 nucleotide sequences. A total of 811 positions were included in the final dataset.
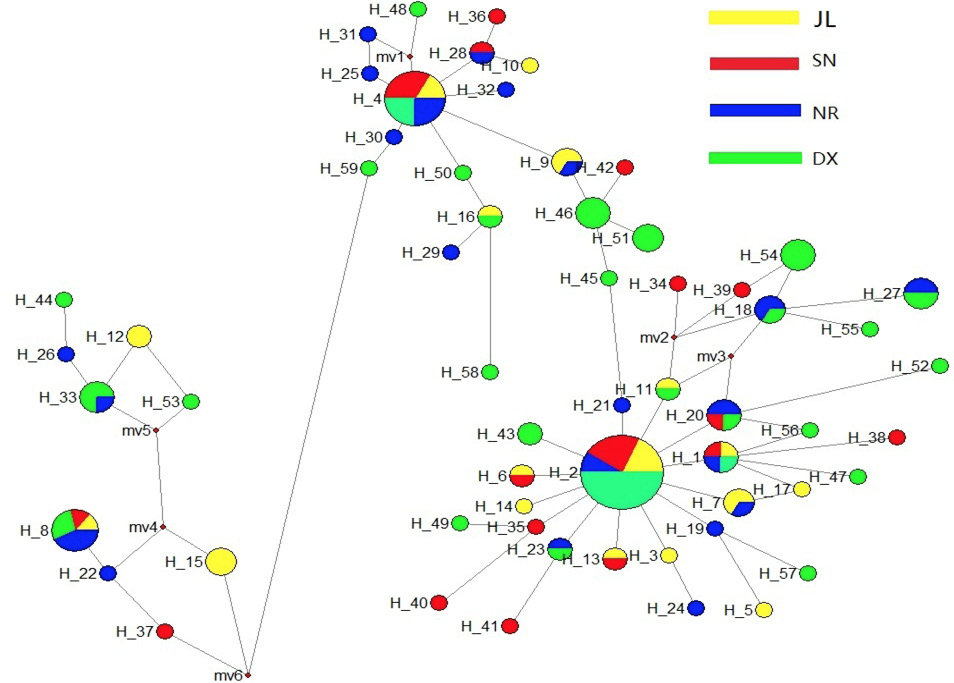
Network and frequency profiles of the 59 Naqu yak haplotypes with mtDNA D-loop sequences.
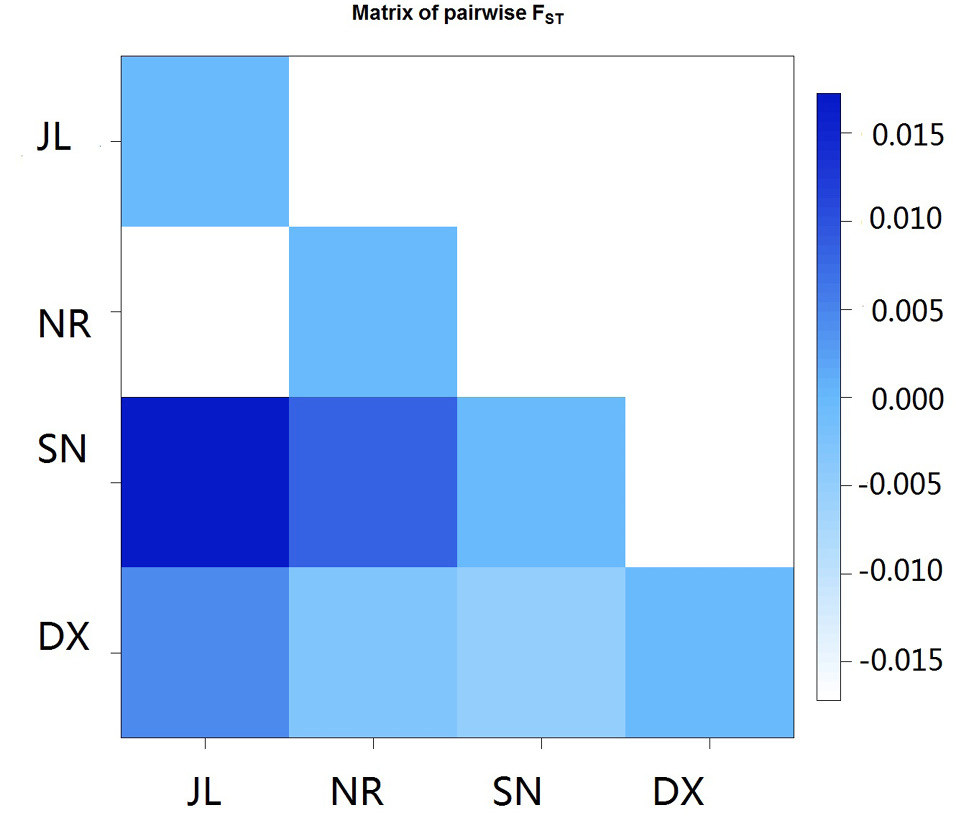
Matrix of pairwise FST values of the four Naqu ecotype yak populations.

Average number of nucleotide differences between populations (Kxy) among the four Naqu ecotype Yak populations based on DnaSP 5.10.
References
- Almarzook, S., Reissmann, M. and Brockmann, G.A., 2017. Diversity of mitochondrial DNA in three Arabian horse strains. J. appl. Genet., 58: 273-276. https://doi.org/10.1007/s13353-016-0384-z[CrossRef]
- Bandelt, H.J., Forster, P. and Röhl, A., 1999. Median-joining networks for inferring intraspecific phylogenies. Mol. Biol. Evol., 16: 37-48. https://doi.org/10.1093/oxfordjournals.molbev.a026036[CrossRef]
- Cheng, S.R., Zeng, Y.F., Wang, X.R., Zhang, L.P. and Wu, J.P., 2014. Genetic diversity and cluster analysis of six yak populations in Gansu province using mitochondrial D-loop sequence. Acta Agric. Boreali-Sin., 29: 16-21.
- China National Commission of Animal Genetic Resources, 2011. Animal genetic resources in China: Sheep and goats. Chinese Agricultural Press, Beijing.
- Deng, J., Feng, J., Li, L., Zhong, T., Wang, L., Guo, J., Ba, G., Song, T. and Zhang, H., 2017. Polymorphisms, differentiation, and phylogeny of 10 Tibetan goat populations inferred from mitochondrial D-loop sequences Mitochond. DNA A: DNA Mapp. Seq. Analysis, 30: 1-7.
- Elsner, J., Hofreiter, M., Schibler, J. and Schlumbaum, A., 2017. Ancient mtDNA diversity reveals specific population development of wild horses in Switzerland after the Last Glacial Maximum. PLoS One, 12: e0177458. https://doi.org/10.1371/journal.pone.0177458[CrossRef]
- Eusebi, P.G., Cortés, O., Dunner, S. and Cañón, J., 2017. Genetic diversity of the Mexican Lidia bovine breed and its divergence from the Spanish population. J. Anim. Breed. Genet., 134: 332-339. https://doi.org/10.1111/jbg.12251[CrossRef]
- Excoffier, L. and Lischer, H.E.L., 2010. A new series of programs to perform population genetics analyses under Linux and Windows. Mol. Ecol. Resour., 10: 564-567. https://doi.org/10.1111/j.1755-0998.2010.02847.x[CrossRef]
- Gao, Y.S., Jia, X.X., Tang, X.J., Fan, Y.F., Lu, J.X., Huang, S.H. and Tang, M.J., 2017. The genetic diversity of chicken breeds from Jiangxi, assessed with BCDO2 and the complete mitochondrial DNA D-loop region. PLoS One, 12: e0173192. https://doi.org/10.1371/journal.pone.0173192[CrossRef]
- Guangxin, E., Na, R.S., Zhao, Y.J., Gao, H.J., An, T.W. and Huang, Y.F., 2016. Complete mitochondrial genome of the a rare subspecies of genus Bos, Tianzhu white yak from Tibetan area in China. Mitochond. DNA A: DNA Mapp. Seq. Analysis, 27: 1443-1444.
- Guo, S., Savolainen, P., Su, J., Zhang, Q., Qi, D., Zhou, J., Zhong, Y., Zhao, X. and Liu, J., 2006. Origin of mitochondrial DNA diversity of domestic yaks. BMC Evol. Biol., 6: 73. https://doi.org/10.1186/1471-2148-6-73[CrossRef]
- Hai, T., Zhang, C.F., Xin, J.W., Ji, Q.M., Chai, Z.X., Zeng, X.B. and Zhong, J.C., 2014. Genetics diversity and phylogenetic analysis of mtDNA ND5 of Tibetan Yak. Southwest China J. agric. Sci., 27: 2666-2672.
- Hernández, C.L., Dugoujon, J.M., Novelletto, A., Rodríguez, J.N., Cuesta, P. and Calderón, R., 2017. The distribution of mitochondrial DNA haplogroup H in southern Iberia indicates ancient human genetic exchanges along the western edge of the Mediterranean. BMC Genet., 18: 46. https://doi.org/10.1186/s12863-017-0514-6[CrossRef]
- Huang, X.D., Tan, H.Y., Long, R., Liang, J.B. and Wright, A.D., 2012. Comparison of methanogen diversity of yak (Bos grunniens) and cattle (Bos taurus) from the Qinghai-Tibetan plateau, China. BMC Microbiol., 12: 237. https://doi.org/10.1186/1471-2180-12-237[CrossRef]
- Jia, X.X., Lu, J.X., Tang, X.J., Fan, Y.F., Huang, S.H., Ge, Q.L. and Gao, Y.S., 2017. Genetic diversity of Jiangsu native chicken breeds assessed with the mitochondrial DNA D-loop region. Br. Poult. Sci., 13: 1-6.
- Khaire, D., Atkulwar, A., Farah, S. and Baig, M., 2017. Mitochondrial DNA analyses revealed low genetic diversity in the endangered Indian wild ass Equus hemionus khur. Mitochond. DNA A: DNA Mapp. Seq. Analysis, 28: 681-686.
- Kim, J.H., Lee, S.S., Kim, S.C., Choi, S.B., Kim, S.H., Lee, C.W., Jung, K.S., Kim, E.S., Choi, Y.S., Kim, S.B., Kim, W.H. and Cho, C.Y., 2016. Haplogroup classification of Korean cattle breeds based on sequence variations of mtDNA control region. Asian-Australas. J. Anim. Sci., 29: 624-630. https://doi.org/10.5713/ajas.16.0281[CrossRef]
- Lai, S.J., Chen, S.Y., Liu, Y.P. and Yao, Y.G., 2007. Mitochondrial DNA sequence diversity and origin of Chinese domestic yak. Anim. Genet., 38: 77-80. https://doi.org/10.1111/j.1365-2052.2007.01555.x[CrossRef]
- Lai, S.J., Wang, L., Liu, Y.P. and Li, X.W., 2005. Study on mitochondrial DNA genetic polymorphism of some yak breeds in China. Acta Genet. Sin., 32: 463-470.
- Larkin, M.A., Blackshields, G., Brown, N.P., Chenna, R., McGettigan, P.A., McWilliam, H., Valentine, F., Wallace, I.M., Wilm, A., Lopez, R., Thompson, J.D., Gibson, T.J. and Higgins, D.G., 2007. Clustal W and Clustal X version 2.0. Bioinformatics, 23: 2947-2948. https://doi.org/10.1093/bioinformatics/btm404[CrossRef]
- Lyimo, C.M., Weigend, A., Msoffe, P.L., Eding, H., Simianer, H. and Weigend, S., 2014. Global diversity and genetic contributions of chicken populations from African, Asian and European regions. Anim. Genet., 45: 836-848. https://doi.org/10.1111/age.12230[CrossRef]
- Ming, L., Yi, L., Sa, R., Wang, Z.X., Wang, Z. and Ji, R., 2017. Genetic diversity and phylogeographic structure of Bactrian camels shown by mitochondrial sequence variations. Anim. Genet., 48: 217-220. https://doi.org/10.1111/age.12511[CrossRef]
- Mipam, T.D., Wen, Y., Fu, C., Li, S., Zhao, H., Ai, Y., Li, L., Zhang, L. and Zou, D., 2012. Maternal phylogeny of a newly-found yak population in china. Int. J. mol. Sci., 13: 11455-11470. https://doi.org/10.3390/ijms130911455[CrossRef]
- Nguluma, A.S., Msalya, G., Lyimo, C.M., Huang, Y., Zhao, Y., Chen, L., Guangxin, E. and Chenyambuga, S.W., 2017. Phylogenetic relationship and variation among four strains of small East African goats of Tanzania based on mitochondrial DNA. Asian-Australas. J. Anim. Sci., https://doi.org/10.5713/ajas.17.0327[CrossRef]
- Posada, D., 2008. jModelTest: Phylogentic model averaging. Mol. Biol. Evol., 25: 1253-1256. https://doi.org/10.1093/molbev/msn083[CrossRef]
- Qian, J.X., Qian, H.P., Xu, Z.W. and Yuan, B.B., 2013. Phylogenetic relationship of Bos grunniens in Qinghai based on mitochondrial cox1 and nad1 Genes. China Anim. Husband. Vet. Med., 40: 151-154.
- Rozas, J. and Rozas, R., 1995. DnaSP, DNA sequence polymorphism: an interactive program for estimating Population Genetics parameters from DNA sequence data. Comput. Applic. Biosci., 11: 621-625.
- Sambrook, J. and Russell, D., 2001. Molecular cloning: A laboratory manual, 3rd ed. Cold Spring Harbor Laboratory Press, New York.
- Schaan, A.P., Costa, L., Santos, D., Modesto, A., Amador, M., Lopes, C., Rabenhorst, S.H., Montenegro, R., Souza, B.D.A., Lopes, T., Yoshioka, F.K., Pinto, G., Silbiger, V. and Ribeiro-Dos-Santos, Â., 2017. mtDNA structure: the women who formed the Brazilian Northeast. BMC Evol. Biol., 17: 185. https://doi.org/10.1186/s12862-017-1027-7[CrossRef]
- Slatkin, M., 1995. A measure of population subdivision based on microsatellite allele frequencies. Genetics, 139: 457-462.
- Song, Q.Q., Zhong, J.C., Zhang, C.F., Xin, J.W., Ji, Q.M. and Chai, Z.X., 2014. Analysis on genetic diversity and phyletic evolution of mitochondrial DNA from Tibetan yaks. Acta Theriol. Sin., 34: 356-365.
- Tamura, K., Peterson, D., Peterson, N., Stecher, G., Nei, M. and Kumar, S., 2011. MEGA5: Molecular Evolutionary Genetics Analysis using Maximum Likelihood, Evolutionary Distance, and Maximum Parsimony Methods. Mol. Biol. Evolut., 28: 2731-2739. https://doi.org/10.1093/molbev/msr121[CrossRef]
- Tamura, K. and Nei, M., 1993. Estimation of the number of nucleotide substitutions in the control region of mitochondrial DNA in humans and chimpanzees. Mol. Biol. Evolut., 10: 512-526.
- Tsai, T. and St John, J.C., 2016. The role of mitochondrial DNA copy number, variants, and haplotypes in farm animal developmental outcome. Domest. Anim. Endocrinol., 56(Suppl): S133-146. https://doi.org/10.1016/j.domaniend.2016.03.005[CrossRef]
- Tu, S.Y., Wang, Q., Chai, Z.X. and Zhong, J.C., 2016. Analysis on genetic diversity and phyletic evolution of mitochondrial DNA D-loop region from Zhongdian Yak. China Herbivore Sci., 36: 5-10.
- Wang, L.P., Geng, R.Q., Chang, H., Ji, D.J., Li, Y.H. and Chang, C.F, 2013. Analysis on genetic diversity and phylogenetic relationship of Xingjiang bazhou Yak based on mitochondrial DNA. Acta Ecol. Anim. Domast., 34: 17-20.
- Xie, Y., Hoberg, E.P., Yang, Z., Urban, Jr, J.F. and Yang, G., 2017. Ancylostoma ailuropodaen sp. (Nematoda: Ancylostomatidae): A new hookworm parasite isolated from wild giant pandas in Southwest China. Parasit. Vectors, 10: 277. https://doi.org/10.1186/s13071-017-2009-8[CrossRef]
- Zhang, C.F., Xu, L.J., Ji, Q.M., Xin, J.W. and Zhong, J.C., 2012. Genetic diversity and evolution relationship on mtDNA D-loop in Tibetan yaks. Acta Ecol. Sin., 32: 1387-1395. https://doi.org/10.5846/stxb201107131039[CrossRef]
- Zhang, J., Jiao, T. and Zhao, S., 2016. Genetic diversity in the mitochondrial DNA D-loop region of global swine (Sus scrofa) populations. Biochem. Biophys. Res. Commun., 473: 814-820. https://doi.org/10.1016/j.bbrc.2016.03.129[CrossRef]
Cited by 1 article
In journals published by ResearchersLinks.
Services
Article usage statistics
Loading…