
Fishes belonging to family Cyprinidae are important for aquaculture and also for food and economy of Pakistan. Among members of Cyprinidae family, Indian major carp species (Labeo rohita, Cirrhinus mrigala, Catla catla)are very suitable fish species for culture in Pakistan. However, the identification and phylogeny of these fish species are of much interest today. DNA barcoding is used as a bio-identification tool for the organism globally. The current study was also conducted for the fast and accurate identification of Indian major carp species. The fishes used in this study were captured from four geographically isolated districts of Punjab province. Blood samples of sixty (60) fishes were taken carefully from caudal veins of each captured fish species. Genomic DNA was extracted from blood and short segment COI gene (680bp) was amplified by PCR. The sequences were evaluated by using bioinformatics tools. The average K2P conspecific, congenric and confamilial genetic distances were 0.22%, 6.71% and 12.33%, respectively. Findings of the present study revealed that DNA barcoding using COI gene is an efficient molecular technique for the exact identification of typical fish species.
Short Communication · Volume 52, Issue 1, 8 January 2020 · Open Access
Identification of Three Cyprinidae Family Members through Cytochrome Oxidase I
· · · · · · · ·
Affiliations & Notes ⌄
- 1Department of Fisheries and Aquaculture, University of Veterinary and Animal Sciences, Lahore 2Department of Science and Technology, Virtual University of Pakistan, Lahore 3Center of Excellence in Molecular Biology, University of the Punjab, Lahore 4Department of Zoology, University of the Punjab, Lahore , * Corresponding author: shahid.sherzada@uvas.edu.pk
Article Info ⌄
- Journal:
- Pakistan Journal of Zoology
- Published:
- 8 January 2020

From the article
- These results indicated that the average nucleotide diversity between same species is far less than that of mean nucleotide diversity between different fish species as indicated in Supplementary Table II.
- DNA barcoding is done with the help of a short segment of COI gene of mitochondrial DNA as this segment has a lot of variations among species which is critical for species identification.
- The current study involved the identification of Indian major carp species (Labeo rohita, Cirrhinus mrigala, Catla catla) through the amplification of a small sequence of COI gene of mitochondrial DNA.
- The results of this study indicated that COI gene can be effectively utilized for species discrimination and is also nominated as standard region for DNA barcoding.
Selected from the article's own text.
Abstract
Materials and methods
The fishes used in this trial were Labeo rohita, Cirrhinus mrigala and Catla catla. Twenty (20) fishes of each species were selected for blood sampling. These fishes were captured from four different districts located in Punjab province of Pakistan. Blood samples were taken from caudal vein and these samples were further preserved in EDTA coated vials in order to prevent blood clotting. The volume of blood in each vial was almost 1ml. The average length of these experimental fishes was 28±5 cm and average weight was 900±100g. The Morphological identification of all the selected fishes was done with the help of fish identification key provided by Punjab Fisheries Department. The genomic DNA was isolated from whole fish blood by using the standard organic method of DNA extraction . The extracted DNA was dissolved in low TE buffer and was stored at -20ºC. 1% agarose gel was used for the confirmation of DNA bands in the gel documentation system. Further DNA quantification of each sample was carried out with the help of Nanodrop (Thermo Scientific). Universal fish primers used for the amplification of a short segment of mitochondrial DNA are given as follows: Fish F1: 5-TCAACCAACCACAAAGACATTGGCAC-3’ and Fish R1: 5’-TAGACTTCTGGGTGGCCAAAGAATCA-3’.
The polymerase chain reaction (PCR) was accomplished using Thermocycler T100 BioRad . For this PCR reaction, a reaction mixture of 25 ul was made in PCR tubes. This reaction mixture comprised of 2ul DNA template, 1ul dNTPs, 3ul Mgcl2, 3ul buffer, 0.4ul primer forward, 0.4 ul primer reverse, 0.4ul Taq polymerase enzyme, and 14.8ul deionized water. The PCR conditions for this typical reaction were; initial denaturation for 5 min at 95ºC, denaturation for 30 sec at 95ºC, annealing at 55ºC for 1 min, extension at 72 ºC for 1 min and final extension for 10 min at 72ºC. The samples obtained after PCR, amplification was run on 1.5% agarose gel. The gel was then placed in a gel documentation system for the confirmation of PCR bands of required size. The most suitable and clearly identified amplified products were sent for sequencing.
Results
A total number of 13 COI barcodes were obtained from three fish species of Indian major carps (Labeo rohita, Cirrhinus mrigala, and Catla catla) that belong to family Cyprinidae. Universal fish DNA barcoding primers FI and RI were applied for the sequencing of the short region of mitochondrial DNA. The obtained barcode sequences were then blasted on NCBI and also checked through BOLD (barcode of life data) system. The species identified after sequencing of the COI gene along with their assigned Genbank numbers are listed in Supplementary Table I. The average length of the selected region was 680bp. The polymorphic sites were 119 and Parsimony informative sites were 88. Singleton variable sites were 15 and site positions were 24, 27, 35, 39, 43, 44, 47, 48, 49, 55, 58, 59, 61, 62 and 206. Analyzed sequences did not contain any insertions/deletions or pseudogenes (short sequences with stop codons) or contaminant sequences (e.g., from bacteria) that completely ensured that all the amplified sequences belong to functional mitochondrial COI sequences.
The mean K2P genetic distances, as well as mean nucleotide diversity, was calculated by using Kimura 2-parameter (K2P) distance model. All these values are presented in a tabular form in Supplementary Table II.
The phylogenetic analysis was done through the Neighbor-Joining tree method by using MEGA6 software. The nucleotide sequences computed for this analysis were 30. All the sites having missing data and gaps were removed. All the sequences of three above mentioned species were assessed with bootstrap values (1500 replicates). The species having maximum resemblance were clustered under the same node inside the tree. The suggested sequences were separated from sequences taken from NCBI and BOLD by black circles (Fig. 1).
Discussion
The objective of the current study was to identify the three members of Indian major carp species (Labeo rohita, Cirrhinus mrigala, and Catla catla) by sequencing short region of COI gene.
Species recognition on the molecular level with the help of DNA barcoding technique is commonly used all over the world. A typical fragment of mtDNA plays a pivotal role in the precise identification of those animal species which are still to be recognized correctly . A short segment of mitochondrial Cytochrome C oxidase 1 gene (COI) is employed for the better confirmation of unidentified species . The study of the COI gene is very helpful in species authentication as variation in amino acid sequence occurs at a slow rate than another mitochondrial gene . The main purpose of barcode studies is to define the species boundaries at COI gene locus for the recognition of unknown species but sometimes it leads to the discovery of unnoticed species and unusual species diversity ; .
In this study universal fish primers, F1 and R1 having average read length of 680bp were applied for the recovery of DNA barcodes of three members of Indian major carp species. The polymorphic sites were 119 and Parsimony informative sites were 88. Singleton variable sites were 15 and site positions were 24, 27, 35, 39, 43, 44, 47, 48, 49, 55, 58, 59, 61, 62 and 206. Analyzed sequences did not contain any insertions/deletions or pseudogenes (short sequences with stop codons) or contaminant sequences (e.g., from bacteria) that completely ensured that all the amplified sequences belong to functional mitochondrial COI sequences. The absence of stop codons in average read length of 680bp shows that NUMT (nuclear DNA sequence that originate from mitochondrial DNA sequence and are typically less than 700bp in length) were not sequenced and this result was in parallel with the already presented results ; .
The generated barcode sequences were blasted on NCBI and BOLD to obtained the related COI gene sequences for the assessment of nucleotide diversity and genetic divergence analysis of barcode sequences. A comprehensive analysis of all the barcode sequences showed a clear-cut identification and differentiation of all the species taken in this research work. The average K2P genetic distance within the species was 0.22% whereas the estimated genetic distance within genera was 6.71%. These results indicated that the average nucleotide diversity between same species is far less than that of mean nucleotide diversity between different fish species as indicated in Supplementary Table II. Furthermore, the intraspecific average nucleotide diversity at subfamily and the family level was 11.62% and 12.33%, respectively which showed a slight increase in nucleotide divergence when we advanced from sub family to family level. These results when compared with results concluded from DNA barcoding of Indonesian fresh water fishes, showed that there was a strong consistency of our results with Indonesian fresh water fishes having intraspecific (0.15%), intrageneric (2.53%) and intrafamilial (5.63%) K2P genetic distances .
The average conspecific, congeneric and confamilial K2P distances of our fishes were also in parallel with Australian marine fishes (0.39%, 9.93%, and 15.46%, respectively) as well as Canadian freshwater fishes (0.27%, 8.37%, and 15.38%, respectively) (Supplementary Table II). It was observed that there was a gradual increase in genetic distances with the rise of the taxonomic level, so a prominent change in the genetic distances was noticed when we move from species to higher taxonomic level. The variation was more among congeneric individuals which supports the arguments in the previous research papers that with the rise in taxonomic level the rate of nucleotide divergence increases ; ; .
The neighbor-joining tree analysis of 30 sequences was done that comprised of 13 resultant sequences and 17 additional sequences from closely related species showing 95-98% similarity in NCBI GenBank database. The neighbor-joining tree was generated by aligning the sequences with the help of Muscle (Multiple Sequence Comparison by Log-Expectation) alignments. These results revealed that the nucleotide divergence among the same species was low. However, it was high between different species of the same family. These results and tree presentation was almost parallel with the previous studies on fish barcoding (Karim et al., 2015; .
Conclusion
To study species identification and species diversity exactly is the main interest of many scientists all over the globe. DNA barcoding is an emerging tool for the precise recognition of typical species as well as proper discrimination among different species. It is a beneficial method for certification of many diverse species as old methods for species identification have some restrictions. DNA barcoding is done with the help of a short segment of COI gene of mitochondrial DNA as this segment has a lot of variations among species which is critical for species identification. This technique is also helpful in finding out the nucleotide divergence among organisms having closely related taxa. The current study involved the identification of Indian major carp species (Labeo rohita, Cirrhinus mrigala, Catla catla) through the amplification of a small sequence of COI gene of mitochondrial DNA. The results of this study indicated that COI gene can be effectively utilized for species discrimination and is also nominated as standard region for DNA barcoding.
Acknowledgments
Special thanks to the Virtual University of Pakistan for providing lab facilities for this work.
Supplementary material
There is supplementary material associated with this article. Access the material online at: https://dx.doi.org/10.17582/journal.pjz/2020.52.1.sc13
Statement of conflict of interest
The authors declare no conflict of interest.
Figures
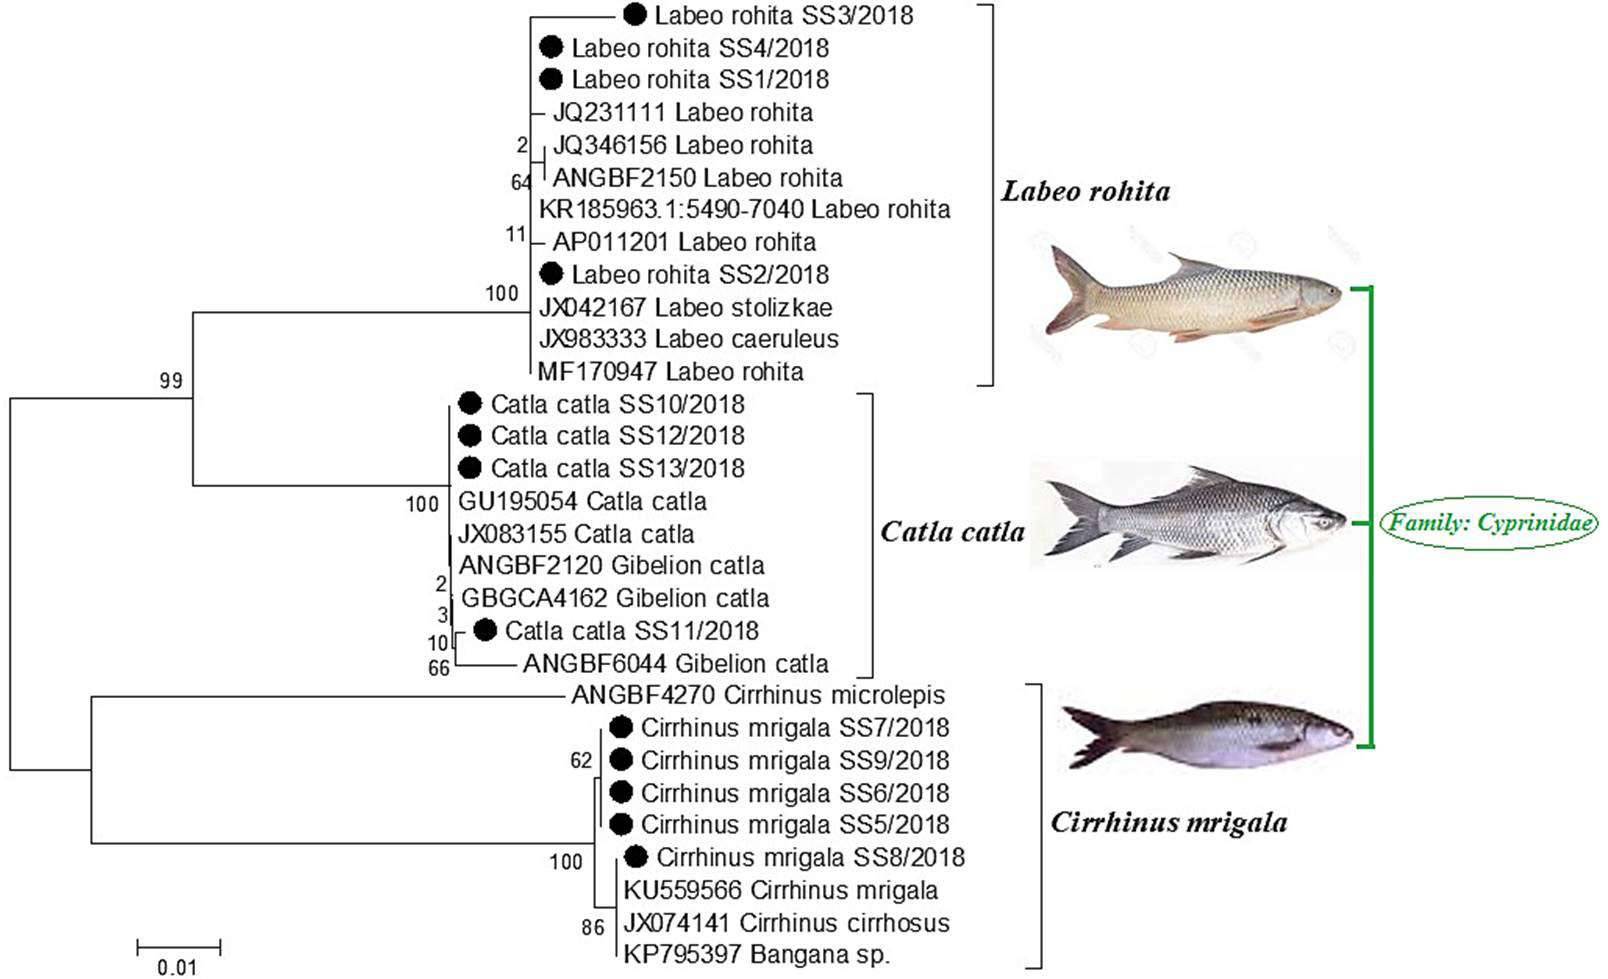
Neighbour joining tree of Indian Major Carps constructed on the basis of K2P genetic distance.
References
- Dawnay, N., Ogden, R., Mcewing, R., Carvalho, G.R. and Thorpe, R.S., 2007. Forens. Sci. Int., 173: 1-6. https://doi.org/10.1016/j.forsciint.2006.09.013[CrossRef]
- Hajibabaei, M., Singer, G.A., Hebert, P.D. and Hickey, D.A., 2007. Trends Genet., 23: 167-172. https://doi.org/10.1016/j.tig.2007.02.001[CrossRef]
- Hebert, P.D., Cywinska, A., Ball, S.L. and Dewaard, J.R., 2003. Proc. R. Soc. Lond. B: Biol. Sci., 270: 313-321. https://doi.org/10.1098/rspb.2002.2218[CrossRef]
- Hubert, N., Hanner, R., Holm, E., Mandrak, N.E., Taylor, E., Burridge, M. and Zhang, J., 2008. PLoS One, 3: e2490. https://doi.org/10.1371/journal.pone.0002490[CrossRef]
- Jaafar, T.N.A.M., Taylor, M.I., Nor, S.A.M., de Bruyn, M. and Carvalho, G.R., 2012. PLoS One, 7: e49623. https://doi.org/10.1371/journal.pone.0049623[CrossRef]
- Karim, A., Iqbal, A., Akhtar, R., Rizwan, M., Amar, A., Qamar, U. and Jahan, S., 2016. Mitochondrial DNA Part A, 27: 2685-2688.
- Kerr, K.C., Lijtmaer, D.A., Barreira, A.S., Hebert, P.D. and Tubaro, P.L., 2009. PLoS One, 4: e4379. https://doi.org/10.1371/journal.pone.0004379[CrossRef]
- Keskin, E. and Can, A., 2009. Biochem. Syst. Ecol., 37: 653-661. https://doi.org/10.1016/j.bse.2009.10.001[CrossRef]
- Lakra, W.S., Verma, M.S., Goswami, M., Lal, K.K., Mohindra, V., Punia, P. and Hebert, P., 2011. Mol. Ecol. Resourc., 11: 60-71. https://doi.org/10.1111/j.1755-0998.2010.02894.x[CrossRef]
- Lohman, D.J., Prawiradilaga, D.M. and Meier, R., 2009. Mol. Ecol. Resourc., 9: 37-40. https://doi.org/10.1111/j.1755-0998.2008.02221.x[CrossRef]
- Meyer, C.P. and Paulay, G., 2005. PLoS Biol., 3: e422. https://doi.org/10.1371/journal.pbio.0030422[CrossRef]
- Muchlisin, Z.A., Thomy, Z., Fadli, N., Sarong, M.A. and Siti-Azizah, M.N., 2013. Acta Ichthyol. Piscat., 43: 21-29. https://doi.org/10.3750/AIP2013.43.1.04[CrossRef]
- Muhammad, H., Iqbal Z. and Saleemi, S., 2017. Pakistan J. Zool., 49: 155-161. https://doi.org/10.17582/journal.pjz/2017.49.1.149.154[CrossRef]
- Ozcelik, H., Shi, X., Chang, M.C., Tram, E., Vlasschaert, M., di Nicola, N. and Sukhu, B., 2012. J. Mol. Diagn., 14: 467-475. https://doi.org/10.1016/j.jmoldx.2012.03.006[CrossRef]
- Sambrook, J. and Russell, D.W., 2006. Cold Spring Harb. Protoc., 2006: pdb-prot4455. https://doi.org/10.1101/pdb.prot4455[CrossRef]
- Tamura, K., Stecher, G., Peterson, D., Filipski, A. and Kumar, S., 2013. Mol. Biol. Evol., 30: 2725-2729. https://doi.org/10.1093/molbev/mst197[CrossRef]
- Valentini, A., Pompanon, F. and Taberlet, P., 2009. Trends Ecol. Evol., 24: 110-117. https://doi.org/10.1016/j.tree.2008.09.011[CrossRef]
- Ward, R.D., Zemlak, T.S., Innes, B.H., Last, P.R. and Hebert, P.D., 2005. Phil. Trans. R. Soc. B, 360: 1847-1857. https://doi.org/10.1098/rstb.2005.1716[CrossRef]
Supplementary material
Cited by 1 article
In journals published by ResearchersLinks.
Services
Article usage statistics
Loading…