
The current study aimed at genetic analysis of by Cirrhinus mrigala using mitochondrial DNA marker cytochrome oxidase I (COI). Genomic DNA isolated from whole blood was used to amplify and sequence a short region of COI gene in mitochondrial DNA. The identification of sequenced samples was done by NCBI (98-99%) and BOLD (99%) databases. The sequence data analysis represented 15 variable polymorphic sites and 4 haplotypes. Mean haplotypes and nucleotide diversity was 0.42 and 0.0018, respectively. The mean intraspecific and intragenric K2P genetic distances were 0.2% and 1.2%, respectively. Rate of transitional and transversional substitution was 16.68% and 4.16%, respectively. The transition/transversion bias value R was 1.25. The negative values of Tajima D test as well as Fu and Li D and F tests supported the process of population expansion with excess of rare alleles. The overall results showed a lack of neutral evolution and low genetic differentiation among populations of C. mrigala.
Short Communication · Volume 54, Issue 3, 7 March 2022 · Open Access
Genetic Structure Analysis of Freshwater Fish Cirrhinus mrigala by Mitochondrial COI Gene
· ·
Affiliations & Notes ⌄
- 1Department of Zoology, University of the Punjab, Lahore, Pakistan 2Department of Fisheries and Aquaculture, University of Veterinary and Animal Sciences, Lahore, Pakistan 3University of Agriculture, Dera Ismail Khan, Pakistan * Corresponding author: shahid.sherzada@uvas.edu.pk
Article Info ⌄
- Journal:
- Pakistan Journal of Zoology
- Published:
- 7 March 2022

From the article
- The significant negative values of Tajima D test and the Fu and Li D and F tests indicated a sudden expansion in population or genetic hitchhiking.
- A low level of genetic divergence was found among the samples of C. mrigala captured from four different sites.
- Therefore, a broad spectrum study involving more sampling locations and use of some extra genetic markers is inevitable for solid assessment of genetic differentiation among C. mrigala population in Pakistan.
- This information will ultimately aid in genetic improvement and management of cultured and wild populations of C. mrigala.
Selected from the article's own text.
Abstract
Materials and methods
Fortyfour fish samples were captured from four geographically isolated fish farms located in Punjab province of Pakistan. Blood samples were taken from fish gills and these samples were further preserved in EDTA coated vials in order to prevent blood clotting. Four site locations were; Qaim Bharwana fish farm District Jhang (30.97ºN, 72.15ºE), Haveli Koranga fish farm District Khanewal (30.65ºN, 72.02ºE), Murad Abad fish farm District Muzafargarh (30.18ºN, 71.03ºE) and Rajanpur fish farm District Rajanpur (29.08ºN, 70.29ºE). The average length of these experimental fishes was 34±5 cm and average weight was 900±100g.
Morphometric identification was done following taxonomic key and also by the key provided by Punjab Fisheries Department.
The genomic DNA was isolated from whole fish blood by using the standard organic method of DNA extraction with some modifications. The extracted DNA was dissolved in low TE buffer and was stored at -20ºC. Extracted DNA was quantified by gel electrophoresis and by Nanodrop method.
Universal fish primers used for the amplification of a short segment of mitochondrial DNA are given as follows:
Fish F1: 5’TCAACCAACCACAAAGACATTGGCAC3’
Fish R1: 5’TAGACTTCTGGGTGGCCAAAGAATCA3’
The polymerase chain reaction (PCR) was accomplished using Thermocycler T100 BioRad . For PCR reaction, a reaction mixture of 25 µl comprised of 2µl DNA template, 1µl dNTPs, 3µl Mgcl2, 3µl buffer, 0.4µl primer forward, 0.4 µl primer reverse, 0.4µl Taq polymerase enzyme, and 14.8µl deionized water. The PCR conditions comprised initial denaturation for 5 min at 95ºC, denaturation for 30 seconds at 95ºC, annealing at 55ºC for 1 min, extension at 72ºC for 1 min and final extension for 10 min at 72ºC. The PCR product checked on 1.5% agarose gel were sent for sequencing.
The sequenced samples were assembled and aligned base pair wise by using BIOEDIT software and Clustal W alignment programme. Bioinformatics data analysis tools like MEGA version 6.0, DNASP version 5.0 were utilized for the assessment of genetic distances, number of haplotypes, polymorphic sites, haplotypes diversity and nucleotide diversity etc. .
Results and discussion
A partial sequence of COI gene was used and a consensus sequence of 649 bp was applied for further data analysis. COI sequences of C. mrigala were aligned and checked for species resemblance with reference sequences on NCBI (98-99%) and BOLD (99%) databases. Proper accession numbers were assigned to submitted sequences of C. mrigala fish species (Table 1). Genetic relationship among Cirrhinus species is evaluated by Maximum likelihood tree method (Fig. 1). Average read length was 649bp having 15 variable polymorphic sites. Out of 15 variable polymorphic sites, singleton variable characters were 6 having site positions; 3, 111, 165, 633, 645 and 649 while variable characters with parsimony informative sites were 9. Numbers of haplotypes were 4 (Fig. 2). More variable sites were found in first codon which indicated that evolutionary process took many years to happen in different fishes of family cyprinidae ; . Mean haplotypes and nucleotide diversity was 0.42 and 0.0018, respectively. A similar pattern of haplotype diversity (0.5256 ± 0.1527 and 0.4909 ± 0.1754) in Bagarius bagarius populations as well as nucleotide diversity (.0022) was observed in Indian major carp species.
Table I. Haplotypes of COI gene of Cirrhinus mrigala collected from sampling sites with assigned Genbank Accession numbers.
| Sampling sites | Site location | Samples | Accession number |
| Qaim Bharwana | 30.97ºN 72.15ºE | 12 | MK820366 |
| Haveli Koranga | 30.65ºN 72.02ºE | 8 | MK820367 |
| Murad Abad | 30.18ºN 71.03ºE | 10 | MK820368 |
| Rajanpur | 29.08ºN 70.29ºE | 14 | MK820369 |
The mean intraspecific and intragenric K2P genetic distances were 0.2% and 1.2%, respectively. The intragenric variation (1.2%) was greater than intraspecific variation (0.2%) and such kind of results were also reported previously for COI and cytochrome b genes in some other fishes of different families ; . The transition/transversion bias value R was 1.25 while gamma parameter distribution value was 26.09. Rate of transitional and transversional substitution was 16.68% and 4.16% respectively. Rate of transition substitution were higher than transversion substitution at all three codon position and this high transition bias value is very common in vertebrate mitochondrial DNA ; ; .
The average values of nucleotides in C. mrigala was calculated as T, 28%; C, 28.7%; A, 25.3%; G, 18% with combined composition as, A+T= 53.3%, G+C= 46.7%. Low GC content of nucleotide composition indicated a typical anti-G bias pattern which is usually found in freshwater teleost fishes ; . The rate of population demographic changes (bottlenecks or expansions) and neutrality test was assessed by using two approaches; Tajima D test and the Fu and Li D and F tests (Tajima D: -1.04849; Fu and Li’s D test: -1.0419; Fu and Li’s F test: -1.05189). The significant negative values of Tajima D test and the Fu and Li D and F tests indicated a sudden expansion in population or genetic hitchhiking. This phenomenon of population expansion or genetic hitchhiking was a sign of inflow of excess number of alleles into the populations. These results were totally in agreement with the results found in genetic diversity analysis of Chocolate mahseer (Neolissochilus hexagonolepis) populations as well as Bagarius bagarius populations .
Conclusion
A low level of genetic divergence was found among the samples of C. mrigala captured from four different sites. Therefore, a broad spectrum study involving more sampling locations and use of some extra genetic markers is inevitable for solid assessment of genetic differentiation among C. mrigala population in Pakistan. This information will ultimately aid in genetic improvement and management of cultured and wild populations of C. mrigala.
Statement of conflict of interest
The authors have declared no conflict of interest
Figures
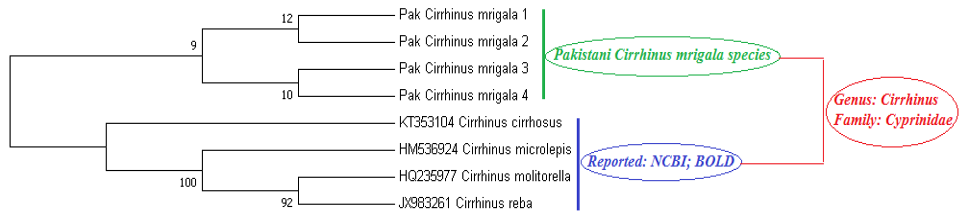
Genetic relationship among Cirrhinus Species by neighbour joining tree method.
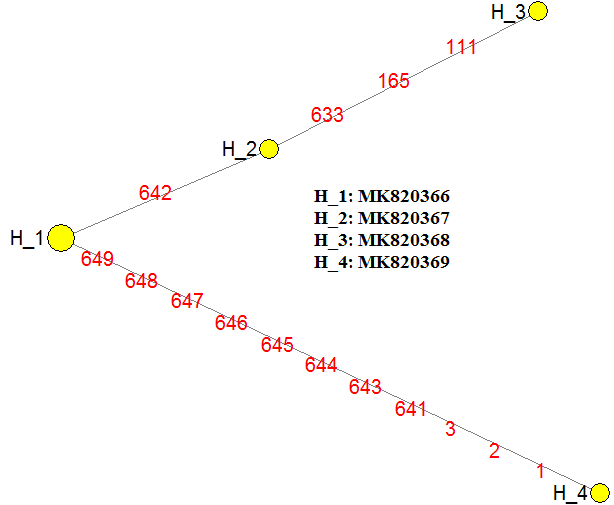
Cirrhinus mrigala haplotypes alongwith variation sites.
References
- Akhtar, T. and Ali, G., 2016. Mitochondr. DNA Part B, 1: 934-936. https://doi.org/10.1080/23802359.2016.1258337[CrossRef]
- Barat, A., Ali, S., Sati, J. and Sivaraman, G.K., 2012. Indian J. Fish, 59: 43-47.
- FAO, 2009. FishStat Plus universal software for fishery statistical time series. Version 2.3. Fisheries and Aquaculture Information and Statistics Service (FIES). FAO, Rome, Italy.
- Froese, R. and Pauly, D., 2006. Fish Base. World Wide Web Electronic Publication. World Fish Center (ICLARM). www.FishBase.Org.
- Habib, M., Lakra, W.S., Mohindra, V., Khare, P., Barman, A.S., Singh, A., Lal, K.K., Punia, P. and Khan, A.A., 2011. Mol. Biol. Rep., 38: 841-846. https://doi.org/10.1007/s11033-010-0175-2[CrossRef]
- Hubert, N., Hanner, R., Holm, E., Mandrak, N.E., Taylor, E., Burridge, M., Watkinson, D., Dumont, P., Curry, A., Bentzen, P. and Zhang, J., 2008. PLoS One, 3: e2490. https://doi.org/10.1371/journal.pone.0002490[CrossRef]
- Karim, A., Iqbal, A., Akhtar, R., Rizwan, M., Amar, A., Qamar, U. and Jahan, S., 2016. Mitochondr. DNA Part A, 27: 2685-2688. https://doi.org/10.3109/19401736.2015.1043544[CrossRef]
- Khan, MF., Nasir Khan Khattak, M., He, D., Liang, Y., Li, C., Ullah Dawar, F. and Chen, Y., 2016. Mitochondr. DNA Part A, 27: 3630-3632. https://doi.org/10.3109/19401736.2015.1079829[CrossRef]
- Lowenstein, J.H., Burger, J., Jeitner, C.W., Amato, G., Kolokotronis, S.O. and Gochfeld, M., 2010. Biol. Lett., 6: 692-695. https://doi.org/10.1098/rsbl.2010.0156[CrossRef]
- Meyer, A., 1993. Biochem. Mol. Biol. Fish., 2: 38.
- Mirza, M.R. and Sandhu, A.A., 2007. Fishes of the Punjab Pakistan. Polymer Publication, Urdu Bazar, Lahore.
- Nadiatul, H.H., Daud, S.R., Siraj, S.S., Sungan, S. and Moghaddam, F.Y., 2011. Iran. J. Anim. Biosyst., 7: 119-127.
- Nagarajan, M., Raja, M. and Vikram, P., 2016. Mitochondr. DNA Part A, 27: 3781-3783. https://doi.org/10.3109/19401736.2015.1079902[CrossRef]
- Ozcelik, H., Shi, X., Chang, M.C., Tram, E., Vlasschaert, M., Di Nicola, N., Kiselova, A., Yee, D., Goldman, A., Dowar, M. and Sukhu, B., 2012. J. mol. Diagn., 14: 467-475. https://doi.org/10.1016/j.jmoldx.2012.03.006[CrossRef]
- Rozas, J., Sanchez, J.C., Messeguer, X. and Rozas, R., 2003. Bioinformation, 19: 2496-2497. https://doi.org/10.1093/bioinformatics/btg359[CrossRef]
- Shui, B.N., Han, Z.Q., Gao, T.X., Miao, Z.Q. and Yanagimoto, T., 2009. Fish Sci., 75: 593-600. https://doi.org/10.1007/s12562-009-0083-3[CrossRef]
- Sambrook, J. and Russell, D.W., 2006. Cold Spring Harb. Protoc., 1: 4455. https://doi.org/10.1101/pdb.prot3847[CrossRef]
- Sharma, L., Ali, S., Barat, A., Kumar, R., Pande, V., Laskar, M.A., Sahoo, P.K. and Sumer, S., 2019. Mitochondr. DNA Part A, 30: 397-406. https://doi.org/10.1080/24701394.2018.1526929[CrossRef]
- Wang, H.Y., Tsai, M.P., Tu M.C. and Lee S.C., 2002. Zool. Stud., 39: 61-66. https://doi.org/10.1007/BF02717530[CrossRef]
- Ward, R.D., 2009. Mol. Ecol. Resour., 9: 1077-1085. https://doi.org/10.1111/j.1755-0998.2009.02541.x[CrossRef]
- Ward, R.D., Zemlak, T.S., Innes, B.H., Last, P.R. and Hebert, P.D., 2005. Philos. Trans. R. Soc. B: Biol Sci., 360: 1847-1857. https://doi.org/10.1098/rstb.2005.1716[CrossRef]
Services
Article usage statistics
Loading…