
To recognize molecular markers of slaughter performance of quail, SNP in control regions of cytogenin gene (MyoG) 5’ in French giant quail, and Savimit quailwas detected by PCR-SSCP method in this study. Moreover, correlations of control regions of MyoG 5’ with slaughter performance of quail were analyzed. Results demonstrated that: In meat quail, three genotypes (AA, BB and AB) were detected at locus A in the control region of MyoG 5’. For locus A, BB frequency of French giant quail and Savimit quail was the highest (0.531 and 0.750). For locus B, three genotypes (AA, AB and BB) were detected in Savimit quail, but only AA was detected in French giant quail. The BB frequency of Savimit quail was the highest, reaching 0.389. Locus A showed a significant correlation with liver weight of meat quails(P<0.05), while locus B presented significant correlations with body weight, carcass weight, carcass net weight, liver weight, breast muscle weight and leg muscle weight(P<0.05). Loci A and B in the control region of MyoG 5’ can be used as the molecular marker of slaughter performance of meat quails during marker assisted selection.
Short Communication · Volume 53, Issue 2, 28 February 2021 · Open Access
Association between Myogenin Gene Polymorphism and Slaughter Traits of Meat Quails
· · · · · · · ·
Affiliations & Notes ⌄
- 1Henan University of Science and Technology, College of Animal Science and Technology, Luoyang 471 023, China , * Corresponding author: junyanbai@163.com
Article Info ⌄
- Journal:
- Pakistan Journal of Zoology
- Published:
- 28 February 2021

From the article
- Gene frequency and genotype frequency at loci A and B in the control region of MyoG 5’ in French giant quail and Savimit quail are listed in Table II.
- For locus B, three genotypes (AA, AB and BB) are detected in Savimit quail, but only AA is detected in French giant quail.
- Correlation analysis between polymorphism of the control region of MyoG 5’ and slaughter performance of meat quail is shown in Table III.
- AA, AB and BB genotypes of A locus in 5’regulatory region of MyoG gene here was no significant effect on other slaughter performance (P >0.05).
Selected from the article's own text.
Abstract
Materials and methods
Blood samples (5ml each) were collected from vein in the wings of 50 French giant quail and 50 Savimit quail, which were stored in heparin sodium anticoagulant tubes and kept in a refrigerator at -20℃ for DNA extracting. Quails were slaughtered at the age of 5 weeks and the following slaughter performance indices were recorded: weight, carcass weight, whole net carcass, heart weight, liver weight, breast muscle weight, leg muscle weight, dressing percentage, whole net carcass rate, heart rate, liver rate, breast muscle rate and leg muscle rate.
Primers at loci A and B in the control region of MyoG 5’ were designed according to Wang et al. (2007) and were synthesized by Beijing Dingguo Changsheng Biotechnology Co., Ltd (Table I). The total volume of PCR reactionn mixture was 12 µL, including 8.15 µL of ddH2O, 1.25µL of 10×buffer, 0.75µL of Mg 2+ (25 mmol/L), 0.5µL of DNA template, 0.5µL (10 mmol/L) of upstream primers, 0.5µL (10 mmol/L) of downstream primers, 0.25µL of dNTPs, and 0.1µL of taq enzyme. The thermal cycle program was set as follows: pre-denaturation at 94℃ for 4 min, then denaturation at 94℃ for 40 s, annealing at 57-60℃ for 1 min, annealing at 72℃ for 20 seconds, denaturation, annealing and elongation were carried out for 35 cycles, then elongation at 72℃ and finally the reaction was completed and cooled and preserved at 4℃.
After SSCP analysis 5µL denatured buffer (98% formamide, 2% glycerin, 10 m medta, 0.025% bromophenol blue, 0.025% xylene) was taken in 0.2 mL centrifuge tube. 5µL PCR products were added and mixed evenly. After denaturation in water bath at 98℃ for 10min, 10µL of mixed liquid was added into the point sample hole with a pipette gun, another sample hole was added with 5µL of DL2000 marker as reference. The electrophoresis tank was covered with upper cover, connected with the power supply to start electrophoresis. The electrophoresis conditions were 220V electrophoresis for 15min, then 90V electrophoresis for 6h. After electrophoresis, silver nitrate staining was carried out and the results were photographed.
Analytical model: yijkl = μ+Bi+Sj+Mk+eijkl, Yijkl is the phenotype value of traits, μ is the total mean value, Bi is the effect of the i th variety (i = 1, 2), Sj is the effect of the j th sex, Mk is the effect of the k th genotype effect, eijkl is the residual effect.
Results and discussion
Figure 1 shows the amplified bands of loci A and B in the control region of MyoG 5’. Figure 2 shows genotype at loci A and B of the control region of MyoG 5’ of French giant quail and Savimit quail. For French giant quail and Savimit quail, three genotypes (AA, BB and AB) were discovered at locus A. Besides that, three genotypes (AA, BB and AB) were discovered at locus B.
Tang et al. (2013) discovered one mutation site at exon 1 and exon 3 of MyoG of Jinghai yellow chicken, which involved 3 genotypes. Zhao et al. (2016) discovered 1, 2 and 3 mutation sites in exons 1, 2 and 3 of MyoG of three ear duck. Wang et al. (2007) discovered one mutation site and 3 genotypes at locus A in the control region of MyoG5’ of broiler chicken and found 3 SNPs loci and 6 genotypes at loci B. Wei et al. (2014) found 2 mutation sites and 6 genotypes in the third exon of MyoG of Bian chicken. In this study, polymorphism at loci A and B in the control region of MyoG 5’ of two meat quail groups was tested. Three genotypes were discovered at loci A and B, which were AA, AB and BB. This revealed that MyoG had rich polymorphism in meat quail groups, which was similar to polymorphism repored from other poultries.
Gene frequency and genotype frequency at loci A and B in the control region of MyoG 5’ in French giant quail and Savimit quail are listed in Table II. For locus A, BB frequency of French giant quail and Savimit quail is the highest, reaching 0.531 and 0.750. B allele frequency is the highest, which values 0.582 and 0.833, respectively. Genetic polymorphism of French giant quail is high (He=0.487). For locus B, three genotypes (AA, AB and BB) are detected in Savimit quail, but only AA is detected in French giant quail. For Savimit quail, the highest BB frequency is 0.389 and the highest B allele frequency is 0.569. Genetic polymorphism of Savimit quail is high (He= 0.490).
Note: M is Marker DL2000. Lane 1 is French giant quail and Lane 2 is Savimit quail.
Note: M is Marker DL2000; A: Lane1 is AA genotype, Lanes 2, 3, 4, 5, 6, 7 is BB genotype and Lane 8 is AB genotype. B: Lanes 9, 11, 12, 13 are BB genotypes. Lanes 10, 15 are AB genotypes. Lanes14, 16 are AA genotypes.
Correlation analysis between polymorphism of the control region of MyoG 5’ and slaughter performance of meat quail is shown in Table III. For locus A, liver weight of AA is significantly higher compared with that of AB (P<0.05), liver weights of AA and AB are similar with that of BB (P>0.05). AA, AB and BB genotypes of A locus in 5’regulatory region of MyoG gene here was no significant effect on other slaughter performance (P >0.05). For loci B in the control region of MyoG 5’, weight, carcass weight, carcass net weight, liver weight, breast muscle weight and leg muscle weight of AA and BB are significantly higher than those of AB (P<0.05), besides, there’s no significant difference between AA and BB in term of weight, carcass weight, carcass net weight, liver weight, breast muscle weight and leg muscle weight (P >0.05). Different genotype has no significant influences on other slaughter performances. (P >0.05).
In studies on correlation between MyoG polymorphism and production performance of poultries,
Table I. Primer sequence of A and B loci of MyoG.
| Primer | Primer sequence(5’-3’) | Annealing temperature (℃) | Fragment size |
| A locus | F:GGTGGGTGTGGGGAATGTGCT R:CCGGCTTTGCTCTTAACTCT | 61.9 | 203bp |
| B locus | F:AAACCCACTCCATTGTGC R:CACTACTTGGCTCCTCTAGTT | 57.2 | 236bp |
Table II. Polymorphism of myog gene in meat quail.
| Polymorphism | A locus | B locus | |||
| French giant quail | Savimit quail | French giant quail | Savimit quail | ||
| Genotype frequency | AA | 0.367 | 0.083 | 1 | 0.250 |
| BB | 0.531 | 0.750 | 0 | 0.389 | |
| AB | 0.102 | 0.167 | 0 | 0.361 | |
| Allele frequency | A | 0.418 | 0.167 | 1 | 0.431 |
| B | 0.582 | 0.833 | 0 | 0.569 | |
| Heterozygosity | He | 0.487 | 0.278 | 0 | 0.490 |
| Number of effective alleles | Na | 1.948 | 1.385 | 1 | 1.963 |
| Polymorphism information content | PIC | 0.368 | 0.240 | 0 | 0.370 |
Table III. Association between MyoG gene and slaughter performance of meat quails.
| Character | Genotype of locus A | Genotype of locus B | ||||
| AA | AB | BB | AA | AB | BB | |
| Weight (g) | 145.238 ±3.925a | 138.200 ±6.459a | 140.960 ±3.010a | 145.053 ±2.296a | 122.646 ±8.229b | 145.257 ±4.002a |
| Carcass weight (g) | 137.638 ±3.808a | 131.018 ±6.403a | 133.575 ±2.925a | 137.700 ±2.241a | 115.338 ±7.877b | 137.507 ±3.910a |
| Whole net carcass (g) | 99.152 ±2.840a | 95.482 ±5.018a | 97.955 ±2.448a | 100.536 ±1.829a | 81.869 ±6.139b | 102.050 ±3.180a |
| Heart weight (g) | 1.100 ±0.068a | 1.055 ±0.097a | 1.119 ±0.044a | 1.152 ±0.039a | 0.892 ±0.108a | 1.114 ±0.069a |
| Liver weight (g) | 3.871 ±0.113a | 3.427 ±0.166b | 3.598 ±0.080ab | 3.733 ±0.074a | 3.169 ±0.131b | 3.714 ±0.133a |
| Breast muscle weight (g) | 31.514 ±1.098a | 30.127 ±1.872a | 30.940 ±0.936a | 31.995 ±0.708a | 24.692 ±2.050b | 32.593 ±1.481a |
| Leg muscle weight (g) | 7.300 ±0.297a | 6.582 ±0.495a | 6.845 ±0.177a | 7.191 ±0.165a | 5.631 ±0.399b | 7.014 ±0.280a |
| Dressing percentage (%) | 94.738 ±0.179a | 94.712 ±0.272a | 94.694 ±0.150a | 94.896 ±0.120a | 93.940 ±0.223a | 94.640 ±0.319a |
| Whole net carcass rate (%) | 68.216 ±0.461a | 68.916 ±0.593a | 69.165 ±0.472a | 69.177 ±0.364a | 66.275 ±0.919a | 70.182 ±0.616a |
| Heart rate (%) | 1.114 ±0.064a | 1.100 ±0.078a | 1.151 ±0.046a | 1.152 ±0.037a | 1.105 ±0.140a | 1.092 ±0.060a |
| Liver rate (%) | 3.942 ±0.121a | 3.639 ±0.179a | 3.786 ±0.119a | 3.775 ±0.098a | 4.074 ±0.272a | 3.682 ±0.161a |
| Breast muscle rate (%) | 31.688 ±0.413a | 31.492 ±0.666a | 31.390 ±0.362a | 31.735 ±0.294a | 29.976 ±0.664a | 31.802 ±0.718a |
| Leg muscle rate (%) | 14.720 ±0.443a | 13.721 ±0.598a | 14.077 ±0.224a | 14.345 ±0.244a | 13.974 ±0.546a | 13.746 ±0.335a |
Note: There are significant differences between the lower-case letters in the table (P < 0.05) and no significant differences between the same letters (P > 0.05).
Bhuiyan et al. (2009) discovered that C1111G mutation in MyoG gene of castle is significantly correlated with weight of living body (P<0.05). Jiusheng et al. (2009) reported that polymorphism of MyoG was significantly correlated with cross sectional area of psoas and water-holding capacity of Jinhua×Meishan pigs(P<0.05). Peng et al. (2007) studied influences of MyoG on some production traits of filial generation of Hubei white pigs, finding two genotypes (AA and AB). These two genotypes had no significant impacts on production traits, such as meat percentage and fat contents in muscles (P >0.05).
For correlation between MyoG polymorphism and production traits of poultries, Wang et al. (2007) discussed correlation of MyoG polymorphism with slaughter traits and meat quality of broiler chicken, finding significantly positive correlation between MyoG and muscle fiber growth of chicken (P < 0.05). Zhao et al. (2016) concluded that two mutations of MyoG could influence breast muscle rate, weight and carcass net weight of duck significantly (P < 0.05). Wei et al. (2014) analyzed correlation between MyoG and slaughter performance of Bian chicken, and recognized two same sense mutation sites on MyoG, polymorphism of these two mutation sites is correlated with slaughter performance of Bian chicken (P < 0.05), expressions of MyoG in breast muscle are far higher than that in leg muscle.This study shows that locus A in the control region of MyoG 5’ has a significant correlation with liver weight of meat quail (P<0.05), locus B is significantly correlated with weight, carcass weight, carcass net weight, liver weight, breast muscle weight and leg muscle weight (P<0.05). These conclusions are similar to those of Zhao et al. (2016) and Wei et al. (2014). To sum up, loci A and B in the control region of MyoG 5’ can be applied as molecular marker of slaughter performance of meat quail during marker assisted selection.
Acknowledgements
Sincere gratitude goes to the sponsor of National Natural Science Foundation (31201777) and Industry-University-Research Cooperation Project in Henan Province (152107000095.0).
Statement of conflict of interest
The authors have declared no conflict of interest.
Figures
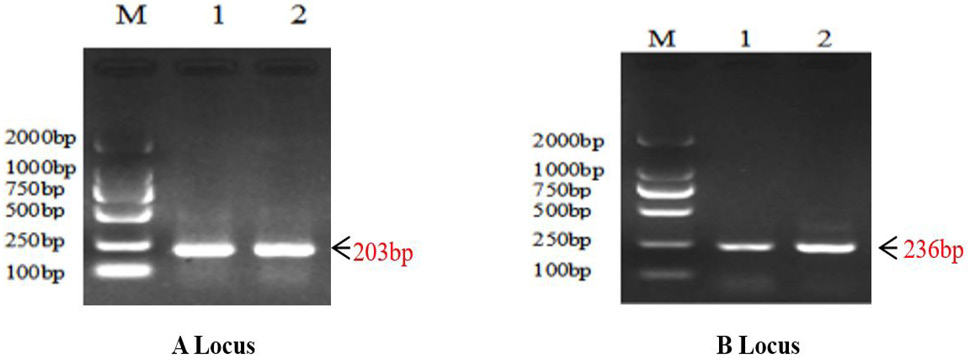
Agar detection of MyoG gene.
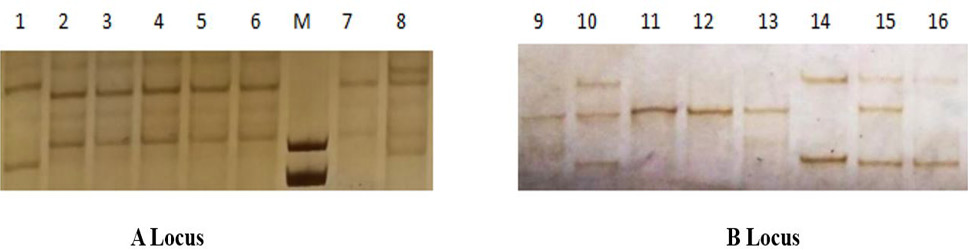
SSCP results of MyoG gene.
References
- Bai, J.Y., Pang, Y.Z., Qi, Y.X., Zhang, X.H. and Yun, Y.X., 2017. Indian J. Anim. Res., 51: 851-855.
- Bai, J.Y., Pang, Y.Z., Zhang, X.H., Yun, Y.X. and Qi, Y.X., 2016a. Brazilian J. Poult. Sci., 18: 519-524. https://doi.org/10.1590/1806-9061-2015-0101[CrossRef]
- Bai, J.Y., Pang, Y.Z., Qi, Y.X., Zhang, X.H. and Yun, X.Y., 2016b. Brazilian J. Poult. Sci., 18: 027-032. https://doi.org/10.1590/1806-9061-2015-0124[CrossRef]
- Bai, J.Y., Yang, S., Pang, Y.Z., Wu, X.H. and Li, G.L., 2019. Pakistan J. Zool., 51: 1663-1666. https://doi.org/10.17582/journal.pjz/2019.51.5.1663.1666[Full text][CrossRef]
- Bai, J.Y., Cao, H., Yang, S., Pang, Y.Z., Jiang, M.J., Fan, H.D., Fu, X.Y., Zhang, J.Y. and Shi, H.J., 2020. Indian J. Anim. Res., 54: 392-395.
- Bhuiyan, M.S.A., Kim, N.K., Cho, Y.M., Yoon, D., Kim, K.D., Jeon, J.T. and Lee, J.H., 2009. Livest. Prod. Sci., 126: 292-297. https://doi.org/10.1016/j.livsci.2009.05.019[CrossRef]
- Biressi, S., Bjornson, C.R.R., Carlig, P.M.M., Nishijo, K., Keller, C. and Rando, T.A., 2013. Devel. Biol., 379: 195-207. https://doi.org/10.1016/j.ydbio.2013.04.021[CrossRef]
- Hasty, P., Bradley, A. and Morris, J., 1993. Nature, 364: 501-506. https://doi.org/10.1038/364501a0[CrossRef]
- Jiusheng, W., Yuehuan, L. and Ningying, X., 2009. Meat Sci., 81: 108-115. https://doi.org/10.1016/j.meatsci.2008.07.010[CrossRef]
- Knapp, J., Davie, J., Myer, A., Meadows, E., Olson, E.N. and Klein, W.H., 2006. Development, 133: 601- 610. https://doi.org/10.1242/dev.02249[CrossRef]
- Li, Y.X., Zhang, X.H., Pang, Y.Z., Qi, Y.X. and Zhao, S.J., 2019. J. Poult. Sci., 56: 84-90. https://doi.org/10.2141/jpsa.0180058[CrossRef]
- Peng, X.W., Mei, S.Q., Sun, H., Li, L.H., Song, Z.X., Cheng, N., Huan, S., Guo, W.Z., 2007. J. Huazhong agric. Univ., 26: 809-812.
- Tang, Y., Wang, J.Y., Zhang, G.X., Shi, H.Q. and Zhang, T., 2013. Chinese J. Anim. Sci., 49: 5-8.
- Wang, Q., Liu, Y.P., Jiang, X.S., Yang, C.W., Du, H.R., Qiu, M.H. and Zhu, Q., 2007. Hereditas., 29: 1089- 1096.
- Wei, Y., Zhang, G.X., Wang, J.Y., Zhang, T., Tang, Y., Fan, Q.C., Xue, Q., Wang, Y.N., Ding, F.X., 2014. Chinese J. Anim. Sci., 50: 1-5.
- Zhang, X.H., Pang, Y.Z., Zhao, S.J., Xu, H.W., Li, Y.L., Xu, Y., Guo, Z. and Wang, D.D., 2013. Br. Poult. Sci.,54: 306-311.
- Zhao, Z.h., Li, H., Yi, H.J., Yang, S.L., Peng, B.X. and Bu, X.Y., 2016. Scient. Agric. Sin., 49: 3649-3661.
Services
Article usage statistics
Loading…