

Morphological Indices and Simple Regression to Predict Live Body Weight from Morphological Traits of Indigenous Sheep


Morphological Indices and Simple Regression to Predict Live Body Weight from Morphological Traits of Indigenous Sheep
Muhammad Arsalan1, Muhammad Aman Ullah1 and Abdul Waheed2,*
1Department of Statistics, Bahauddin Zakariya University, Multan
2Department of Livestock and Poultry Production, Bahauddin Zakariya University, Multan
ABSTRACT
The data on 14 morphological trait measurements were obtained from 291 indigenous sheep found in the southern Punjab of Pakistan. Ten various body indices were obtained from 14 morphological traits. Pearson correlations between live body weight and 13 other morphological traits obtained to analyze the nature and strength of the relationship. Simple regression models were fitted to predict live body weight from 13 other morphological traits as independent variables. Descriptive statistics of body indices and morphological traits were also reported. The variation pattern was observed by coefficient of variation in both body indices and morphological traits. In body indices less variation was observed in BeronCrevit index, having a smallest coefficient variation of 8.50% and high variation in Area Index having largest coefficient of variation 23.98%. Similarly, in morphological traits less variation was observed in ear length, which had the smallest coefficient variation of 3.3%. The high variation pattern was observed in head width and percent weight, having the two largest coefficients of variations being 28.5% and 28.2%, respectively. As there was high Pearson correlation between live weight and barrel depth, the best regression model was on barrel depth with a high R2 of 0.938. The simple regression analysis shows that barrel depth is best predictor of live body weight.
Article Information
Received 26 February 2019
Revised 12 May 2019
Accepted 27 June 2020
Available online 24 March 2021
(early access)
Published 24 December 2021
Authors’ Contributions
MA conducted research. MAU supervised the research. AW analyzed the data. AF wrote the article.
Key words
Body indices, Coefficient of variation, Morphological traits, Biometry, Sheep.
DOI: https://dx.doi.org/10.17582/journal.pjz/20190226030231
* Corresponding author: [email protected]
0030-9923/2022/0001-0483 $ 9.00/0
Copyright 2022 Zoological Society of Pakistan
The indigenous sheep are commonly found in southern Punjab, Pakistan. These are reared under semi intensive conditions like grazing on casual places like barren lands and besides the road sides. The sheep farming is the hobby of farmers as it is major source of food and income to them. Indigenous sheep farming is very common in southern Punjab villages. The major contribution of sheep is meet and wool. It is interesting factor to have an idea about its live weight for slaughtering purpose.
To predict the live weight, the good indicators are different body indices. The body structure indices are developed on the basis of morphological traits. Various body indices indicate the different aspects of the animals. Banerjee (2016) described that body structural indices indicate variation in traits across sex, age group and locations in Garole sheep. Body indices are helpful to get good idea about the body weight of sheep for meet purpose because in local goat market the trading of animal is based upon its live body weight. Butchers also purchase the animal on the basis of live weight of animal. The body indices are not only important for meat purposes but also for leather size prediction. The idea of body indices was strengthened by Hall (1991), Salako (2006), Shawn et al. (2016) and Moutchou et al. (2017) by developing a set of utility indices that were designed to predict various butchering and transport decisions generally as well as to mediate the economic goals like processing and storage etc. Hence, the current study was undertaken under the above scenarios.
Materials and methods
Data was collected from various livestock farms of southern Punjab. The measurements about fourteen morphological traits (body dimensions) were taken by inch tape and long scale. These measurements were taken from 291 indigenous sheep up to 2 years of age. The measurement accuracy was achieved by controlling the movement of sheep by making strong grip on them with the help of farm workers. The following morphological traits were measured: barrel depth, body length, body weight, ear length, ear width, head length, head width, heart girth, neck length, neck width, rump length, rump width, tail length and withers height. Many of these traits were also used in calculation of body indices by McManus et al. (2008), Pesmen et al. (2008), Chacon et al. (2011), Banerjee (2016), Moutchou et al. (2017), Dauda (2018) and Olaniyi et al. (2018).
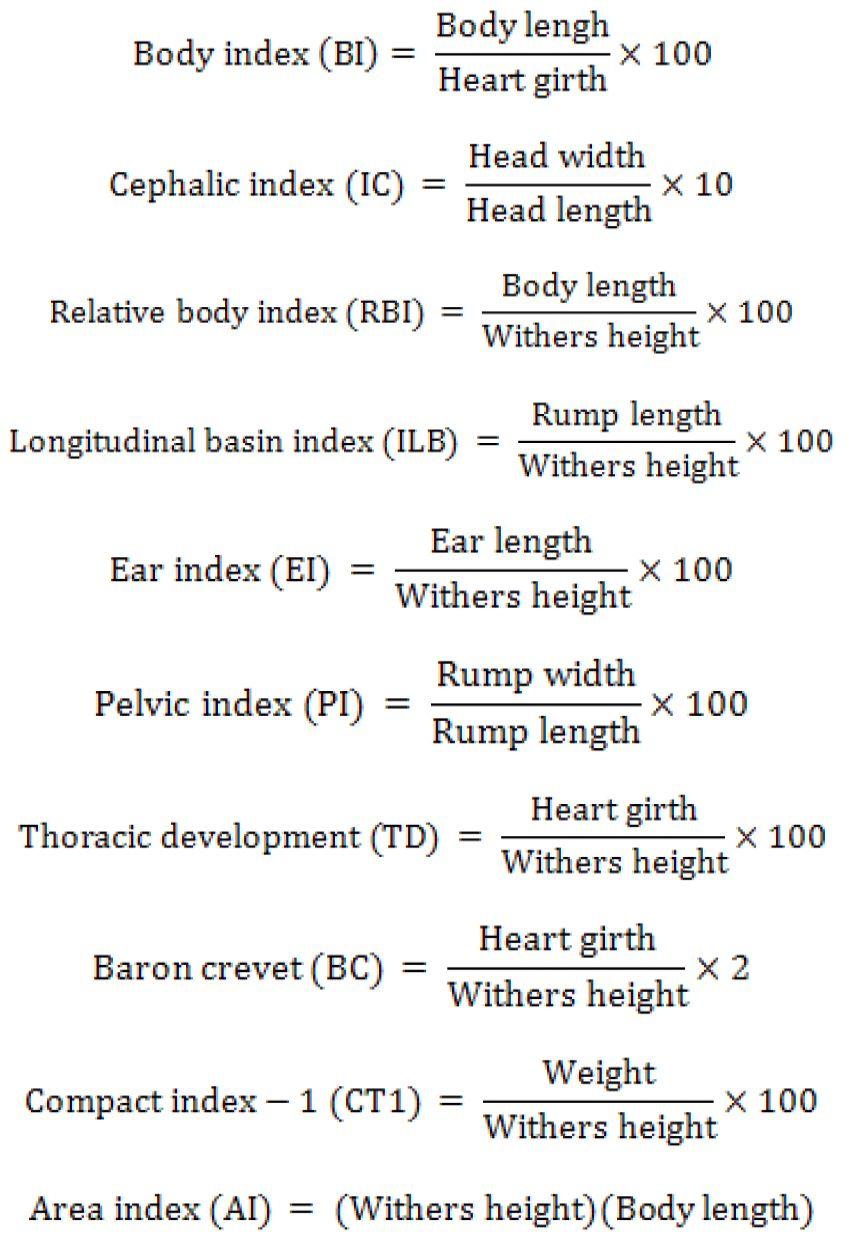
The following ten body indices were used on the basis of above morphological traits:
The descriptive statistical measures were used for morphological traits as well as indices to observe the variation pattern. Pearson correlations were used to check the nature and strength of relationship between body weight and other measurements. On the basis of Pearson correlations, the simple regression models were obtained to predict the body weight from morphological traits individually. To find the results two software i.e. Excel and SPSS (2008) were used.
Results and discussion
Table I shows relatively small variation in ear length, neck length, ear width, neck width and tail length as compared to other traits and relatively greater variation was present in barrel depth, body weight, head length, head width, rump length and rump width. The smaller value of coefficient of variation showed that there is homogeneity in the traits while larger value of coefficient of variation showed that sheep differ greatly in respect of those morphological traits. Our results showed that there is greater variation is those traits that apparently seem different and smaller variation in those traits that apparently seem similar. Similarly, descriptive measures of body indices are given in Table II. The values of coefficient of variation showed that the body index, thoracic development and beron crevit are more consistent indices as their values of coefficient of variations are relatively small than other indices. While the compact index-1 and area index had large values of coefficient of variation relatively and are less consistent.
Table I.- Descriptive statistics of morphological traits (n = 291).
|
Variables |
Mean ± SEM (Range) |
C.V. (%) |
|
Barrel depth |
39.92 ± 0.46 (21.59 – 54.61) |
19.6 |
|
Body length |
55.55 ± 0.46 (38.10 – 70.34) |
14.1 |
|
Body weight |
29.30 ± 0.48 (7.86 – 36.93) |
28.2 |
|
Ear length |
12.72 ± 0.02 (12.23 – 13.78) |
3.3 |
|
Ear width |
6.53 ± 0.02 (4.55 – 7.00) |
5.5 |
|
Head length |
23.47 ± 0.31 (13.55 – 32.64) |
22.2 |
|
Head width |
9.08 ± 0.15 (2.00 – 13.93) |
28.5 |
|
Heart girth |
56.24 ± 0.42 (39.50 – 68.39) |
12.7 |
|
Neck length |
15.21 ± 0.05 (10.45 – 20.00) |
5.1 |
|
Neck width |
13.40 ± 0.08 (8.74 – 15.55) |
9.6 |
|
Rump length |
12.25 ± 0.15 (6.10 – 17.48) |
21.5 |
|
Rump width |
15.08 ± 0.25 (7.09 – 23.85) |
27.7 |
|
Tail length |
23.28 ± 0.10 (15.21 – 26.90) |
7.6 |
|
Withers height |
56.58 ± 0.43 (41.43 – 68.94) |
12.9 |
Table II.- Descriptive statistics of body indices (n=291).
|
Body indices |
Mean ± SE (Range) |
C.V. (%) |
|
Body index |
99.05 ± 0.56 (72.20 – 138.70) |
9.73 |
|
Cephelic index |
38.39 ± 0.31 (7.30 – 51.90) |
13.86 |
|
Pelvic index |
122.15 ± 0.93 (87.50 – 184.90) |
12.98 |
|
Length index |
98.69 ± 0.67 (71.00 – 131.60) |
11.63 |
|
Long besin index |
21.56 ± 0.20 (11.80 – 31.20) |
15.49 |
|
Ear index |
22.84 ± 0.17 (18.70 – 30.00) |
12.48 |
|
Thoracic development |
99.80 ± 0.51 (77.40 – 127.40) |
8.69 |
|
Beron crevit |
2.00 ± 0.01 (1.55 – 2.55) |
8.50 |
|
Compact index-1 |
51.08 ± 0.64 (16.20 – 67.30) |
21.53 |
|
Area index |
3181.5 ± 44.72 (1592.6 – 4781.7) |
23.98 |
Table III.- Correlations and regression coefficients, their significance and confidence intervals of regression coefficients in simple regression.
|
Independent variables |
Person correlations |
Intercept |
Slope |
F-statistic |
Model statistic (R2) |
||||||
|
Value (r) |
Value (r) |
Beta |
Sig. |
CI |
Beta |
Sig. |
CI |
Value |
Sig. |
||
|
Heart girth |
0.925 |
0.000 |
-30.87 |
0.000 |
(-33.76, -27.98) |
1.07 |
0.000 |
(1.02, 1.12) |
1703.7 |
0.000 |
0.855 |
|
Body length |
0.770 |
0.000 |
-15.84 |
0.000 |
(-20.21, -11.47) |
0.81 |
0.000 |
(0.74, 0.89) |
421.04 |
0.000 |
0.593 |
|
Withers height |
0.796 |
0.000 |
-21.88 |
0.000 |
(-26.42, -17.33) |
0.90 |
0.000 |
(0.82, 0.98) |
499.54 |
0.000 |
0.633 |
|
Head length |
0.924 |
0.000 |
-5.12 |
0.000 |
(-6.80, -3.43) |
1.47 |
0.000 |
(1.40, 1.54) |
1697.0 |
0.000 |
0.855 |
|
Head width |
0.874 |
0.000 |
3.92 |
0.000 |
(2.24, 5.62) |
2.79 |
0.000 |
(2.62, 2.97) |
938.89 |
0.000 |
0.765 |
|
Ear length |
0.599 |
0.000 |
-119.55 |
0.000 |
(-142.61, -96.49) |
11.7 |
0.000 |
(9.89, 13.51) |
161.61 |
0.000 |
0.359 |
|
Ear width |
0.431 |
0.000 |
-34.52 |
0.000 |
(-50.02, -19.03) |
9.78 |
0.000 |
(7.41, 12.15) |
65.92 |
0.000 |
0.186 |
|
Neck length |
0.337 |
0.000 |
-25.01 |
0.005 |
(-42.57, -7.48) |
3.57 |
0.000 |
(2.42, 4.72) |
37.145 |
0.000 |
0.114 |
|
Neck width |
0.577 |
0.000 |
-20.14 |
0.000 |
(-28.27, -12.00) |
3.69 |
0.000 |
(3.09, 4.30) |
144.37 |
0.000 |
0.333 |
|
Tail length |
0.570 |
0.000 |
-32.23 |
0.000 |
(-42.53, -21.94) |
2.64 |
0.000 |
(2.20, 3.08) |
139.14 |
0.000 |
0.325 |
|
Rump length |
0.909 |
0.000 |
-5.72 |
0.000 |
(-7.62, -3.81) |
2.86 |
0.000 |
(2.71, 3.01) |
1369.0 |
0.000 |
0.826 |
|
Rump width |
0.936 |
0.000 |
1.38 |
0.031 |
(0.12, 2.64) |
1.85 |
0.000 |
(1.77, 1.93) |
2056.0 |
0.000 |
0.877 |
|
Barrel depth |
0.968 |
0.000 |
-11.46 |
0.000 |
(-12.70, -10.22) |
1.02 |
0.000 |
(0.99, 1.05) |
4350.0 |
0.000 |
0.938 |
Pearson correlations between body weight and other morphological traits are shown in Table III. We see that almost all the correlations of morphological traits with body weight are strong except ear width and neck length. Even these two correlation values are small but highly significant. The highest correlation was reported of barrel depth, head length, head width, heart girth, rump length and rump width with body weight having all correlations values greater than 0.90. All significant correlations showed that all morphological traits are significant component of body weight. The highest correlations suggested the simple linear regression model.
The simple linear regressions for each morphological trait were fitted and results are shown in Table III. The significance and 95% confidence interval regression coefficients (β’s) were also reported in the table. To check the significance of simple linear regression, model the values of F-statistic along with its significance values were reported in the table. The values goodness of fit, for simple linear regression model, statistic i.e. coefficient of determination (R2) were also reported in the table. Also, the Pearson correlations were reported along with simple linear regression results for comparison of Pearson correlations and coefficient of determination. The results showed that all the regression coefficients (β’s) were significant and all regressions were significant. The values of coefficient of determination are high except ear length, ear width, neck length, neck width and tail length. The small values of R2 showed these morphological traits are not good predictors as compared to those having high values of R2. The values are Pearson correlations and R2 having same pattern. Both were highest and lowest for same trait. The simple linear regression results showed that body weight could be predicted from all morphological traits.
Conclusion
The analysis finding showed that all morphological traits were consistent having smaller values of coefficient of variation except body weight, head length, head width and rump width. Similarly, all body indices were found to be consistent having smaller values of coefficient of variations except compact index-1 and area index. All the morphological traits were highly correlated with body weight as their correlations were highly significant but the barrel depth was highly correlated with body weight having correlation value 0.968. Simple regressions of all morphological traits were best fit as all regressions R2 were high but for the barrel depth R2 is highest which showed that the barrel depth was significant predictor of body weight as compared to other morphological traits.
Acknowledgement
Special thanks to the management of Government Livestock Experiment Stations, Livestock and Dairy Development Department, Govt. of Punjab.
Statement of conflict of interest
The authors declare no conflict of interest.
References
Banerjee, S., 2016. Proc. zool. Soc., 70: 61-73. https://doi.org/10.1007/s12595-015-0162-7
Chacon, E., Macedo, F., Velazquez, F., Paiva, S.R., Pineda, E. and McManus C., 2011. R. Brasil. Zootec., 40: 1671-1679. https://doi.org/10.1590/S1516-35982011000800007
Dauda, A., 2018. J. Pes. Rep. Genet., 2: 3.
Hall, S.J.G., 1991. Anim. Prod., 53: 61-69. https://doi.org/10.1017/S0003356100005985
McManus, C.M., Santos, S.A., Silva, J.A.D., Louvandini, H., Abreu, U.G.P.D., Sereno, J.R.B. and Mariante, A.D.S., 2008. Braz. J. Vet. Res. Anim. Sci., 45: 362-370. https://doi.org/10.11606/issn.1678-4456.bjvras.2008.26677
Moutchou, N.E., Gonzalez, A.M., Chentouf, M., Lairini, K. and Rodero, E., 2017. J. Livest. Sci. Technol., 5: 33-41.
Olaniyi, T.A., Popoola, M.A., Faniyi, T.O. and Iniobong, U., 2018. J. Anim. Sci. Vet. Med., 3: 1-5. https://doi.org/10.31248/JASVM2017.078
Pesmen, G. and Yardimci, M., 2008. Arch. Zootec., 11: 30-40.
Salako, A.E., 2006. Int. J. Morphol., 24: 13-18. https://doi.org/10.4067/S0717-95022006000500009
Shawn, M.W., Raubenbeimer, D. and Simpson, S.J., 2016. Funct. Ecol., 30: 108-115. https://doi.org/10.1111/1365-2435.12460
SPSS, 2008. SPSS statistics for Windows, Version 17.0, released 2008. SPSS Inc., Chicago, IL, USA.
To share on other social networks, click on any share button. What are these?


