

Using Sleep Monitoring System for Estimating and Analysing the Sleep Stages


Using Sleep Monitoring System for Estimating and Analysing the Sleep Stages
Yuzhou Luo1, Ping Wang1, Kaijun Yu2*, Song Luo3 and Longjie Sun4
1Business School, Guilin University of Technology, Guilin, China
2Library, Shanghai University of Medicine and Health Sciences, Shanghai, China
3Department of Equipment, The Affiliated Hospital of Guizhou Medical University, Guiyang, China
4Faculty of Foreign Languages, Shanghai University of Medicine and Health Sciences, Shanghai, China
ABSTRACT
In this work, the sleep stages discrimination by breath sounds have been used as characteristic parameters for monitoring sleeping condition. Our objective was to determine and verify a high performance algorithm to correlate the sleep stages with respective stages of breath sound signals. The algorithm was designed for breath sound signals and was tested with several all-night days data acquired with our laboratory-made sleep monitoring system. Furthermore, a commercial system was compared for validating the efficiency of our proposed algorithm. This work is the first study that successfully used breath sounds to classify sleeping conditions. The experiment validates the effectiveness of the proposed algorithm.
Article Information
Received 07 April 2020
Revised 01 June 2020
Accepted 12 June 2020
Available online 15 October 2021
Authors’ Contribution
YL and PW performed the
experimental work and wrote the
article. KY and SL helped in data
processing. LS helped in paper
writing.
Key words
Sleep stages, Breath sound, Monitoring system
DOI: https://dx.doi.org/10.17582/journal.pjz/20200407190434
* Corresponding author: yuhealth@126.com
0030-9923/2021/0006-2491 $ 9.00/0
Copyright 2021 Zoological Society of Pakistan
One of the main important markers of sleep quality is the sleep efficiency. This marker is useful to evaluate the type of sleeper subject as normal or insomniac, which is calculated by estimation of ratio of sleep times over total sleep spent in bed during a sleep recording. The method detects sleep stages and wake stages in the night recording.
Many researchers were interested in developing automatic sleep staging systems using EEG, EOG and EMG (Šušmáková and Krakovská, 2008). Although high performance can be reached with such methods, it cannot be used for in-home systems. In fact EEG, EOG and EMG recordings require special instrumentation and acquisition settings. Indeed for EEG acquisition correct placement of electrodes is essential. Although several researchers (Telser et al., 2004; Bunde et al., 2000) have proposed many approaches for sleep stages evaluation, a simple method being proposed here for sleep stages discrimination using breath sounds will be easier to implement for in-home and portable systems. This will greatly help improving health quality assessment.
Materials and methods
The original breath sound signal is recorded by sleep monitoring system developed previously with 20kHz or 40 kHz sampling frequency (Redmond and Heneghan, 2006).
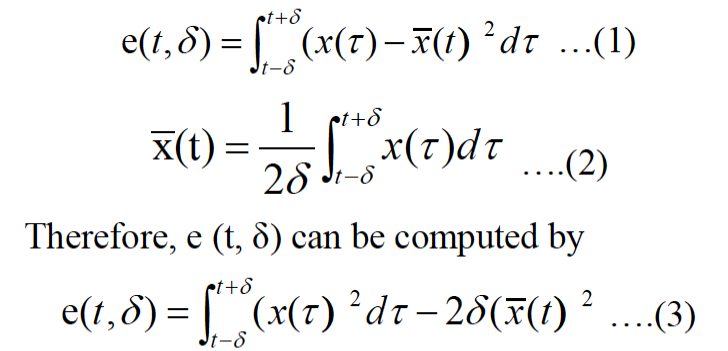
The resultant signals can be expressed as s(t). We set a signal s(t), the random noise signal as n(t), and the output signal as x(t)=s(t)+n(t). It is easy to express their variances by σ2(x)=σ2(s)+σ2(n), Where σ (·) denotes as the variance of a signal. The output signal σ2 (s) is defined as envelope waveform of breath sound signal, here we assume σ2 (n) is only an unknown constant, and the mean is 0, and variance is 1. Therefore, output signal can be viewed as σ2 (x). The envelop waveform of the breath sound signal is denoted as e (t, σ), which is defined as the variance signal of actual output signal x (t) and expressed as e (t, σ) =σ2 (x) , Where δ is neighborhood of time t, called the width δ time scale (Redmond and Heneghan, 2006; Bunde et al., 2000).
Breath characteristic parameters have three parameters: Breath peak, respiratory variance and respiratory period.
Breath sound peak amplitude is calculated by equation 4:
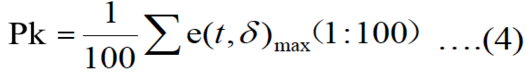
In our experiment, hamming window is applied in every frame, t is 10s, window is 10s, there is 25% overlap of the frame size, is the sum of 100 points of maxim amplitude in a time of window.
Respiratory variance which is correlated to apnea, wake, REM and so on is calculated by equation 5:
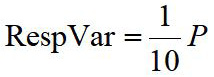 …(
…(P is the amount of points which amplitude is five multiple of the mean value of feature waveform amplitude in 10s.
Respiratory period value calculated by equation 6 is correlated with the time of expiration and inspiration. Applying FFT to breath sounds waveform e (t, δ) in 10 s, defined the reciprocal of peak frequency band is respiratory period.
Resp = 1 / f ......(6)
In order to evaluate the degree of breath, then proposed a new characteristic parameter RespR. The number of exhale and inhale in one minute is defined RespR which is calculated by equation 7:
RespR = 60 / Resp ......(7)
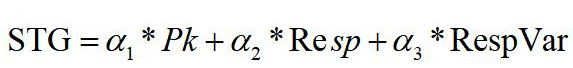
Sleep stage analysis algorithm is used to classify sleep stage. Sleep state in all-night can be descried by breath characteristic parameters. For the sake of accuracy, stage value is calculated by equation 8,
 …(
…(The initial values are defined by comparing sleep stages measured by SleepScan which is a mat placed under bedding to monitor sleep patterns. The device uses a vibration microphone to sense body motion, heart rate and breathing patterns, and then stores that information on an SD card. The data in the PC with accompanying software will display the user’s sleep patterns in easy-to-understand graphs (Zoubek et al., 2007).
The initial value according to the empirical testing on several selected subjects we defined is 0.04, 0.65, 0.01, value of STG are expressing deep sleep (STG <=1.45), wake (STG >=3.8), REM (STG >2.8 and STG <3.8), shallow sleep (STG >1.45 and STG <2.8). At the same time, same parameters were applied to all data for one subject. For application of proposed method, experiments involved use of our proposed sleeping condition monitoring system on subjects and measurement taken by SleepScan, simultaneously. All-night sleep stage evaluated by our algorithm and all-night sleep stage measured by SleepScan are shown in Figure 1 on date 1107.
Results and discussion
Table I shows the performance results of our method and those measured by SleepScan. REM is the state of rapid eyes movement while SleepScan is measured by vibration sensor. Since it is difficult to divide REM to shallow exactly except using PSG, so, combined REM and shallow has been considered.
Our algorithm reliability with SleepScan was assessed by the detection error rate De as follows:
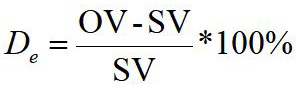 ….(9)
….(9)
Where OV is the value of our method detection, SV is the value of SleepScan detection, used in Table I. The detection error De expresses the accuracy of the algorithm compared with SleepScan. Table II shows the result of De.
Sleep EEG signals do not include the same number of samples for each of the six sleep modes. In fact, the number of periods distributed in different sleep modes is very unstable. In this work, the algorithm combining extracting breath sound characteristic parameters features was developed. The algorithm’s performance was evaluated both for 6 all-nights total about 35 h data acquired using our self-made system and Sleep Scan. The sleeping condition discrimination was fulfilled by a classification method where several features are extracted from the breath characteristic parameters. On the other hand, we notice that the main purpose of this work which is the sleep stages estimation was accurately done. Actually, we can see from the detailed results in Table II that the low value detection error De expresses the accuracy of the algorithm compared with Sleep Scan have a good performance.
Table I. The performance results of our method (combined REM and shallow) and those measured by SleepScan (combined REM and shallow).
|
Date (month/day) |
Wake (%) |
REM and shallow (%) |
Deep (%) |
|
Our method |
|||
|
11/07 |
9.3 |
77.6 |
13.1 |
|
11/08 |
8.1 |
76.3 |
15.6 |
|
11/09 |
8.2 |
75.2 |
16.6 |
|
11/12 |
9.7 |
74.9 |
15.4 |
|
11/13 |
8.9 |
69.9 |
21.2 |
|
11/14 |
8.5 |
79.7 |
11.8 |
|
SleepScan |
|||
|
11/07 |
9.2 |
75.9 |
14.9 |
|
11/08 |
8 |
73.5 |
18.5 |
|
11/09 |
8.9 |
76.9 |
14.3 |
|
11/12 |
9.6 |
73.6 |
16.7 |
|
11/13 |
9.2 |
71 |
19.8 |
|
11/14 |
8.6 |
79.1 |
12.3 |
|
Date (month/day) |
De (Wake) (%) |
De (REM and shallow) (%) |
De (Deep) (%) |
|
11/07 |
1.08 |
2.24 |
12 |
|
11/08 |
1.25 |
3.8 |
20 |
|
11/09 |
-7.89 |
-2.21 |
16 |
|
11/12 |
1.04 |
1.76 |
-7.78 |
|
11/13 |
-3.26 |
-1.97 |
7.07 |
|
11/14 |
-1.16 |
0.76 |
-4.07 |
In order to investigate the stages of sleep and wakefulness, the electric activity of a large group of neurons in the cerebral cortex is being recorded. A combination of EEG, EMG, and EOG data is called a polysomnography record, which is used to define the stages of sleep and wakefulness (Xia et al., ٢٠٠٩). In polysomnography recordings, low-voltage EEG and high muscle tone are defined as wakefulness, while NREM sleep is characterized by high amplitude and low EEG frequency and decreased muscle tone. REM sleep is associated with complete loss of muscle tone and rapid eye movement (Karlsson et al., 2005). Sleep has specific behavioral characteristics in growing animals (Blumberg et al., 2005). Sleep, especially REM sleep, plays an important role in the development of the neural circuitry. In humans, the increase in EEG range in the waking stages continues into adolescence and reflects the maturation of the cerebral cortex in adults (Worley, 2018).
Various methods such as time and frequency distribution (Tsinalis et al., 2016), graph theory (Zhu et al., 2014), signal modeling (Kayikcioglu et al., 2015), wave conversion (da Silveira et al., 2017) and empirical mode analysis (Dong et al., 2010) are used to process the signals for the detection of sleep stages. Various models are also used for the classification section, which include support vector machines (Zhu et al., 2014), neural network (Tsinalis et al., 2016) and minimum of partial squares (Kayikcioglu et al., 2015). Using the power spectral density (PSD) signals, EEG signals and artificial neural networks, (Ronzhina et al., 2012) presented a single-channel EEG-based design. Lajnef et al. (2015) used a variety of features such as entropy, linear predictive error, variance, clustering, elongation, and multidimensional support vector machines on EMG, EOG, and EEG to automatically record sleep stages. Krakovská et al. (2011) extracted many features, including the mean range, variance, and spectral strength from data collected from six EEG channels, two EOG channels, and one EMG channel, using secondary criteria (Krakovská et al., 2011). Zhu et al. (2014) generated a visual graph and a horizontal graph of the single-channel EEG signal and did not use the feature to classify them using a backup vector machine. Krakovská proposed the technology-based extraction scheme of the self-return model (Krakovská et al., 2011).
The empirical mode analysis method is one of the most important methods of signal processing in the time-frequency domain that Huang et al. (1998) introduced and studied (Hassan and Bhuiyan, 2017). By applying this method, each signal is decomposed into a number of intrinsic state functions and used in the processing of nonlinear and unstable signals. One of the advantages of the state perception analysis method is the possibility of determining the instantaneous frequency of the signal by combining this method with Hilbert conversion. Although the empirical mode decomposition method is one of the most powerful signal processing methods, it has problems such as the phenomenon of mixing states and the lack of a strong stop criterion in the screening process. Flandrin et al. (2014) suggested adding white noise to solve some of the problems of empirical mode decomposition. Huang et al. (1998) introduced the empirical mode decomposition method to solve the problem of state mixing. Tsinalis et al. (2016) analyzed the frequency time to extract the property and used the accumulated automatic encryption algorithm for classification (Wu and Huang, 2009). According to previous research, most algorithms require more than one channel to automatically detect sleep stages; therefore, this is annoying for the patient and prevents the sleep monitor from being measured at home. It was also found that previous studies in the classification of different stages of sleep provided less than 90% accuracy and were complex and time-consuming in terms of computations.
Some researchers also present methods for sleep staging utilizing unobtrusive and comfortable methods. Samy et al. (2014) present a high-resolution pressure-sensitive bed sheet to extract sleep-related biophysical and geometric features for sleep staging.
An overall accuracy of 71.1% was reached for a sleep 3-stage system while including seven subjects in their study. Sensor foils placed into the bed mattress are used by Kortelainen et al. (2010) to extract relevant features and parameters for sleep staging. An overall accuracy of 79% and a Kappa of 0.44 was reached for a sleep 3-stage system while including 18 subjects in their study. These results are similar to those presented in this paper.
While offering non-contact and unobtrusive sleep staging, the main drawback of those methods are the excessive noise problems during body movements preventing reliable sleep staging. Additionally, the significance of this study may be limited by the small number of participants.
Conclusion
This research was the first attempt that used only breath sounds to identify sleeping stages. The procedure demonstrates the effectiveness of the suggested algorithm based on all-night days data acquired with our laboratory-made sleeping monitoring.
Statement of conflict of interest
The authors have declared no conflict of interest.
References
Blumberg, M.S., Seelke, A.M., Lowen, S.B. and Karlsson, K.A., 2005. Proc. natl. Acad. Sci. USA., 102: 14860-14864. https://doi.org/10.1073/pnas.0506340102
Bunde, A., Havlin, S., Kantelhardt, J.W., Penzel, T. and Peter, J-H., 2000. Phys. Rev. Lett., 85: 3736-3739. https://doi.org/10.1103/PhysRevLett.85.3736
da Silveira, T.L., Kozakevicius, A.J. and Rodrigues, C.R., 2017. Med. Boil. Eng. Comput., 55: 343-352. https://doi.org/10.1007/s11517-016-1519-4
Dong, J., Liu, D., Zhang, C., Ma, J. and Fang, J., 2010. Adv. Adapt. Data Anal., 2: 267-276. https://doi.org/10.1142/S1793536910000483
Flandrin, P., Gonçalves, P. and Rilling, G., 2014. In: Hilbert–Huang transform and its applications. World Science. pp. 99-116. https://doi.org/10.1142/9789814508247_0005
Hassan, A.R. and Bhuiyan, M.I.H., 2017. Comput. Meth. Progr. Biomed., 140: 201-210. https://doi.org/10.1016/j.cmpb.2016.12.015
Huang, N.E., Shen, Z., Long, S.R., Wu, M.C., Shih, H.H. and Zheng, Q., 1998. Proc. R. Soc. Lond. A: Math. Phys. Eng. Sci., 454: 903-995. https://doi.org/10.1098/rspa.1998.0193
Karlsson, K.A., Gall, A.J., Mohns, E.J., Seelke, A.M. and Blumberg, M.S., 2005. PLoS Biol., 3: e143. https://doi.org/10.1371/journal.pbio.0030143
Kayikcioglu, T., Maleki, M. and Eroglu, K., 2015. Expert. Syst. Appl., 42: 7825-7830. https://doi.org/10.1016/j.eswa.2015.06.010
Kortelainen, J.M., Mendez, M.O., Bianchi, A.M., Matteucci, M. and Cerutti, S., 2010. IEEE Trans. Inf. Technol. Biomed., 14: 776–785.
Krakovská, A. and Mezeiová, K., 2011. Artif. Intel. Med., 53: 25-33. https://doi.org/10.1016/j.artmed.2011.06.004
Lajnef, T., Chaibi, S., Ruby, P., Aguera, P., Eichenlaub, J., Samet, M., Kachouri, A., Jerbi K., 2015. J. Neurosci. Meth., 250: 94-105. https://doi.org/10.1016/j.jneumeth.2015.01.022
Redmond, S.J. and Heneghan, C., 2006. IEEE Trans. Biomed. Eng., 53: 485-496. https://doi.org/10.1109/TBME.2005.869773
Ronzhina, M., Janouek, O., Kolrov, J., Novkov, M., Honzk, P. and Provaznk, I., 2012. Sleep Med. Rev., 16: 251–263. https://doi.org/10.1016/j.smrv.2011.06.003
Samy, L., Huang, M.C., Liu, J.J., Xu, W. and Sarrafzadeh, M., 2014. IEEE Sensors J., 14: 2092–2101. https://doi.org/10.1109/JSEN.2013.2293917
Šušmáková, K. and Krakovská A., 2008. Intellig. Med., 44: 261-277. https://doi.org/10.1016/j.artmed.2008.07.005
Telser, S., Staudacher, M., Ploner, Y., Amann, A. and Hinterhuber, H., 2004. Somnologie, 8: 33-41. https://doi.org/10.1111/j.1439-054X.2004.00016.x
Tsinalis, O., Matthews, P.M. and Guo, Y., 2016. Annls biomed. Eng., 44: 1587-1597.
Worley, S.L., 2018. Pharm. Ther., 43: 758.
Wu, Z. and Huang, N.E., 2009. Adv. Adapt. Data Anal., 1: 1-41. https://doi.org/10.1142/S1793536909000047
Xia, J., Chen, F., Ye, J., Yan, J., Wang, H. and Duan, S., 2009. Neuroscience, 162: 980–988. https://doi.org/10.1016/j.neuroscience.2009.05.033
Zhu, G., Li, Y. and Wen, P.P., 2014. IEEE J. Biomed.Hlth., 806: 803.
Zoubek, L., Charbonnier, S., Lesecq, S., Buguet, A., Chapotot, F., 2007. J. Biomed. Signal Process., 2: 171-179. https://doi.org/10.1016/j.bspc.2007.05.005
To share on other social networks, click on any share button. What are these?


