Submit or Track your Manuscript LOG-IN

Transcriptomic Comparative Analysis of Two Breeds of Mongolian Sheep at 16-day Embryos

Transcriptomic Comparative Analysis of Two Breeds of Mongolian Sheep at 16-day Embryos

Hong Su1,2, Lu Chen1,3, Wenrui Guo1, Daqing Wang1,3, Aolei Dou1,2, Jie Su1, Yanyan Yang4, Ying Tian4, Tingyi He4, Caiyun Wang1, Chenguang Du1, Haijun Li1, Xihe Li5, Guifang Cao1*, Yongli Song5* and Fuxiang Bao3*

1College of Veterinary Medicine, Inner Mongolia Agricultural University, China
2Animal Embryo and Developmental Engineering Key Laboratory of Higher Education Institutions of Inner Mongolia Autonomous Region, China
3Inner Mongolia Autonomous Region Key Laboratory of Basic Veterinary Medicine, China China
4Institute of Animal Husbandry, Inner Mongolia Academy of Agriculture and Animal  Husbandry
5College of Life Sciences, Inner Mongolia University, China 
 
Hong Su, Lu Chen, and Wenrui Guo contributed equally to this work.
 
*      Corresponding author: guifangcao@126.com, songyongli625@163.com, baofuxiang@imau.edu.cn

Fig. 1.
A, Hulunbuir short-tailed sheep; B, Ujumqin sheep; C, Hulunbuir short-tailed sheep 16-day embryo, H(E16); D, Ujumqin sheep 16-day embryo, U(E16). Scale: 1000 µm.
Fig. 2.

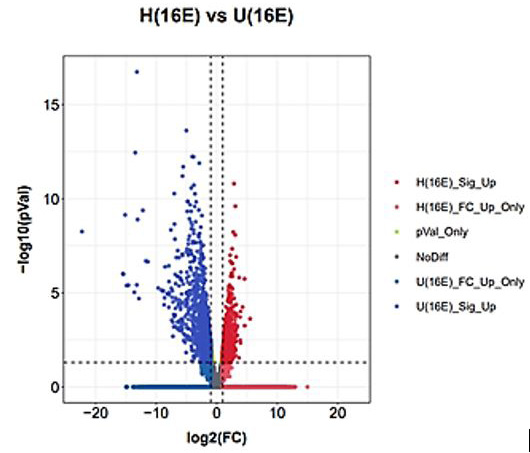
The horizontal coordinate, log2(FC), represents the fold change of expression of genes in different samples. The vertical coordinate, -log10(pVal), represents the statistical significance of the difference in gene expression. Genes down-regulated in H(E16) are described as up-regulated in U(E16).

Fig. 3.

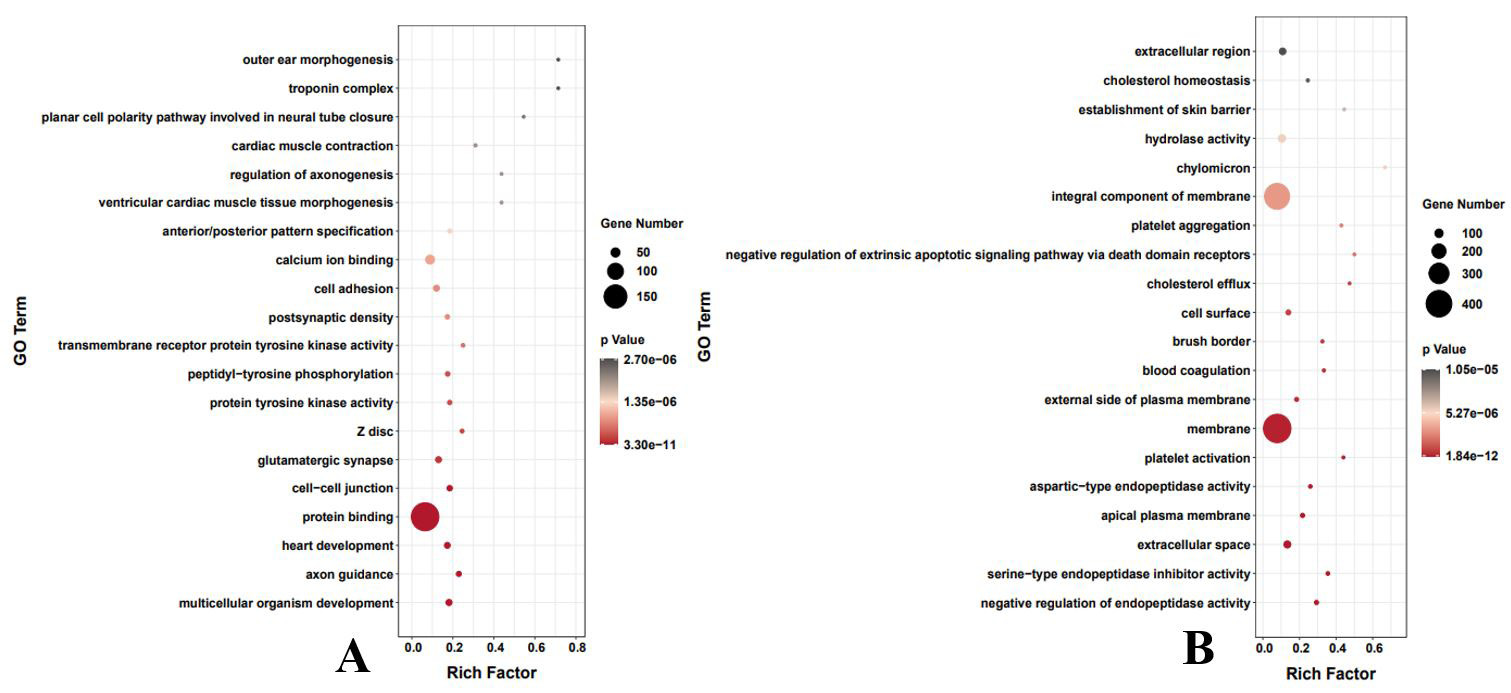
Top 20 GO terms of H(E16) (A); U(E16) (B). The horizontal coordinate Rich Factor represents the number of differential genes in the GO/total number of genes in the GO; A larger Rich factor indicates a higher degree of GO enrichment. The vertical coordinate is GO term, i.e., GO functional annotation. In the scatter plot, the size of the dots represents the number of differential genes, and the color of the dots represents the P-value of the enrichment analysis, i.e., the significance of the enrichment, with a P-value smaller than or equal to 0.05 indicating significant enrichment. The GO enrichment analysis scatter plot is based on the significance (P-value) of the enrichment of the top 20 GO terms.

Fig. 4. A:
The red node represents H(E16) 1, Dilated cardiomyopathy (DCM); 2, Axon guidance; 3, Hypertrophic cardiomyopathy (HCM); 4, Arrhythmogenic right ventricular cardiomyopathy (ARVC); 5, Cardiac muscle contraction; 6, Cell adhesion molecules (CAMs); 7, Adrenergic signaling in cardiomyocytes; 8, Glutamatergic synapse; 9, Breast cancer; 10, GABAergic synapse; 11, ECM-receptor interaction; 12, MAPK signaling pathway; 13, Basal cell carcinoma; 14, Hippo signaling pathway; 15, Morphine addiction; 16, Pathways in cancer; 17, Signaling pathways regulating pluripotency of stem cells; 18, cGMP-PKG signaling pathway; 19, Taste transduction; 20, TGF-beta signaling pathway; 21, Cholinergic synapse; 22, Nicotine addiction; 23, Rap1 signaling pathway; 24, Herpes simplex virus 1 infection; 25, Ras signaling pathway; 26, Wnt signaling pathway; 27, Cushing syndrome; 28, Central carbon metabolism in cancer; 29, Retrograde endocannabinoid signaling; 30, PI3K-Akt signaling pathway; 31, Protein digestion and absorption; 32, Oxytocin signaling pathway; 33, Vascular smooth muscle contraction; 34, Circadian entrainment; 35, cAMP signaling pathway; 36, Aldosterone synthesis and secretion; 37, Gastric cancer; 38, Calcium signaling pathway; 39, Apelin signaling pathway; 40, Melanogenesis; 41, Leukocyte transendothelial migration; 42, Focal adhesion; 43, Cortisol synthesis and secretion.
B: The blue node represents H(E16). 1, Protein digestion and absorption; 2, PPAR signaling pathway; 3, Cholesterol metabolism; 4, Platelet activation; 5, Complement and coagulation cascades; 6, Fc gamma R-mediated phagocytosis; 7, Hematopoietic cell lineage; 8, Ferroptosis; 9, Malaria; 10, Fat digestion and absorption; 11, Aldosterone-regulated sodium reabsorption; 12, p53 signaling pathway; 13, Osteoclast differentiation; 14, Epstein-Barr virus infection; 15, Proteoglycans in cancer; 16, Pantothenate and CoA biosynthesis; 17, Collecting duct acid secretion; 18, Chagas disease (American trypanosomiasis); 19, African trypanosomiasis; 20, Phagosome; 21, Chemical carcinogenesis; 22, Arachidonic acid metabolism; 23, Histidine metabolism; 24, B cell receptor signaling pathway; 25, Tyrosine metabolism; 26, Salmonella infection; 27, Lysosome; 28, Kaposi sarcoma-associated herpesvirus infection; 29, Phosphatidylinositol signaling system; 30, Regulation of actin cytoskeleton; 31, Human cytomegalovirus infection; 32, Phenylalanine metabolism; 33, Platinum drug resistance; 34, Mineral absorption; 35, NF-kappa B signaling pathway; 36, Human immunodeficiency virus 1 infection; 37, Fructose and mannose metabolism; 38, Riboflavin metabolism; 39, Drug metabolism - cytochrome P450; 40, Glutathione metabolism; 41, PI3K-Akt signaling pathway; 42, Adipocytokine signaling pathway; 43, Glioma; 44, Hepatitis B; 45, Transcriptional misregulation in cancer; 46, Glycolysis/ Gluconeogenesis; 47, AMPK signaling pathway; 48, Prolactin signaling pathway; 49, Tuberculosis; 50, Toll-like receptor signaling pathway; 51, Rheumatoid arthritis; 52, Porphyrin and chlorophyll metabolism; 53, Steroid hormone biosynthesis; 54, C-type lectin receptor signaling pathway; 55, Apoptosis; 56, Drug metabolism other enzymes; 57, Amoebiasis; 58, Jak-STAT signaling pathway; 59, Hepatitis C; 60, Endocrine resistance; 61, T cell receptor signaling pathway; 62, Bacterial invasion of epithelial cells; 63, Leukocyte transendothelial migration; 64, Viral carcinogenesis; 65, Amphetamine addiction; 66, Melanoma; 67, Natural killer cell mediated cytotoxicity; 68, Metabolism of xenobiotics by cytochrome P450. Green nodes represent specific pathways.
Fig. 5.

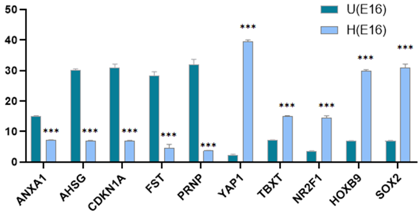
mRNA sequencing results for randomly selected ten genes. *P < 0.05, **P < 0.01, and ***P < 0.001

Pakistan Journal of Zoology

June

Pakistan J. Zool., Vol. 56, Iss. 3, pp. 1001-1500

Featuring

Click here for more

Subscribe Today

Receive free updates on new articles, opportunities and benefits


Subscribe Unsubscribe