The Effect of Selenium as a Feed Additive on Blood Parameters Antioxidant Activity in Dairy Goat: Meta-Analysis
The Effect of Selenium as a Feed Additive on Blood Parameters Antioxidant Activity in Dairy Goat: Meta-Analysis
Dwi Putri Nurmala1, Tri Eko Susilorini1, Osfar Sjofjan2*, Danung Nur Adli2
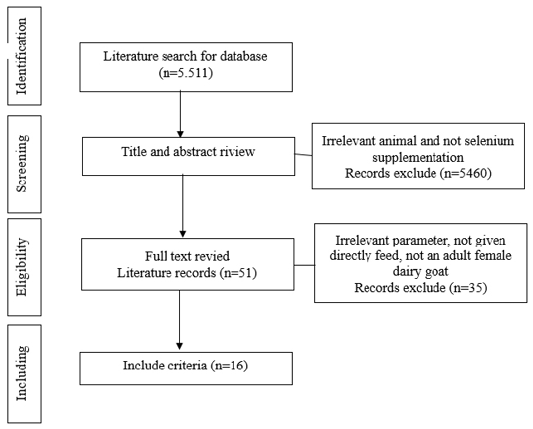
Diagram flow for study selection in meta-analysis study.
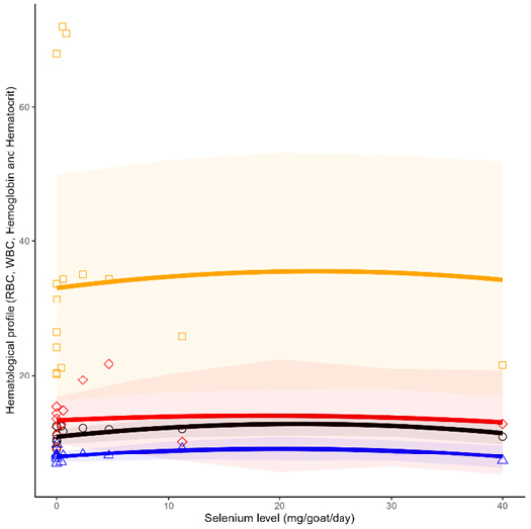
Linear regression of correlation between selenium level and RBC, WBC, hemoglobin and hematrocit (Black= RBC; red= WBC; blue= Hemoglobin, orange= Hematocrit).
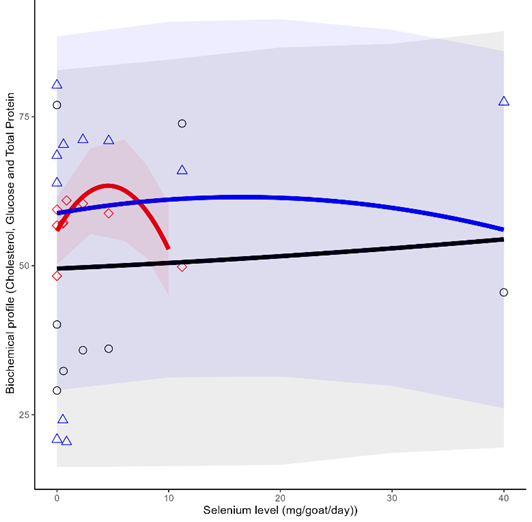
Linear regression of correlation between selenium level and cholesterol, glucose and total protein (Black= Cholesterol; red= Glucose; blue= Total Protein).
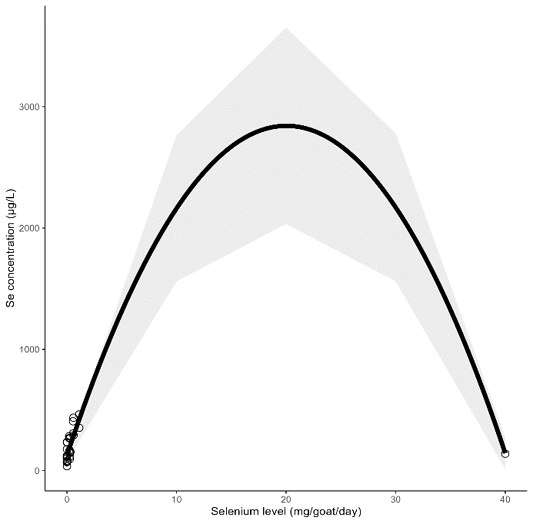
Linear regression of correlation between selenium level and se concentration.
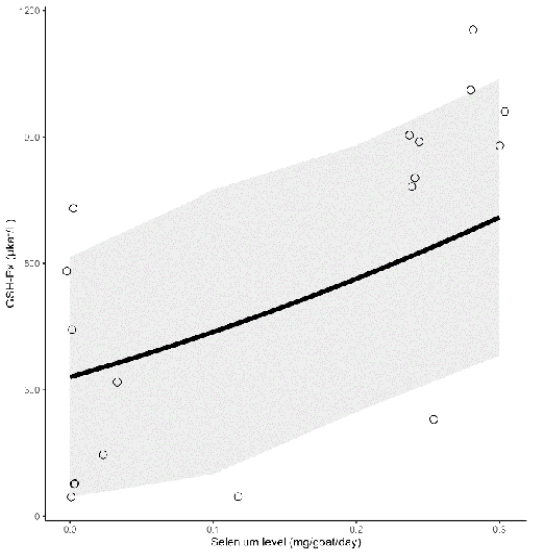
Linear regression of correlation between selenium level and GSH-Px.


