
SRTM DEM based 3-D Surface Deformation of Nanga Parbat Syntaxis through Drainage Density and Surface Roughness


Research Article
SRTM DEM based 3-D Surface Deformation of Nanga Parbat Syntaxis through Drainage Density and Surface Roughness
Muhammad Shahzad1*, Syed Amer Mahmood2, Athar Ashraf3, Amer Masood2 and Saira Batool4
1Department of Computer Science, University of the Punjab, Lahore, Pakistan; 2Department of Space Science, University of the Punjab, Lahore, Pakistan; 3Department of Data Science (PUCIT), University of the Punjab, Lahore, Pakistan; 4Center for Integrated Mountain Research (CIMR), University of the Punjab, Lahore, Pakistan.
Abstract | The Indo-Pak-Eurasia collision has caused recent fault activation and surface deformation in the Nanga Parbat Syntaxis (NPS) region. This investigation deals with the Shuttle Radar Topographic Mission Digital Elevation Model (SRTM DEM) based surface dynamic indices (drainage density-DD, topographic surface roughness-TSR) to constrain the neotectonics of Nanga Parbat Syntaxis (NPS) in Gilgit-Baltistan (Northern Pakistan). This study aims to assess the active surface deformation based on the DD and TSR techniques. These are the interrelated procedures, i.e. TSR investigation may be used to distinguish areas with low and higher DD values and their connection with the active tectonics. The three-dimensional maps for TSR and DD are generated using a moving window size of (1-4 km). TSR and DD maps show interesting results that correspond to the relative sensitivity of the landscape to regional neotectonics. DD exposed the neotectonic activity preserved in the Quaternary era in the surroundings of NPS. The TSR maps revealed that North-North-East (NNE), North-West (NW), South-West (SW) f the investigation region and segments parallel to the Sassi Raikot Fault (SRF), Sassi-Jaglot-Bunji (SJB) sector of Nanga Parbat Syntaxis as active tectonic zones. The areas which include, Shawar, Haramosh, Kachura, Astak Nala, Gilgit, Skardu, Astore, Sai Nala Jaglot, Gunar and Gorikot are highly vulnerable to active tectonic deformation. This research concludes that the TSR and DD techniques are potential markers for the demarcation of active vulnerable zones that may threaten the life lines in the socio economic context.
Received | June 02, 2021; Accepted | July 11, 2021; Published | August 02, 2021
*Correspondence | Muhammad Shahzad, Department of computer Science, University of the Punjab, Lahore, Pakistan; Email: msmughal.ier@pu.edu.pk
Citation | Shahzad, M., S.A. Mahmood, A. Ashraf, A.er Masood and S. Batool. 2021. SRTM DEM based 3-D surface deformation of nanga parbat syntaxis through drainage density and surface roughness. Sarhad Journal of Agriculture, 37(3): 1050-1061.
DOI | https://dx.doi.org/10.17582/journal.sja/2021/37.3.1050.1061
Keywords | SRTM DEM, Drainage density, Topographic surface roughness and neotectonics, Nanga Parbat
Introduction
The recent Earth’s topography is a result of the growing control of soil development, ecological, geomorphological, geological and hydrological actions. The natural landforms are diverse in terms of their distinctiveness, such as relative spatial locations, sizes, orientations, relative reliefs and shapes. These landforms are dissimilar due to their physical properties that lead to their developments which persevere their reactivation in recent times (MacMillan and Shary 2009; Mahmood and Gloaguen, 2011; Mahmood and Gloaguen, 2012). Consequently, the quantitative explanation and classification of the topography is an important part of investigating landforms. The essential assumption in geomorphometry demonstrates a correlation among topographic characteristics and associated processes (Pike, 2000; Burbank and Anderson, 2001; Keller, 1986; Keller and Pinter, 2002; Wobus, 2006; Qureshi et al., 2019; Amine et al., 2020). DEM derived datasets of morphometric indices assess this correlation, their relation to geomorphological processes, soil characteristics or the subsistence of exact landforms using geostatistical techniques (Pike, 2000; Shahzad et al., 2009; Mahmood and Glaoguen, 2011). TSR preserves important topographic information compared to other morphometric measures, as it corresponds to the texture of the topography, which is described as topographic variations in elevations (Shahzad et al., 2009; Mahmood and Gloaguen, 2011).
According to (Olaya, 2009) and (Hobson, 1972), TSR is a significant index used in the planetary and Earth sciences to distinguish distinctive landforms and computation of active deformation as a result of endogenic and exogenic agents causing. For example, TSR-age correlation was performed by (Mckean and Roering, 2004) to distinguish landslides events in different epochs, together with factorization of hydrological models for stream network. Therefore, TSR for a landform depends on the physical characteristics of the dynamic processes of the Earth surface and the time-lapse since it was created. A different implication of TSR is not possible (Hobson, 1967), as various types of investigations require different constraints. For example, TSR in the context of remote sensing may be calculated using reflection of electromagnetic radiation from Earth’s topography that ranges between specular to diffuse. In geomorphological investigations (Olaya, 2009; Pike et al., 2000; Shahzad et al., 2009; Mahmood and Gloaguen, 2011), TSR is described as topographic variations in elevation levels and is used to classify landforms over various regional and local scales. This research treats TSR as variability in topographic elevations in view of neotectonic deformation at regional or large scales, whilst the scale of study is determined by the geomorphometric features or landform size under investigation. DD provides evidence for fault activation, hydrologic information and topographic evolution that is difficult to obtain by conventional geological published maps. According to (Leeder and Jackson, 1993; Jackson and Leeder, 1994; Jackson et al., 1996, 1998; Hovius, 1996), important information of active structures is preserved in the streams network associated with neotectonics. Arithmetical simulations of stream types can provide significant imprints (Tomkin and Braun, 1999). Previous researches of spatial drainage patterns were carried out in neotectonically deformed regions that caused relative regional uplifts and subsidence (Burbank and Anderson, 2001; van der Beek et al., 2002; Delcaillau et al., 2006). The spatial locations of the drainage system are associated with minor uplifts or subsidence in the context of topographic deformation. For example, streams may be clustered, forked or fluctuate flow directions while crossing over the faults (Leeder and Jackson, 1993; Han et al., 1994; 1995; 1998). Non-tectonic agents can contribute and organize the different types of stream networks and their establishment (Ouchi, 1985; Mueller and Talling, 1997; Gupta, 1997; Pelletier, 2004; Vetel et al., 2004). As DD corresponds to a standard normal value per unit area, assigning an explicit threshold value, DD reduces the control of the non tectonic dynamics. Quantitatively, DD provides clear information regarding the distribution of spatial drainage patterns. Variations of DD values, from lower to higher can therefore be simply recognized both in numeric and map form by assigning diverse colours. The principal purpose of this study is to demarcate the spatial patterns of tectonic surface deformation including, top-hydrological factors, geological and geomorphic landforms based on the TSR and DD investigation to decode current neotectonic signs of scheming landforms developments that is not marked in published geological, geomorphological maps. Due to this rationale, we focused on NPS and its environs to differentiate the variations in surface deformation resulting from the relentless contest between hydrological factors, erosion, tectonics and climate change impact on topography in the context of ongoing collision between InoPak-Eurasian Plates (Figure 1).
Geotectonic Settings
The NPSgneisses belong to the NW of the flank of Himalayan bare rocks. They are intensely buried material underneath overriding Eurasia (Butler and Prior, 1989) as an early part of the continental collision history (Figure 2). Two different suites of meta-sediments have been documented. A chain of localized limestones, pelites, psammites and migmatised rocks has lounged inside the main body of the gneisses that demonstrate tectonic frameworks and poly-phase metamorphism (Misch, 1964).
Improbably, the high graded metamorphism Himalayas has spoiled any fossil verification to embrace this idea. The Indus Suture Zone (ISZ) and its hanging wall incorporate a complex relic arc, known as Indus Kohistan Terrane (Le Fort, 1986; Butler and Coward, 1989), which docks the Asian plate extremities in the late Cretaceous and is an associated segment of the NW wedge the Tertiary Himalayan collision. The MMT is a high-grade shear region with overriding Asia over NPS from the eastern side and on isolated segments of the west most peripheries. The past earthquake records in the NPS region show significant influence on the River Indus that exhibits enhanced variations of gradients symptomatic of neotectonic deformation (Figure 3).
Datasets and procedures
SRTM DEM (90 m) based generated stream network was used to prepare a binary digital image, and sinks were removed by DEM filling technique. The D8 script (O’Callaghan and Mark, 1984; Jenson and Domingue, 1988) computes the final flow angles at every DEM pixel with eight neighboring pixels (Figure 4). The stream network was further filtered to describe the drainage channels with a contributory area > 1 Km2 to guarantee those topographic segments where organized Stream flows take place to avoid hillslope dispersal. We used channels with Strahler order six to minimize the DEM noise. For the extraction of stream network, the threshold limit here is defined as the least amount of water needed to generate a stream and based on this threshold, the stream definition is ensured following the flow direction grids as shown in Figure 4.
Topographic Surface Roughness (TSR)
Asymmetrical topographic variations in a region of active Folds and Thrust Belts (FTBs) may be used to determine geotectonic activities (Day, 1979). The TSR corresponds to the deviations from scalar average planes to the vector standard planes. In neotectonically deformed regions, TSR reveals very high values as the areas of the surface average plane and vector standard plane demonstrate highly inconsistent behaviour. Previous studies propose that TSR is a strong surface dynamic index that is quite capable of investigating the morphotectonic characteristics of a deformed region (Grohmann, 2009; Mahmood and Glaoguen, 2011). Within a grid square, TSR is a ratio among the relatively flat region with the actual existing real surface. The grid square size is set as input by the user and may be changed depending upon DEM spatial resolution and the nature of the investigation region. The geographical and mathematical relationship between the flattened and real surface area is illustrated in Figure 5.
Drainage density (DD)
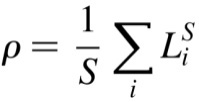
DD (ρ) is defined as the summing up the entire length of all drainage networks per unit of the basin. In this research, DD is computed as shown in (Figure 6).
 …(2)
…(2)
Lsi corresponds to the length of all the streams, and S stands for the entire region enclosed by the roving window. Calculation of DD is based on the vector model, so it is impossible to accord with lake volume data in plan form as it may designate the sinking areas, whereas a lake may well exist as a depression regime influenced by an active fault line (Han et al., 1995). Consequently, it is compulsory to deem lake volume area during the calculation of DD to probe the effects of vertical tectonic block development. We consider lakes as a site of channels regions with higher DD values. DD corresponds to the topographic ruptures which may be associated to neotectonics, types of bedrock basement and quantity of rainfall (Ritter et al., 1995). Low DD is between 0-0.6; average DD falls between 0.61.-0.9 and higher if it is > 0.9 (Hironi, 1991). The mechanisms for computing the TSR and DD are shown below in the flow chart in (Figure 7).
Results and Discussion
In neotectonic topography, drainage networks are affected by the shape, type of geometrical forms and nature of recent neotectonic activity along the regional and localized faults. In the NPS region (Northern Pakistan), the bulk of drainage networks are experiencing the recent tectonic growth and development.
The investigation of the drainage network demarcates zones of active deformation which is extremely significant due to preserved neotectonic signs and vulnerable erosional environment. The drainage morphometry of the NPS region is evidently influenced by active tectonics (Figure 1, 2 and 3). The stream networks of the NPS region consist of parallel, disconnected and dendritic. These evolving and transformation phases of diverse types of stream patterns are related to spatiotemporal geomorphological developments, climatic variations and geotectonic processes. The uplifted topographic zones give rise to the parallel drainage type and authenticate their neotectonic control. The relative localized topographic uplift results in very steepened slopes that influence the geometry of the streams to become linearized, which is an indication of active topographic uplifts. The disconnected and rugged drainage geometry corresponds to a composite topography with neotectonic settings.
Drainage Density (DD)
Strahler (1956) stated that DD changes in inverse proportion to localized relative topographic relief for the first Strahler order sub-watershed and depends on the Froude, Reynolds and Horton numbers. Strahler introduced the mechanism that DD values are associated with increased erosion, exhibiting that the shape of drainage constantly adjusts to attain a dynamic equilibrium between climate change erosion and tectonics. DD is also dependent on the hydrologic characteristics of the topography, climatic environment and morphometric factors. Not a solitary model has so far been perfect that can incorporate all the factors at one platform.
DD show higher values in those areas where channels are very much loaded with fluvial and alluvial sediments. This shows that DD contains the amount of suspended sediments load, which is the consequence of the similar parameters referred above. High DD values are found in NE, SW and central parts and particularly in the NPS region, Sassi, Raikot, Jaglot, Bunji and Nanga Parbat along and parallel to the north-eastern peripheries of MMT (Figure 8). Higher DD values mean a “younger terrain”, existence of a matured drainage, flash run-off from steep hillslopes to local streams, less vegetation coverage, rocks, watershed soils, and topography have generally low permeability. Lower DD values are observed on NW perimeter of MMT, west of Sassi and Jaglot, SE regions of the research site near Deosai Plateau. The DD values were determined for moving windows of various dimensions of 6, 5, 4, 3, 2 and 1 km (Figure 8). Low DD values may correspond to the subsistence of karst type topography, highly porous, permeable alluvial and fluvial deposits in the watershed floors and extremely rugged bedrock channels that can lead to huge drainage volumes storage and small episodes of peak floods, for example, Deosai Plateau in the research site. With the increase of window size, DD increases as the number of channels within the unit area
are increased and due to this splash run-off develops and causes small episodic flood peaks.
Topographic Surface Roughness (TSR)
The results from TSR demonstrate a powerful relationship between NPS evolution and neotectonics. Therefore, the current NPS terrain can be portrayed as a neotectonically influenced regime. DEM generated TSR investigation shows that higher values of TSR are found in the NE periphery of MMT, Sassi-Jaglot-Bunji-Raikot-Nanga Parbat segment known as SRFZ (from 1.1-1.62) in the research region except for the Kachura, Skardu, Deosai Plateau and NW of Jaglot where it is relatively less as 1.0 (Figure 10). These lower, medium and higher TSR values give details about the higher fluvial relative relief in the research site, which completely agrees with the medium to higher values of TSR. Because of higher slopes, the hill-slopes become unstable, and the related processes (land-slides and Rock-slides etc.) become active and are consequently modified swiftly and simply by mass movements.
An investigation based on SRTM DEM and resulting TSR thematic maps with variable roving sizes of windows mainly (6, 5, 4, 3, 2 and 1 Km) (Figure 9) indicate higher TSR values (stronger chanel incision) along the -Jaglot-Bunji-Raikot-Nanga Parbat segment know as SRFZ Deosai Plateau, upper Skardu and NE fringe of MMT (Figure 9) revealing neotectonic deformation and existing relative episodes of topographic uplift. The increased TSR or river relative relief can also be a result of partly strained by isostatic recoil due to orogenic meeting developments (junction region of three majestic mountain ranges, i.e., Hindukush- Karakorum-Himalyas (HKH) region), mostly permitting this orogenic chain growth. This orogenic HKH chain emerged as a consequence of crustal thickening in IndoPak-Eurasian head-on collision. Consequently, higher uneven fluvial relative relief principally generated the relative and unique differential uplifted topography with the exemption of flood plains and second World’s highest Deosai Plateau, resulting from ongoing neotectonic activity. It seems rational to recommend that the rapid and unique relative relief in the majority of the NPS region disclose a combination of extreme and world highest relative relief of roughly 22,500 feet within a little expanse of 25-27 km from Raikot bridge to Nanga Parbat peak with Indus river as local base level (Figure 10) and this may be due to significant neotectonic surge.
Conclusions and Recommendations
The investigation of geomorphic indices (DD and TSR) is important for the quantitative manifestations of a drainage system and spatiotemporal topographic evolution and development. It has been observed that along SRFZ reverse faults and MMT, an increase in magnitudes of the earthquakes is compliant to higher TSR and DD values. Reverse fault topography generally holds extensive and complex geological active structures, while sinistral or dextral faults are usually responsible for making the drainage system become linearized and tectonically or geologically oriented. DD and TSR analysis can be useful to conclude the possible nature of faulting in neotectonic zones. DD and TSR can distinguish the comparatively uplifting topographic segments with conflicting homogeneity and orientation. NPS region is an extremely and rapidly uplifting zone and is extraordinarily deformed topography because of recent recurrent damaging and deadly earthquakes due to ongoing neotectonic activity. This evaluation provides a proposal to Pakistan state administration in the context of future infrastructure development carefully, to take practical measures to guarantee the security of lifelines (hospitals, roads, internet highway, future railways, mobile networks etc.), in view of significant China Pakistan Economic Corridor (CPEC), a socio-economic uplift project for Pakistan, China and the region of One Belt One Road (OBOR) project.
Acknowledgements
The authors are thankful to the department of computer science and space science, University of the Punjab, Lahore-Pakistan, for supporting the completion of this Ph.D research project of Mr. Muhammad Shahzad. We are also thankful to the USGS for providing free SRTM DEM.
Novelty Statement
The novelty of this research is to assess the 3-D surface deformation using SRTM DEM using drainage density and topographic surface roughness in Nanga Parbat region, Pakistan. It was found that medium to high drainage density, steep topography and unique uplift makes the local topography inappropriate for agricultural practices and vulnerable to slope instabilities and failures.
Author’s Contribution
This research is a part of the Ph.D. study of Muhamad Shahazad. This research was poposed by Muhamad Shahazad and refined by Syed Amer Mahmood and Athar Ashraf. Muhamad Shahazad collected and analyzed the data and overall generated the results. Syed Amer Mahmood and Athar Ashraf provided technical input to refine this research. Amer Masood and Saira Batool assisted in field work.
Conflict of interest
The authors have declared no conflict of interest.
References
Ahmad, S., Wadood, B., Khan, S., Ullah, A., Mustafa, G., Hanif, M. and Ullah, H. 2020. The sedimentological and stratigraphical analysis of the Paleocene to early Eocene Dungan formation, Kirthar fold and Thrust Belt, Pakistan: implications for reservoir potential. J Sedimentary Environments 5(4):473–492. https://doi.org/10.1007/s43217-020-00027-2
Amine, A., ElOuardi, H., Zebari, M. and El-Makrini, H. 2020. Active tectonics in the Moulay Idriss massif (south Rifian ridges, NW Morocco): new insights from geomorphic indices and drainage pattern analysis. J. Afr. Earth Sci. 167:103833. https://doi.org/10.1016/j.jafrearsci.2020.103833
Aslam, B. and Naseer, F. 2020. A statistical analysis of the spatial existence of earthquakes in Balochistan: clusters of seismicity.. Environ. Earth Sci. 79(1):41. https://doi.org/10.1007/s12665-019-8790-2
Babar, N., Mohibullah, M., Kasi, A.K., Ali, N. and Khan, A. 2018. Foraminiferal biostratigraphy of the Eocene Kirthar formation, western Sulaiman fold-Thrust Belt, Balochistan, Pakistan. J. Himalayan Earth Sci. 51(2).
Burbank, D.W. and Anderson, R.S. 2001. Tectonic geomorphology; blackwell science, Oxford, 247 pp.
Butler, R.W.H. and Coward, M.P. 1989. Crustal scale thrusting and continental subduction during Himalayan collision tectonics on the NW Indian plate; Tectonic Evolution of the Tethyan Region, A.M.C. Sengor, ed., NATO ASI Ser. C. 259 387-413. https://doi.org/10.1007/978-94-009-2253-2_17
Butler, R.W.H., Prior, D.J. and Knipe, R.J. 1989. Neotectonics of the Nanga Parbat syntaxis, Pakistan, and crustal stacking in the northwest Himalayas. Earth and Planet. Sci. Lett. 94 329-343. https://doi.org/10.1016/0012-821X(89)90150-7
Day, M.J. 1979. Surface roughness as a discriminator of tropical karst styles; Zeitschrift fur.
Delcaillau. B., Carozza, J.M. and Laville, E. 2006. Recent fold growth and drainage development: the Janauri and Chandigarh anticlines in the Siwalik foothills, northwest India. Geomorphology. 76 241–256. https://doi.org/10.1016/j.geomorph.2005.11.005
Grohmann, C.H. and Riccomini, C. 2009. Comparison of roving-window and search-window techniques for characterizing landscape morphometry. Comput. Geosci. 35: 2164–2169. https://doi.org/10.1016/j.cageo.2008.12.014
Gupta, S. 1997. Himalayan drainage patterns and the origin of fluvial megafans in the Ganges foreland basin. Geology. 25: 11–14. https://doi.org/10.1130/0091-7613(1997)025<0011:HDPATO>2.3.CO;2
Han, M., Hou, J., Zhao, J. and Zhu, S. 1994. The method about the usage of drainage to study the concealed tectonic movement in Holocene. In:Committee of Seismo-geology. China Seismological Society (Ed.), Research on Active Faults in China. Seismological Press, Beijing. 291–295.
Han, Z., Xu, J., Guo, S., Yang, Z., Xiang, H. and Wu, D. 1995. Research on tectonic features and dynamics in the Northwestern Yunnan extensional region, Earthquake Research in China. 9: (2).
Han, Z., Zhang, P., Wu, L. and Hou, J. 1998. Characters about the modern movement of North Qilianshan block. In: Department of Geology, Peking University (Ed.), Collection of International Conference on Geological Science in Peking University. Seismological Press, Beijing.
Hironi, K. 1991. Land Use Planning and Geomorphology: A Study of Sawai Madhopur. Concept Publishing Company. 187.
Hobson, R.D. 1967. FORTRAN IV programs to determine the surface roughness in topography for the CDC 3400 computer; Computer Contribution State Geol. Survey Kansas. 14 1–28.
Hobson, R.D. 1972. Surface roughness in topography: quantitative approach. In Chorley, R.J., editor; Spatial analysis in geomorphology. Methuer, London. 225–245.
Hovius, N. 1996. Regular spacing of drainage outlets from linear mountain belts. Basin Res. 8 29–44. https://doi.org/10.1111/j.1365-2117.1996.tb00113.x
Jackson, J. and Leeder, M. 1994. Drainage systems and the development of normal faults: an example from Pleasant Valley, Nevada. J. Struct. Geol. 16: 1041–1059. https://doi.org/10.1016/0191-8141(94)90051-5
Jackson, J., Norris, R. J. and Youngson. J. 1996. The structural evolution of active fault and fold systems in central Otago, New Zealand, evidence revealed by drainage patterns. J. Struct. Geol. 18: 217–234. https://doi.org/10.1016/S0191-8141(96)80046-0
Jackson, J., Van Dissen, R. and Berryman, K. 1998. Tilting of active folds and faults in the Manawatu region, New Zealand: evidence from surface drainage patterns New Zealand. J. Geol. Geophys. 41: 377–385. https://doi.org/10.1080/00288306.1998.9514817
Jenson, S.K. and Domingue, O. 1988. Extracting topographic structure from digital elevation data for geographic information system analysis. Photogramm. Eng. Remote Sens. 54 (11): 1593-1600.
Keller, E.A. 1986. Investigation of active tectonics: use of surficial earth processes. In: Wallace, R.E. (Ed.); Active Tectonics, Studies in Geophysics. National Academy Press, Washington, DC. 136-147.
Keller, E.A. and Pinter, N. 2002. Active Tectonics: Earthquakes, Uplift, and Landscape. 2nd ed. Prentice Hall, Upper Saddle River, N.J. 362.
Lawrence, R.D., Hasan, K.S., Nakata, T., Buckman, R.C. and Hancock, P.L. 1981. Chaman Fault, Pakistan-Afghanistan, Major active faults of the world; Results of the IGCP Project. 206.
Le Fort. 1986. Metamorphism and magmatism during the Himalayan collision, in: Collision Tectonics, Spec. Publ. Geol. Soc. London. 19: 159-172. https://doi.org/10.1144/GSL.SP.1986.019.01.08
Leeder, M. and Jackson, J. 1993. The interaction between normal faulting and drainage in active extensional basins, with examples from the western United States and central Greece. Basin Res. 5: 79–102. https://doi.org/10.1111/j.1365-2117.1993.tb00059.x
MacMillan, R.A. and Shary, P.A. 2009. landforms and landform elements in geomorphometry; Hengl T, Reuter HI (Eds.), Geomorphometry-Concepts, Software, Applications. Dev. Soil Sci. https://doi.org/10.1016/S0166-2481(08)00009-3
Mahmood, S.A. and Gloaguen, R. 2011. Fractal Measures of Drainage Network to Investigate Surface Deformation from Remote Sensing Data: A Paradigm from Hindukush (NE-Afghanistan). J. Mt. Sci. 8: 641–654. https://doi.org/10.1007/s11629-011-1030-1
Mahmood, S.A. and Gloaguen, R. 2012. Appraisal of active tectonics in Hindu Kush: Insights from DEM derived geomorphic indices and drainage analysis; Geosci. Front. 3: 407- 428. https://doi.org/10.1016/j.gsf.2011.12.002
McKean, J. and Roering, J. 2004. Objective landslide detection and surface morphology mapping using high-resolution airborne laser altimetry. Geomorphology. 57(3-4): 331–315. https://doi.org/10.1016/S0169-555X(03)00164-8
Misch, P. 1964. Stable association wollastonite-anorthite and other calc-silicate assemblages in amphibolite facies crystalline schists of Nanga Parbat, northwest Himalayas. Contrib. Mineral. Petrol. 10: 315-356. https://doi.org/10.1007/BF01081751
Mueller, K. and Talling, P.J. 1997. Geomorphic evidence for tear faults accommodating lateral propagation of an active fault-bend fold, Wheeler Ridge, California. J. Struct. Geol. 19: 397–411. https://doi.org/10.1016/S0191-8141(96)00089-2
O’Callaghan, J. and Mark, D. 1984. The extraction of drainage networks from digital elevation data; Comput. Vision Graph. 28: 323–344. https://doi.org/10.1016/S0734-189X(84)80011-0
Olaya, V. 2009. Chapter 6. Basic land-surface parameters. In Hengl, T and Reuter, H I; editors, Geomorphometry: Concepts, Software, Applications. Dev. Soil Sci. Elsevier, Amsterdam. 33 141–169. https://doi.org/10.1016/S0166-2481(08)00006-8
Ouchi, S. 1985. Response of alluvial rivers to slow active tectonics movement. Geol. Soc. Am. Bull. 96 504–515. https://doi.org/10.1130/0016-7606(1985)96<504:ROARTS>2.0.CO;2
Pelletier, J.D. 2004. Persistent drainage migration in a numerical landscape evolution model. Geophys. Results Lett. 31. https://doi.org/10.1029/2004GL020802
Pike, R.J. 2000. Geomorphometry-diversity in quantitative surface analysis. Prog. Phys. Geogr. 24(1): 1-20 (49). https://doi.org/10.1191/030913300674449511
Qureshi, J., Mahmood, S.A., Masood. A., Khalid, P., Kaukab, I.S. 2019. DEM and GIS-based hypsometric analysis to study tectonics and lithologies in southern Suleiman fold and thrust belt (Balochistan–Pakistan). Arab J. Geosci. 12(5):1–15. https://doi.org/10.1007/s12517-019-4283-6
Ritter, D.F., Kochel, R.C. and Miller, J.R. 1995. Process Geomorphology WBC/Mc Graw-Hill, Boston. 545.
Shahzad, F., Mahmood, S.A. and Gloaguen, R. 2009. Drainage Network and Lineament Analysis: An Approach for Potwar Plateau (Northern Pakistan); J. Mt. Sci. 6(1): 14–24. https://doi.org/10.1007/s11629-009-0206-4
Strahler, A.N. 1956. Quantitative slope analysis. Geol. Soc. Am. Bull., 67: 571–596.
Tomkin, J.H. and Braun, J. 1999. Simple models of drainage re-organisation on a tectonically active ridge system. N. Ze. J. Geol. Geophys. 42: 1–10. https://doi.org/10.1080/00288306.1999.9514827
Uddin, N., Babar, N., Mohibullah, M., Kasi, A.K., Khan, M., Ghani, M. 2019. Biostratigraphy of the Kirthar formation,Mach area, Sulaiman fold-Thrust Belt, Balochistan, Pakistan. BahriaUniversity Res. J. Earth Sc. i4(1):1–6.
Van der Beek, P., Champel, B. and Mugnier, J. L. 2002. Control of detachment dip on drainage development in regions of active fault propagation folding. Geology. 30: 471–474. https://doi.org/10.1130/0091-7613(2002)030<0471:CODDOD>2.0.CO;2
Vetel, W., Le Gall, B. and Johnson, T.C. 2004. Turkana Rift (North Kenya): an integrated approach from drainage network, satellite imagery and reflection seismic analyses; Basin Res. 16 165–181. https://doi.org/10.1046/j.1365-2117.2003.00227.x
Wheeler, R.L., Bufe, C.G., Johnson, M.L. and Dart, R.L. 2005. Seismotectonic map of Afghanistan with annotated bibliography; U.S. Geological Survey Open-File Report. 2005–1264. https://doi.org/10.3133/ofr20051264
Wobus, C., Whipple, K., Kirby, E., Snyder, N., Johnson, J., Spyropolou, K., Crosby, B. and Sheehan, D. 2006. Tectonics from topography: Procedures, promise and pitfalls, in S.D. Willett, N. Hovius, M. T. Brandon, and D. M. Fisher; eds; Tectonics, Climate and Landscape Evolution, GSA Special Paper. 398: 55-74. https://doi.org/10.1130/2006.2398(04)
To share on other social networks, click on any share button. What are these?


