
SRTM DEM based 3-D Surface Deformation of Nanga Parbat Syntaxis through Drainage Density and Surface Roughness


SRTM DEM based 3-D Surface Deformation of Nanga Parbat Syntaxis through Drainage Density and Surface Roughness
Muhammad Shahzad1*, Syed Amer Mahmood2, Athar Ashraf3, Amer Masood2 and Saira Batool4

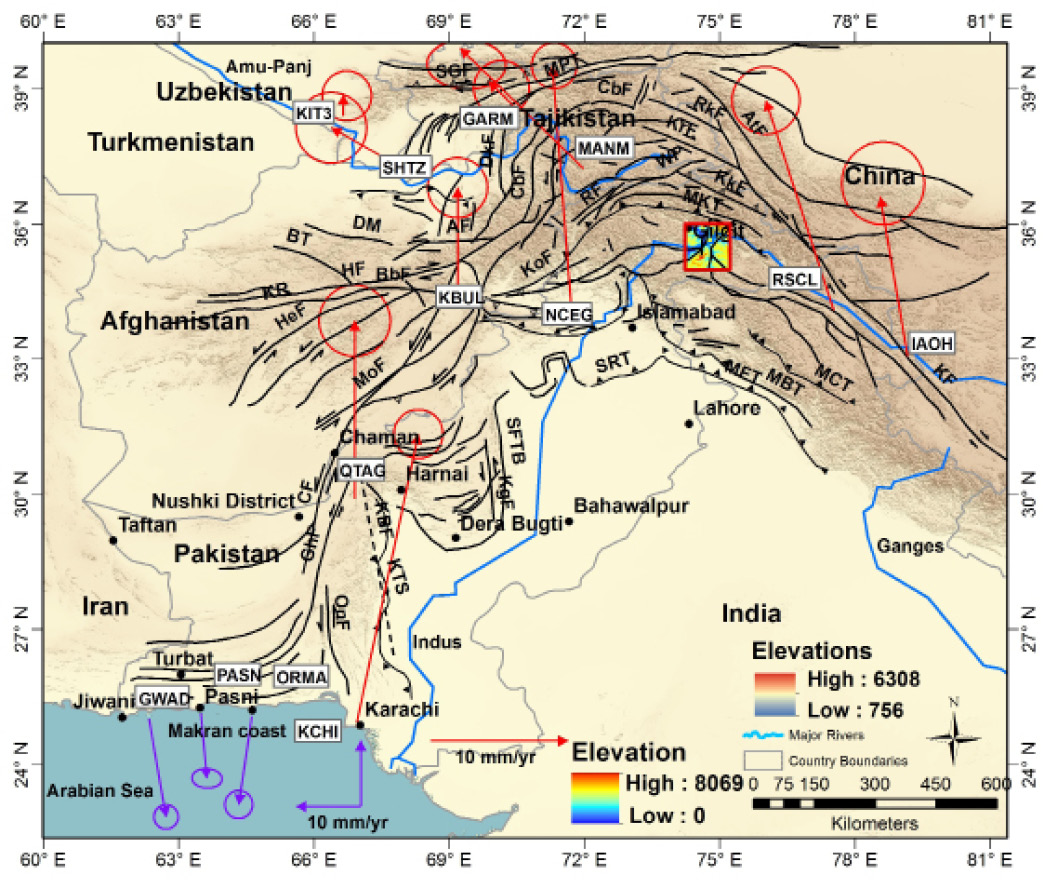
Regional tectonic framework (Hindu Kush-Karakorum-Himalaya) with red block representing the investigation site. Sources: (Lawrence et al., 1981; Wheeler et al., 2005; Mahmood and Gloaguen, 2011; 2012).

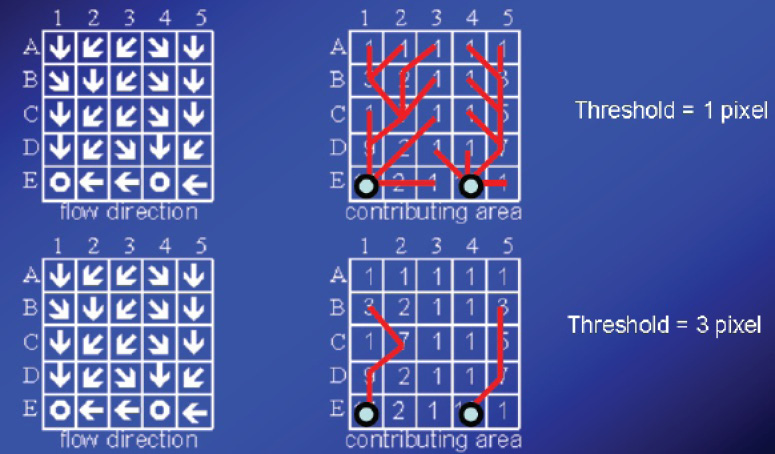
The illustration is showing the D8 algorithm for the calculation of flow angles and stream definition by assigning a specific threshold of 1, 3 pixels as per requirement in the context of contributing areas (O’Callaghan and Mark, 1984; Jenson and Domingue, 1988).

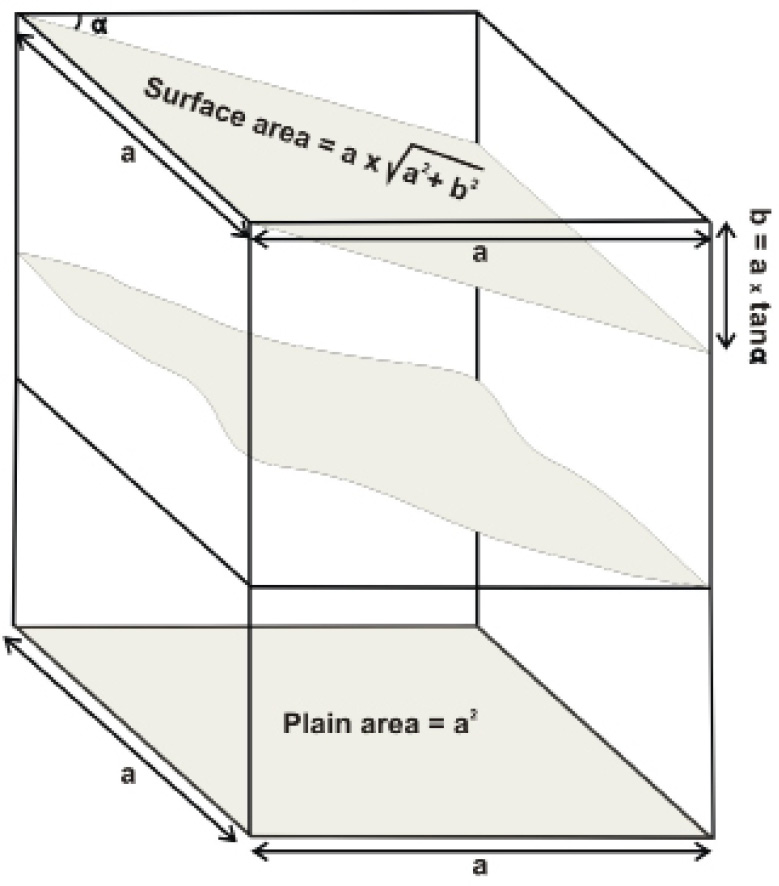
The mechanism showing the computation of topographic surface roughness (TSR), (Grohmann, 2009).
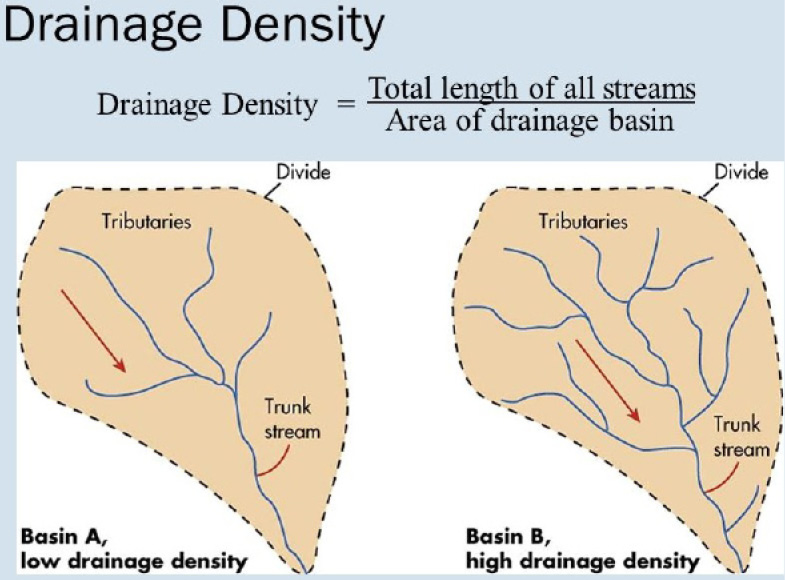
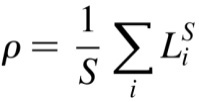
Illustration showing computation of DD.
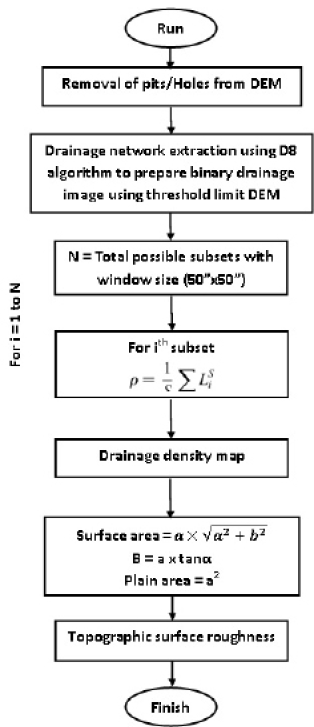
Flow charts showing various image processing steps (modified after Mahmood and Gloaguen, 2011)
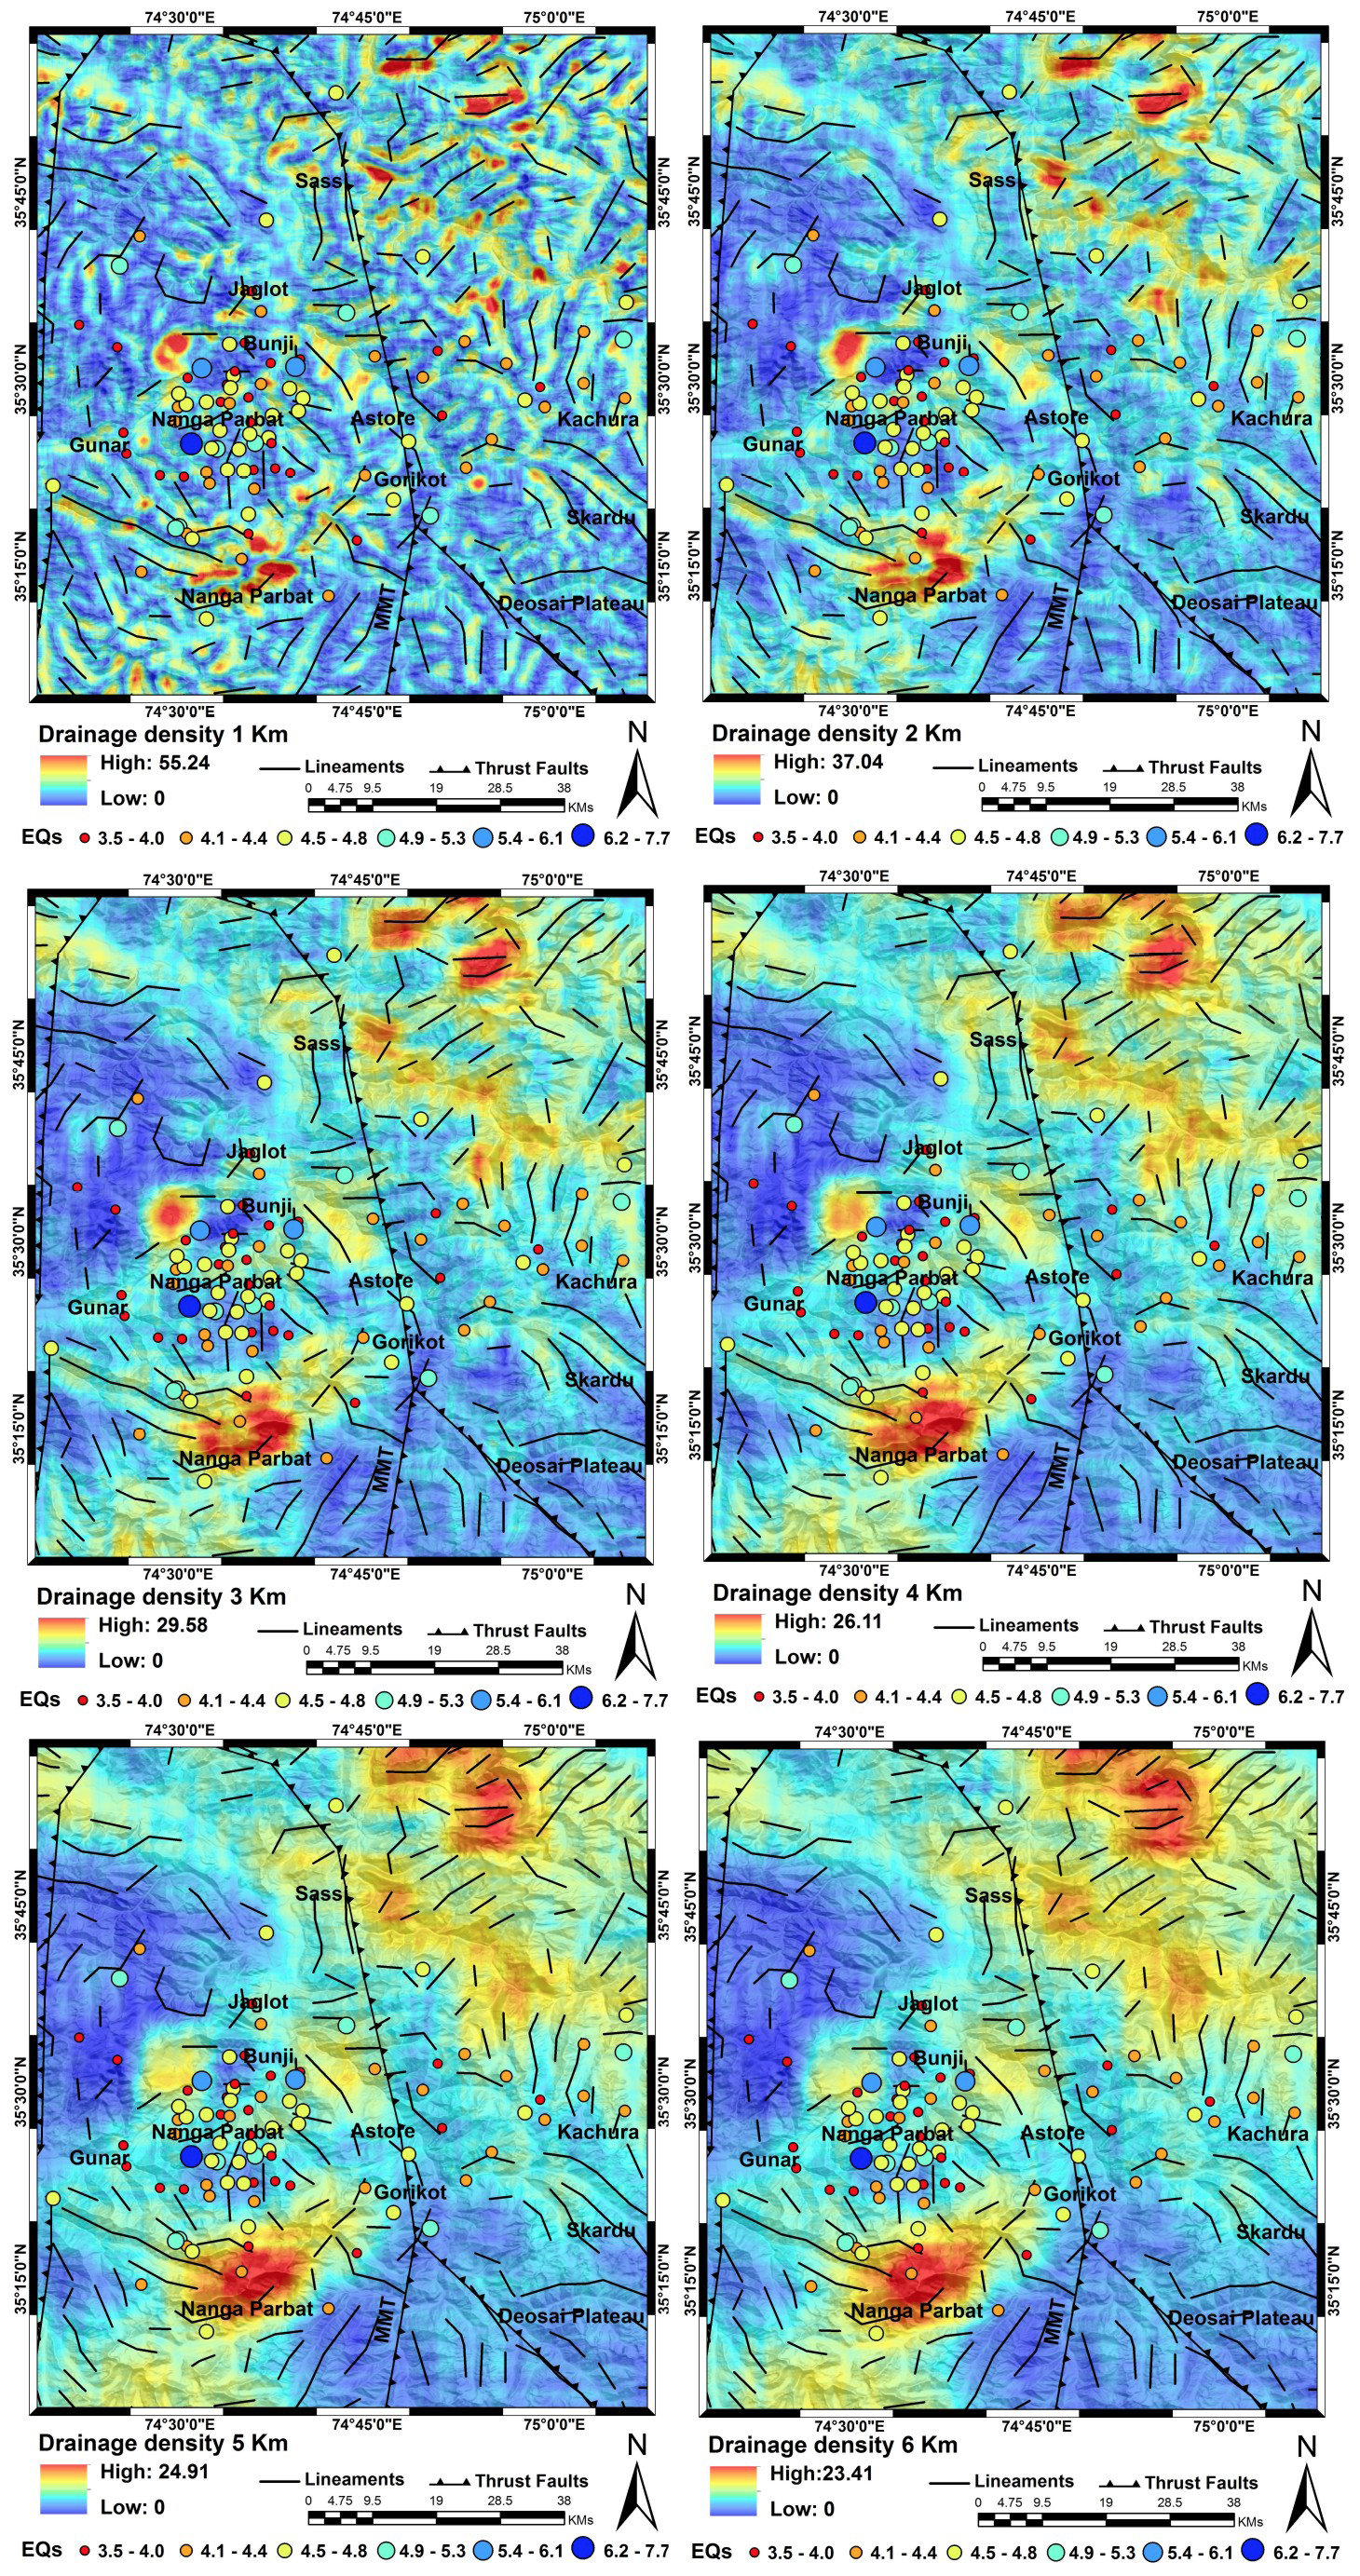
The drainage density maps generated with different moving window sizes of 1, 2, 3, 4, 5 and 6 km.
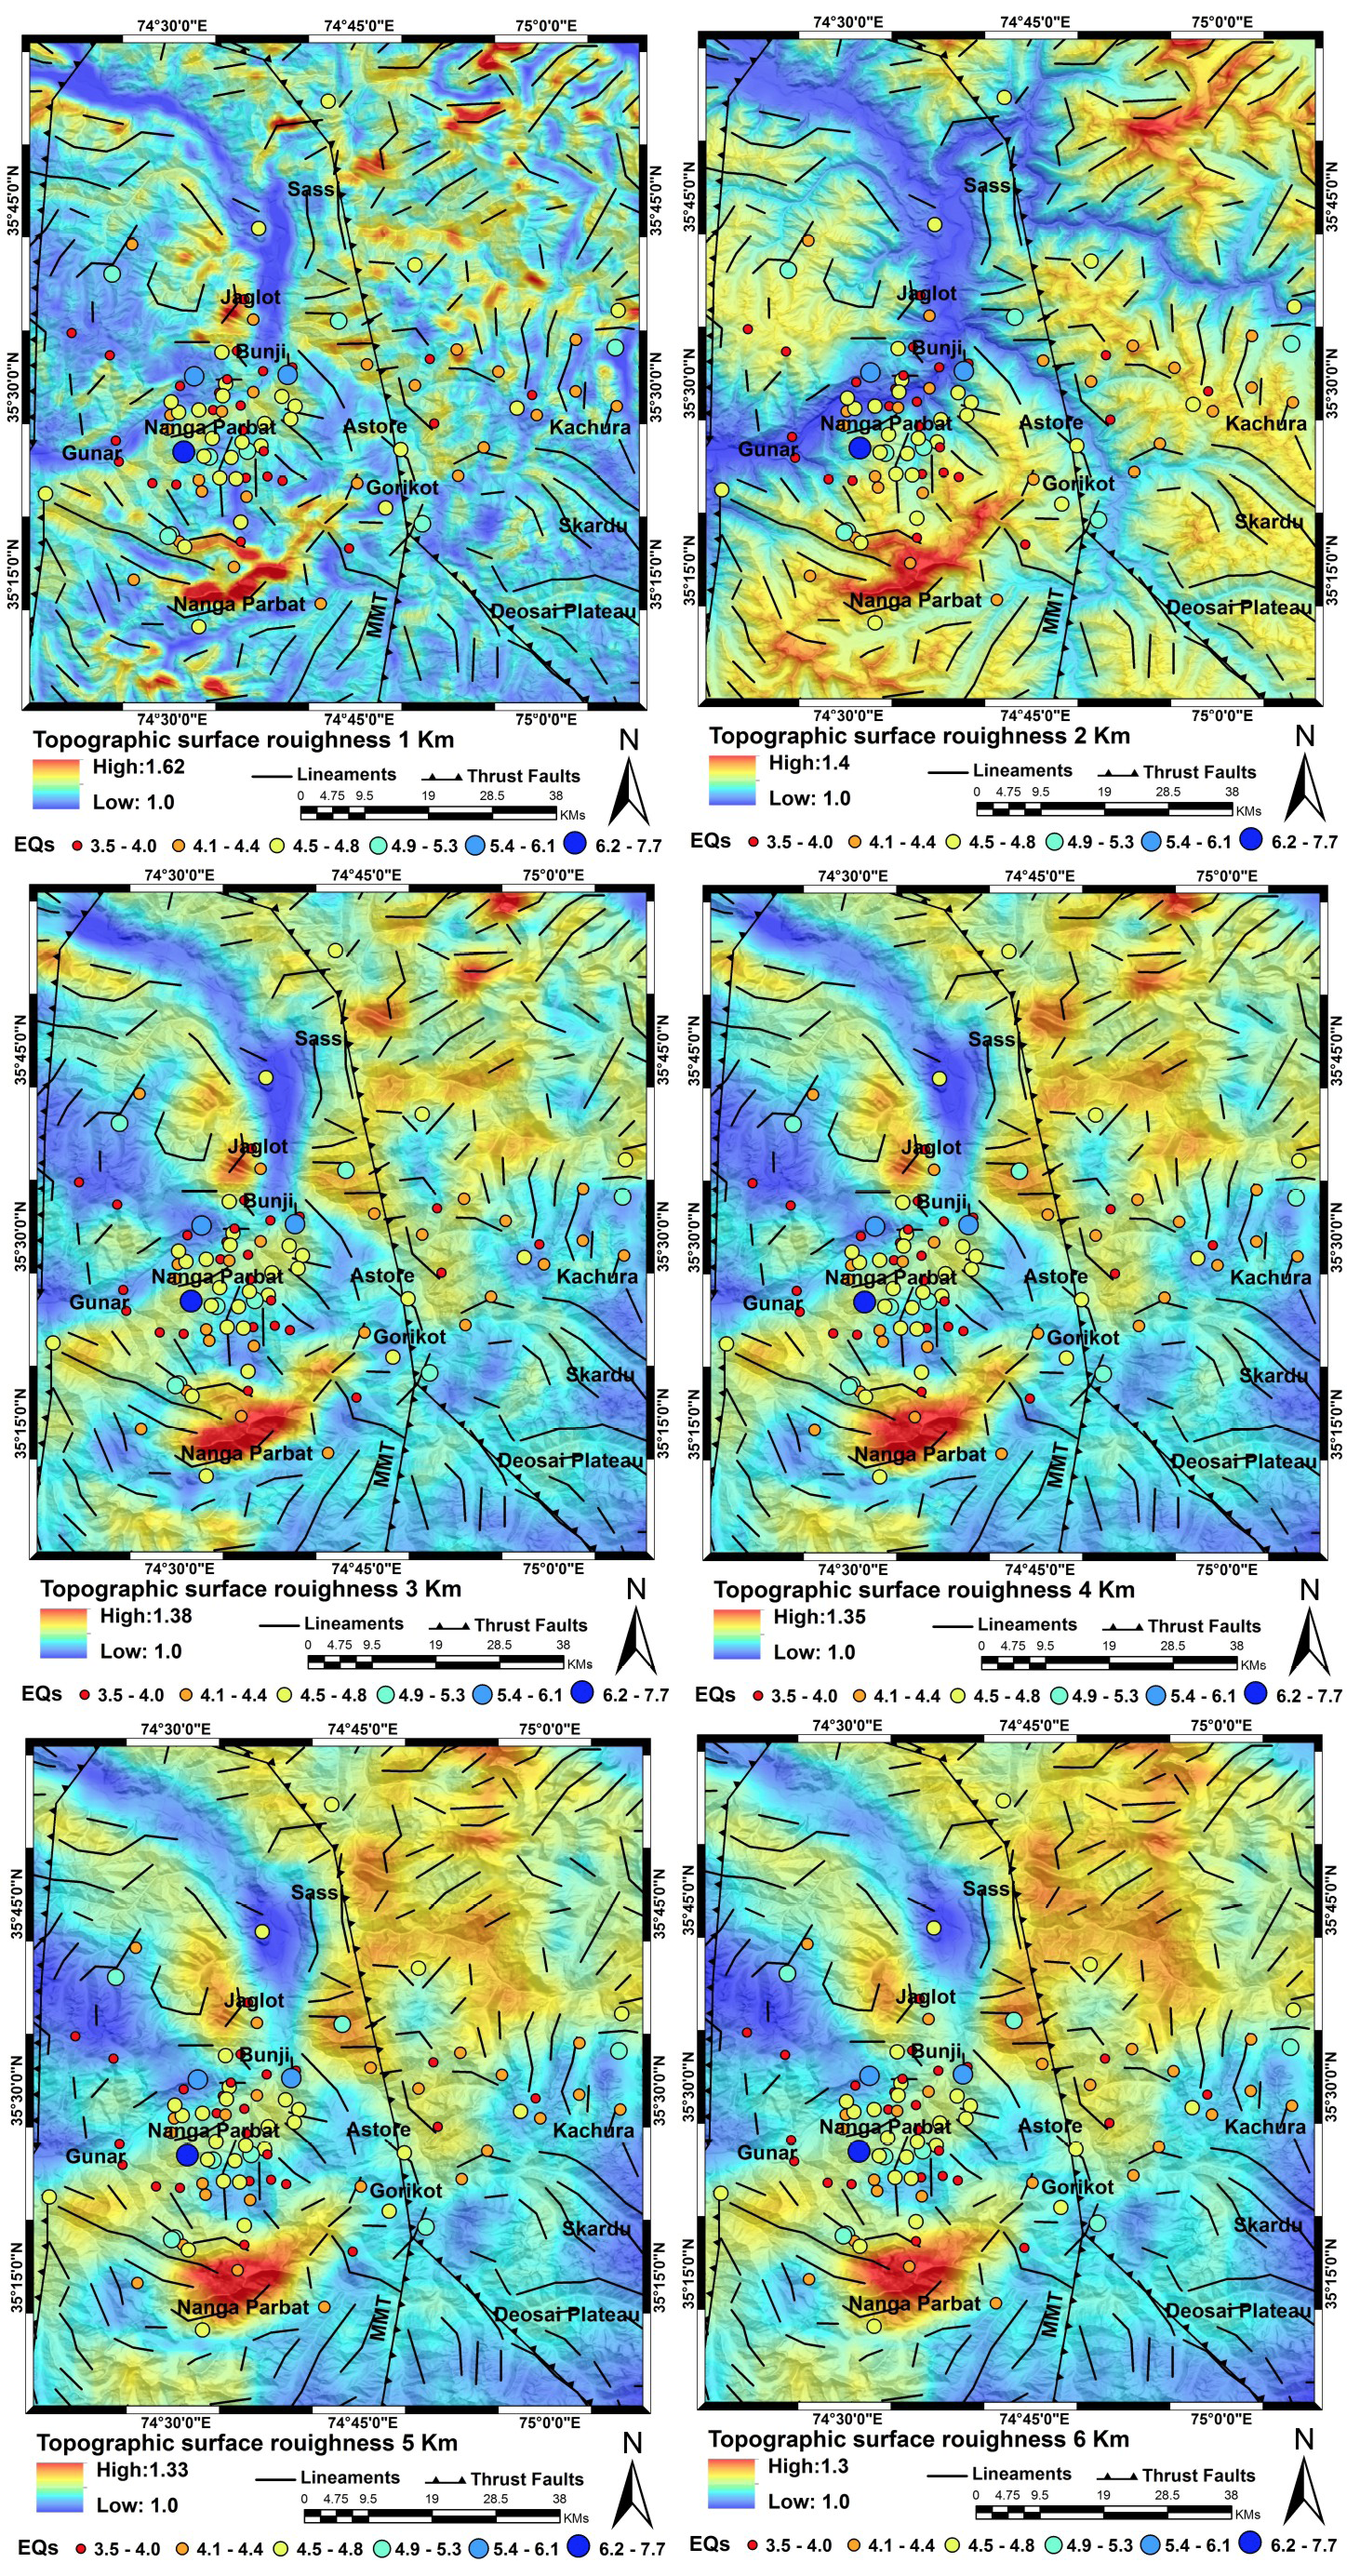
The TSR maps with different moving window sizes of 1, 2, 3. 4, 5 and 6 km.

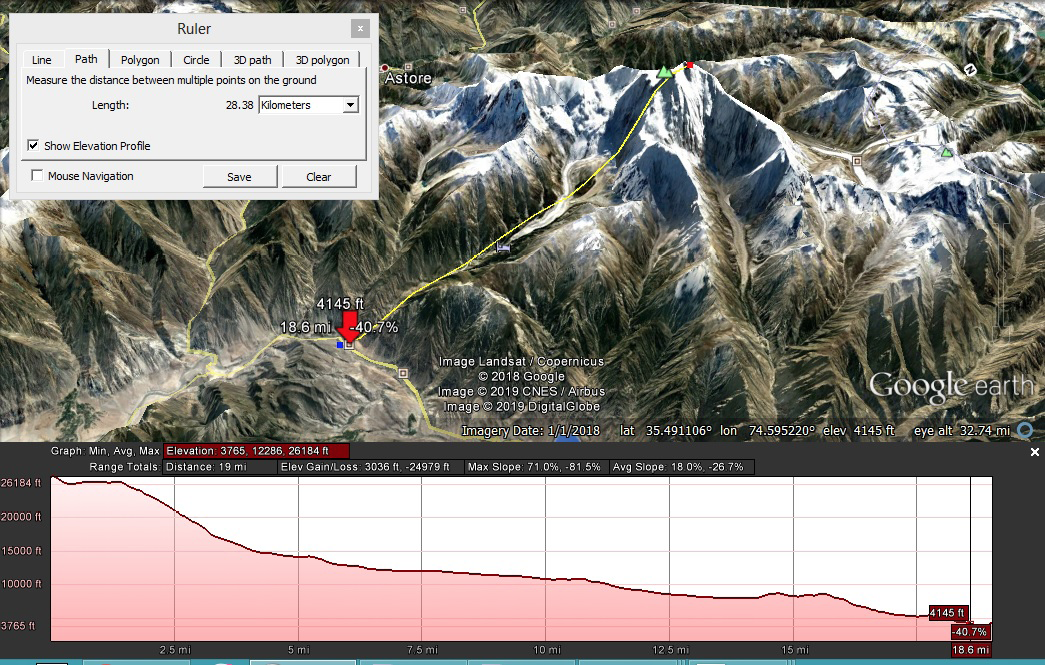
The google pro screenshot illustrating the elevation profile from Nanga Parbat top to Raikot bridge showing the highest unique relative relief in the world (22,000 feet within short expanse of 28 km).


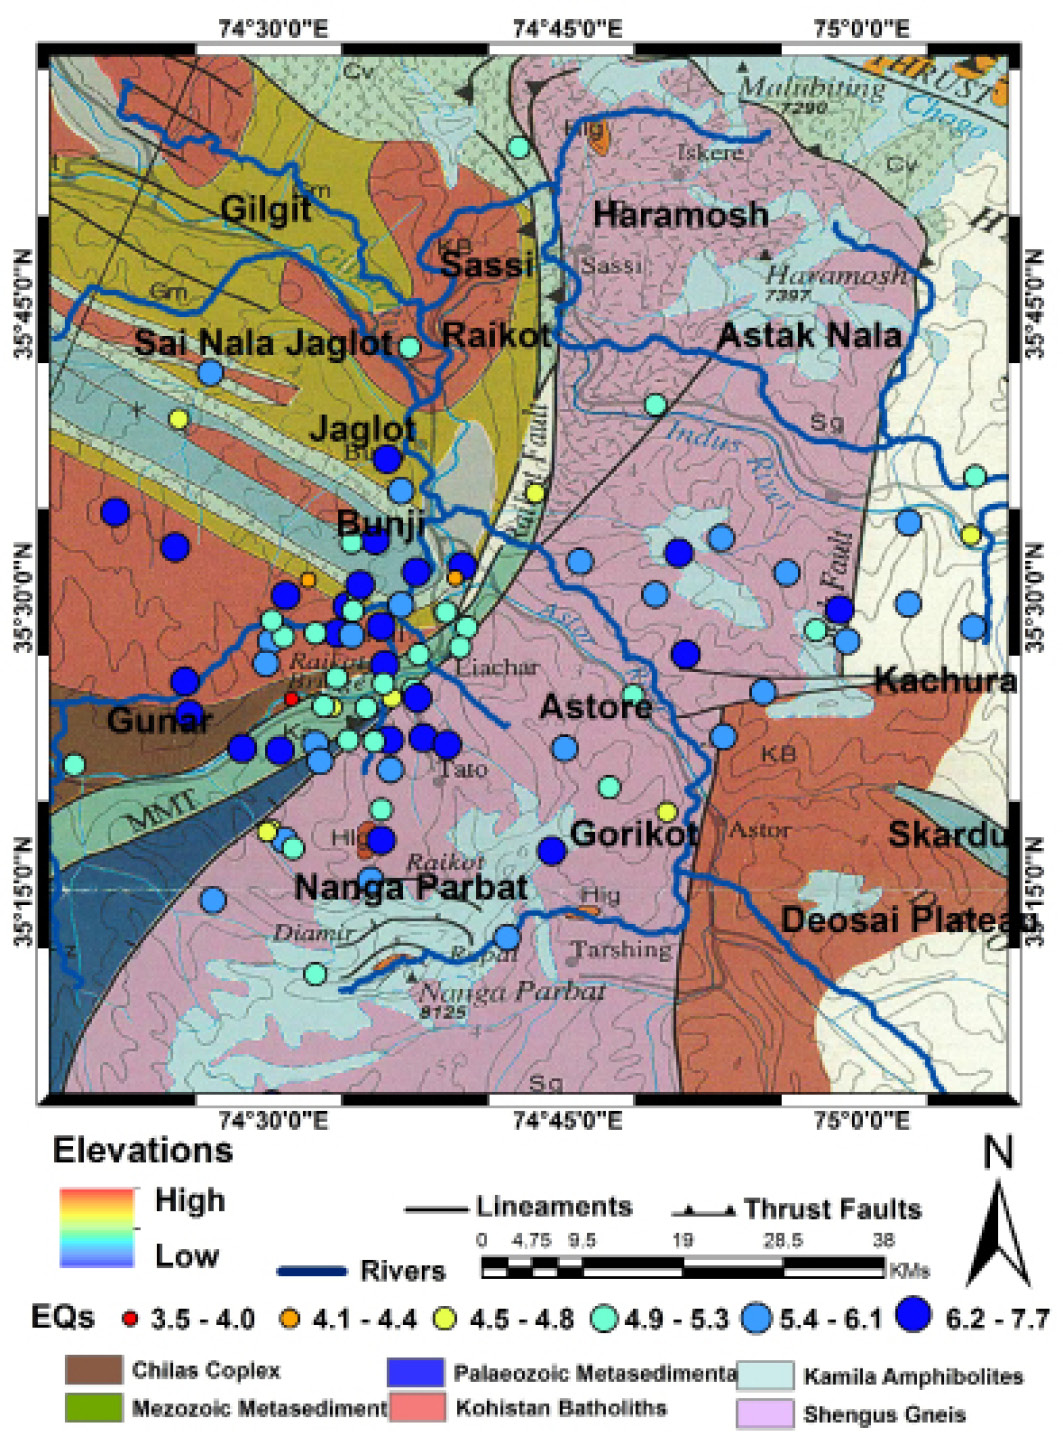
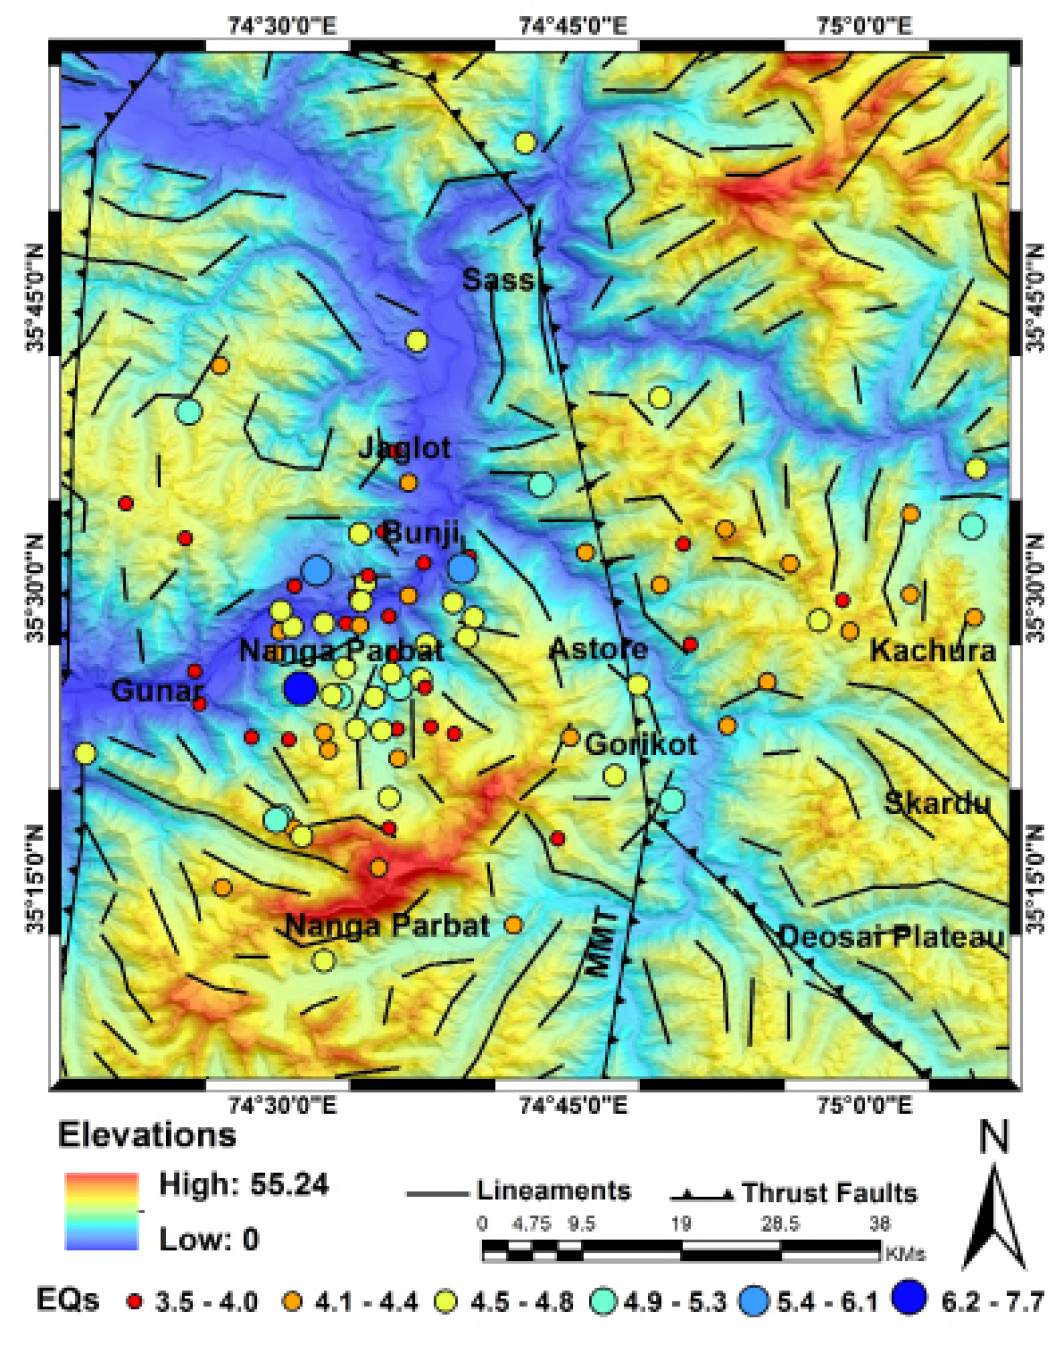
Geotectonic map of the NPS region.


