
Reaction and Diversity Analysis to Identify Novel Genetic Resources for Exserohilum turcicum Resistance in Maize


Research Article
Reaction and Diversity Analysis to Identify Novel Genetic Resources for Exserohilum turcicum Resistance in Maize
Shishir Sharma1*, Suk Bahadur Gurung2, Ritesh Kumar Yadav1, Bibek Phulara1 and Laxmi Prasad Joshi1
1Department of Plant Pathology, Faculty of Agriculture, Agriculture and Forestry University, Rampur Campus, Chitwan, Nepal; 2National Maize Research Program, Rampur, Chitwan
Abstract | The magnitude and nature of the genetic divergence determine the genotypes for a maize breeding program. One hundred one inbred lines of maize were evaluated using Rampur Hybrid 10 as resistant check in a rod row design from October 2020 to March 2021 at the National Maize Research Program’s research farm in Rampur, Chitwan. The goal includes identifying correlations between genotypes, estimating the proportionate contribution of various disease characteristics, and selecting eligible parent lines for hybridization purposes utilizing principal component analysis and Ward’s clustering. Correlation assessment revealed a negative relationship between disease parameters and grain yield. According to the principal component analysis, three of the nine main components were significant (eigenvalues > 1) and accounted for 44.60%, 15.30%, and 13.60%, respectively of the total variance. PC1 comprised parameters including percent disease index (PDI), area under the disease progress curve (AUDPC), disease incidence percent (DI%), and infected leaves per plant (IL/P) that were mostly connected to quantitative resistance; PC2 was related to lesion number and lesion breadth; PC3 was mostly concerned with grain yield, while PC4 with sporulation (spores/ml). Inbred lines were divided into three groups using cluster analysis, with 27 inbred lines being placed in cluster II. The mean values of the disease parameter were found to be the lowest in Cluster II, while the grain yield was the greatest. Cluster analysis showed the highest inter-cluster distance between cluster II and cluster III (4.19) and the lowest between cluster I and cluster III (2.24). Clusters I and III have the lowest inter-cluster distance, indicating that their genotypes are quite similar. By utilizing heterosis in segregating, choosing parents from clusters II and III would be successful in the hybridization program to develop improved NLB-resistant hybrids.
Received | January 31, 2023; Accepted | January 08, 2024; Published | April 12, 2024
*Correspondence | Shishir Sharma, Department of Plant Pathology, Faculty of Agriculture, Agriculture and Forestry University, Rampur Campus, Chitwan, Nepal; Email: agroshishir111@gmail.com
Citation | Sharma, S., S.B. Gurung, R.K. Yadav, B. Phulara and L.P. Joshi. 2024. Reaction and diversity analysis to identify novel genetic resources for Exserohilum turcicum resistance in maize. Sarhad Journal of Agriculture, 40(2): 335-346.
DOI | https://dx.doi.org/10.17582/journal.sja/2024/40.2.335.346
Keywords | Resistance, Maize, Principal component analysis, Clustering, Correlation
Copyright: 2024 by the authors. Licensee ResearchersLinks Ltd, England, UK.
This article is an open access article distributed under the terms and conditions of the Creative Commons Attribution (CC BY) license (https://creativecommons.org/licenses/by/4.0/).
Introduction
The global challenges for maize production include biotic and abiotic stresses, insufficient inputs, poor soil fertility, and low mechanized operations (Prasanna, 2016). In Nepal, poor crop management and diseases are the main factors causing the quantity and quality of maize to decline. Maize is prone to many fungal pathogens, few bacterial species, and viruses. Seventy-five fungal and only 3 bacterial pathogens have been recorded in Nepal (Subedi, 2015). Southern leaf blight (Bipolaris maydis (Nisikado) Shoemaker), northern leaf blight (Exserohilum turcicum (Pass.) Leonard and Suggs), gray leaf spot (Cercospora zeae-maydis Tehon and Daniels), banded leaf and sheath blight (Rhizoctonia solani Kuhn) and ear rot are the major fungal diseases prevalent in Nepal (Subedi, 2015). Northern leaf blight (NLB) is a devastating foliar disease of humid and colder areas that needs to be managed effectively. Significant losses were recorded from the disease in Nijgadh, Bara during the winter season of 2012 (NMRP, 2013). Yield losses were reported up to 43.13% at Kakani on local maize, 22% and 33% at Khumaltar on Manakamana-1 and Khumal yellow variety, respectively, and 42.7% at Pakhribas on Hetauda composite under artificially epiphytotic conditions (Rijal et al., 2014).
Prevailing maize improvement and disease control strategies include utilization of host resistance, chemical management (Payak and Sharma, 1985), biological and botanical management, pathogen elimination by application of good cultural practices that include farm hygiene, intercropping, residue management, crop rotation and biotechnological approaches (Mueller et al., 2020). Although the use of fungicides is not always economical for maize (Mallowa et al., 2015), it may benefit large-scale growers, seed producers, commercial and high-value material producers like sweet corn, popcorn, etc. It has the greatest likelihood of economic return if fungicides are applied on susceptible cultivars before the tasseling (VT) or silking (R1) stage at the prudent rate with appropriate spraying strategies (Carpane et al., 2020). Side effects and lingering impacts on the environment and public health will become a rising issue due to the development of resistant strains of the pathogen if fungicides are not applied wisely (Barad et al., 2019). Cultural and chemical management is not always practical and feasible, and no single approach can successfully manage the epidemic of the disease. Therefore, the principal and most reliable technique for managing northern leaf blight (NLB) of maize is to adopt resistant cultivars, which lowers production costs, decreases management efforts, and reduces environmental concerns (Ribeiro et al., 2016; Vieira et al., 2009). Even the best way to combat this disease is the application of integrated tactics that include the adoption of resistant varieties, debris, and stubble management, and the use of fungicides only when required.
Genetics of resistance is determined both qualitatively and quantitatively in maize genotypes. Qualitative/ vertical resistance is governed by single or monogenic genes and race-specific Ht genes. It is the highest level of resistance conferred by many qualitative genes i.e., Ht gene, which may be dominant or partly dominant. Dominant genes (Ht1, Ht2, Ht3, HtN, HtNB, HtP, HtM) and two recessive genes (one described by Carson (1995) and the other is rt)) provide resistance to various races of Exserohilum turcicum. Ht1 gene expresses chlorotic lesions with minimum sporulation (Hooker, 1963) whereas, Ht2 and Ht3 gene expresses a chlorotic lesion with slightly more necrotic lesions than that of Ht1 (Hooker, 1977, 1981). Similarly, HtN (or Htn1) gene expresses delayed symptoms until anthesis and HtNB gene expresses non-lesion resistance before heading (Wang et al., 2012). On the other hand, HtP gene expresses full resistance to chlorotic lesion (Ogliari et al., 2005) however; HtM gene expresses full resistance. The recessive gene mentioned by Carson (1995) expresses a chlorotic lesion of 1 cm diameter and rt recessive gene expresses a chlorotic lesion to full resistance (Ogliari et al., 2007). Different physiological races of Exserohilum turcicum have been reported such as 0, 1, 2, 3, 12, 13, 23, N, 1N, 2N, 3N, 12N, 23N, and 123N. These physiological races are identified based on the phenotypic reaction after inoculation in maize lines (Dong et al., 2008; Hooda et al., 2017; Turgay et al., 2020). Race 0 can infect only susceptible varieties, but Race 1 can infect cultivars with the Ht1 gene due to the conversion of the avirulence gene into virulence. Till now, Race 123N can infect all cultivars with corresponding Ht genes (Galiano-Carneiro and Miedaner, 2017). The Ht1, Ht2, Ht3, and Htn1 genes, which have been backcrossed into common inbred lines, have received the most research attention (Ferguson and Carson, 2007). As the pathogen mutates from avirulence to virulence, the Ht genes may become ineffective, or the resistance may be “broken” (Vale et al., 2001). The boom-Bust period is likely to occur due to the possible emergence of new races, so qualitative resistance is not believed to be durable and sustainable.
Quantitative/ horizontal resistance is governed by multiple genes (polygenic), non-race specific, and has a small impact on disease resistance. It is primarily expressed as a reduced number and size of lesions, an increase in the latent period with the decreased amount of sporulation compared to the susceptible genotype (Kumar et al., 2011). The most frequent parameters for the assessment of maize genotypes for NLB resistance are disease severity, disease incidence, lesion size, and area under the disease progress curve (Abera et al., 2016). Due to the vulnerability of single-gene resistance to the formation of new races, partial resistance is considered more lasting. A combination of monogenic Ht resistance with partial resistance allows for additive or complementary effects that might improve the total resistance level (Lipps et al., 1997). Already-known characters with high genetic stability, vigor, uniformity, and reproducibility make inbred lines an important resource for research activities (Mubeen et al., 2017). Thus, the identification of disease resistance inbred lines could be one of the most important components of an integrated disease management strategy to combat this devastating disease. Knowledge of disease reaction and identification of resistant inbred lines is a great need for the maize improvement program. There is a need to develop, identify, and utilize germplasm with northern leaf blight resistance for the mitigation of the potential loss from disease.
Some of the major works have been already performed on the evaluation of genotypes, which was reviewed in the paper by Subedi (2015). A higher frequency of sexual reproduction of the fungi may increase the risk of generating new races, so identification and evaluation of new sources of resistance to northern leaf blight is the most. Hence, a total of 101 inbred lines were screened under artificial epiphytotic conditions. The goal of the current study was to examine the genetic diversity and discover sources of resistance that may be used in the future to create elite resistant varieties, assess a useful gene pool, and map resistance genes.
Materials and Methods
Meteorological conditions in the experiment site
The experiment was conducted at the National Maize Research Program (NMRP) research farm in Rampur, Nepal. Rampur is 228 meters above sea level and located at 27° 40’ 50” North, 84° 19’ 3” East. It has a humid and subtropical climate, with mild winters (2-30°C) and scorching summers (up to 43°C). The annual average rainfall exceeds 1500 mm, with a distinct monsoon season (>75% of the total annual rainfall) lasting from mid-June to mid-September (NARC, 2022). The soil was sandy loam, and the meteorological conditions over the whole research period are shown in Figure 1. During our field trial in Rampur, Chitwan, no precipitation was detected.
Single spore isolation and maintenance of pure culture
During the winter of 2020, maize leaves with characteristic northern leaf blight lesions were collected from the research site. Infected leaves were air-dried, placed in a paper bag, and refrigerated at 4°C for further pathogen isolation. Fungus was isolated from diseased leaf samples using the technique reported by Shekhar and Kumar (2012). The sterilized knife was used to cut a small amount of diseased leaf tissue with some nearby healthy tissue measuring approximately 5 mm × 5 mm. Surface sterilization was performed to destroy any undesired surface pathogens by immersing the leaf parts in 75% ethanol for 30 seconds and 1% sodium hypochlorite solution for 1 minute before washing three times with distilled water. To absorb moisture, the leaf sections were wiped using sterile filter paper. The leaf fragments were put in a sterile petri plate with three layers of wet blotting paper to create a moist chamber for fungal sporulation at 25±2°C in a BOD (Bio-oxygen demand) incubator for 24 hours.
A single spore on the surface of the lesion was picked up with the help of fine flattened needles under a stereomicroscope and placed on water agar (20 g agar/l of distilled water) aseptically. After the germination of the spore in 24 hours, a single spore was again transferred from water agar to separate culture tubes of potato dextrose agar (PDA) (200 g potato infusion, 20 gm dextrose, 20 gm agar for 1 lt) slants with the help of stereomicroscope and inoculating needle under laminar flow chamber aseptically. Streptomycin sulfate (50 ppm) was added to the PDA to limit bacterial development. To get the pure monoconidial isolates, the tubes were cultured in a BOD incubator at 25±2°C for 12 days. PDA slants were kept in the refrigerator at 4°C for short-term storage as a pure stock culture for future study. This isolation approach is also included in Sun et al. (2020).
Genotypes, experimental sites and design
NARC provided 101 maize inbred lines, which were employed in the study under artificial epiphytotic conditions as given in Table 1.
The field trial was carried out during the 2020 winter season. Each genotype was planted in a two-row plot of 4 m length with 75cm ×20 cm spacing using a maize jab planter. Rampur Hybrid-10 and Rampur Composite were employed as resistant and standard checks, respectively. The consistent number of plants was maintained by eliminating the surplus plants 15 days after sowing. The fertilizer dose used was 6 t/ha FYM and 120:60:40 NPK (urea, di-ammonium phosphate, and muriate of potash) where 50% N was administered at basal and the rest 50% at knee high (35 DAS) and tasseling stage (80 DAS). Weeding and hoeing were done before tasseling at the knee-high stage. Irrigation was performed at key times, such as knee-high, tasseling, and silking. Emamectin benzoate (0.4 g/L) and Spinosad (0.3 ml/L) were sprayed alternatively in the evening for three days at a 10-day interval to control autumn armyworms in the field.
Artificial inoculation
The initial spray of the inoculum was done using a hand atomizer at a concentration of 2.25 ×10⁴ on the 35th day after sowing during the twilight hour. The spray was often administered to the whorl of the plants (whorl placement method), where it was maintained for a longer time enough to facilitate spore germination. The second spray was applied 15 days following the first vaccination. For consistent dissemination over the leaves, Allvit, a surfactant that works as a spreading and wetting agent, was combined at 1 ml/lt. Spraying water caused high humidity (>90% relative humidity) and leaf wetness for the next two days to encourage disease growth (Abera et al., 2016).
Table 1: List of maize genotypes used for screening against northern leaf blight under artificial epiphytotic conditions during 2020/21 in Rampur, Chitwan.
|
E. N |
Genotypes |
E.N. |
Genotypes |
E.N. |
Genotypes |
|
1 |
RL_100 |
35 |
RL_265 |
69 |
RML_57 |
|
2 |
RL_101 |
36 |
RL_270 |
70 |
RML_58 |
|
3 |
RL_105 |
37 |
RL_271 |
71 |
RML_62 |
|
4 |
RL_111 |
38 |
RL_272 |
72 |
RML_65 |
|
5 |
RL_133 |
39 |
RL_279 |
73 |
RML_68_1 |
|
6 |
RL_150 |
40 |
RL_280 |
74 |
RML_68_2 |
|
7 |
RL_153 |
41 |
RL_281_1 |
75 |
RML_76 |
|
8 |
RL_165 |
42 |
RL_281_2 |
76 |
RML_83 |
|
9 |
RL_173 |
43 |
RL_283 |
77 |
RML_84 |
|
10 |
RL_13 |
44 |
RL_286 |
78 |
RML_85 |
|
11 |
RL_180 |
45 |
RL_288 |
79 |
RML_86 |
|
12 |
RL_202 |
46 |
RL_290 |
80 |
RML_87 |
|
13 |
RL_21 |
47 |
RL_291 |
81 |
RML_88 |
|
14 |
RL_213 |
48 |
RL_297 |
82 |
RML_89 |
|
15 |
RL_215 |
49 |
RL_142_2 |
83 |
RML_93 |
|
16 |
RL_217 |
50 |
RL_30_3 |
84 |
RML_96 |
|
17 |
RL_221 |
51 |
RL_35_1 |
85 |
Pop_corn_2 |
|
18 |
RL_293 |
52 |
RL_84 |
86 |
Pop_corn_Gorkha_3 |
|
19 |
RL_229 |
53 |
RML_107 |
87 |
Pop_corn_madhyapahad |
|
20 |
RL_232 |
54 |
RML_114 |
88 |
Pop_duplicaiton |
|
21 |
RL_99 |
55 |
RML_115 |
89 |
Pop_corn_Y+W(Y) |
|
22 |
RL_235 |
56 |
RL_269 |
90 |
Australian_1_sanodana |
|
23 |
RL_236 |
57 |
RML_138 |
91 |
Madhyapahad_ratokande |
|
24 |
RL_238 |
58 |
RML_142 |
92 |
Australian_thulodana(W) |
|
25 |
RL_239 |
59 |
RML_144 |
93 |
Pop_corn_budhokande2 |
|
26 |
RL_240 |
60 |
RML_146 |
94 |
ID_8002(w) |
|
27 |
RL_241 |
61 |
RML_147 |
95 |
ID_7147(w) |
|
28 |
RL_242 |
62 |
RML_149 |
96 |
ID_8007® |
|
29 |
RL_243 |
63 |
RML_150 |
97 |
ID_8004Y® |
|
30 |
RL_244 |
64 |
RML_170 |
98 |
ID_7964(Y) |
|
31 |
RL_246 |
65 |
RML_188 |
99 |
ID_8007YR® |
|
32 |
RL_248 |
66 |
RML_191 |
100 |
Rampur Composite |
|
33 |
RL_249 |
67 |
RML_2 |
101 |
Rampur Hybrid 10 |
|
34 |
RL_251 |
68 |
RML_4 |
Table 2: Disease rating scale of northern leaf blight of maize.
|
Rating scale |
Degree of infection |
|
1 |
Plants with one or two to few scattered lesions on lower leaves (Resistant) |
|
2 |
Moderate number of lesions on leaves, affecting <25% of the leaf area (Moderately Resistant) |
|
3 |
Abundant lesions on lower leaves and few on other leaves affecting 26-50% of leaf area (Moderately Susceptible) |
|
4 |
Lesions abundant on lower and mid leaves, extending to upper leaves affecting 51-75% of leaf area (Susceptible) |
|
5 |
Lesions abundant on almost all leaves, plants prematurely dried or killed with 76-100% of the leaf area affected (Highly Susceptible) |
Disease assessment
Estimation of disease reaction and scoring: Ten plants were randomly selected and labeled at each plot before inoculation. Such plants were utilized for disease evaluation at 10-day intervals beginning when 2-3 lesions were identified in basal leaves, using a 0-5 grading scale as given by CIMMYT (1985), Singh et al. (2004) as shown in Table 2. The initial scoring occurred 60 days after sowing and was repeated six times (i.e., six severity scores).
Estimation of infected leaves, lesion number, and lesion size: The total number of infected leaves from 10 tagged sample plants was tallied across all six scoring days. The total number of lesions was also calculated using two leaves from each sample (one from the ear and one above the ear). To estimate the rate of lesion expansion, a lesion from each plant sample was marked with a red fabric, and its size (length and width in mm) was measured each time with a digital vernier caliper (Abebe et al., 2008). The number and size of lesions were assessed on the 70th, 80th, and 90th days following sowing (i.e., on the 2nd, 3rd, and 4th scoring).
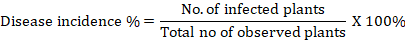
Estimation of disease incidence percentage: It refers to the proportion of experimental individuals who have the disease symptoms out of the total number of experimental subjects tested. The incidence of each treatment for northern leaf blight was visually assessed at weekly intervals in all plots beginning with the first symptomatic appearance. For each plot, the number of infected maize plants was counted and expressed as a percentage of all maize plants. The percentage of disease incidence was calculated by using the formula of Wheeler (1969) as:
Estimation of percent disease index (PDI)/ disease severity percentage/ percentage severity index (PSI): It simply refers to the severity of the disease infection. The disease score was transformed into a severity percentage using Wheeler’s (1969) algorithm as follows:

Estimation of Area under the disease progress curve (AUDPC): It is a quantitative measurement of the progression of the disease. The AUDPC was calculated using the disease severity data by the formula given by Campbell and Madden (1990).
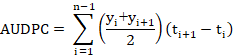
Where “t” is the time of each reading, “y” is the percent disease severity at each reading and “n” is the number of readings.
Estimation of sporulation in lesion
After the final scoring, leaves with identifiable lesions were separated from five different sample plants representing all treatments and put into labeled paper bags. From each leaf, lesions of 1 cm2 were measured, a set volume of distilled water (1 ml) was added to a petri plate, the lesion was scraped for two minutes with the forceps and needle to release conidia for conidial measurement with three replications. The number of conidia in the suspension was measured using the haemocytometer based on 5 observations per leaf for minimizing the error.
Estimation of grain yield
Grain yield was assessed by using the formula as mentioned by Tandzi and Mutengwa (2020).
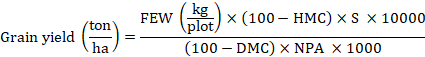
Here, FEW= Fresh Ear weight, HMC= Moisture content at harvest, DMC= Desired moisture content i.e., 14%, S= Shelling coefficient i.e., 0.8, and NPA= Net plot area in m2
Statistical data analysis
The experiment was carried out under field conditions using a rod row design with two rows. The experiment’s results were entered and saved in Microsoft Excel. Multiple packages were used to do multivariate analysis in R (4.0.2). Using the Facto Mine R and factoextra packages, the Ward’s techniques of cluster analysis, boxplot, correlation analysis, principal components analysis, eigenvalues, eigenvectors, and 2D biplots were achieved.
Results and Discussion
Correlation assessment and principal component analysis
The correlation coefficient between different disease parameters and yield clearly represented some aspects of the relationship as shown in Figure 2. All were significant at 0.05% level of significant. The disease parameters like percent disease index (PDI), area under disease progress curve (AUDPC), disease incidence % (DI %), infected leaves per plant (IL/P), lesion length (LL), lesion breadth (LB) and sporulation (spores/ml) were positively correlated with each other while all were negatively correlated to the grain yield (t/ha) except lesion number (LN) which nearly showed no relationship. These positive correlation coefficients between disease components indicated that it has the direct relationship between the components to cause the northern leaf blight of maize. The negative correlation coefficient between disease components and grain yield signifies that an increase in the intensity of disease parameters directly hampers the yield production.
The results of the principal component analysis (PCA) clearly showed that three of the nine principal components were significant (eigenvalues > 1) and accounted for 73.5% of the variance. According to Figures 3 and 4, PC2 and PC3 each accounted for 15.30% and 13.60% of the variation, respectively, with PC1 accounting for the largest variance (44.60%). For future analysis, only these three components with eigenvalues greater than 1 were taken into consideration. The overall variance in the data was better described by principal components with eigenvalues > 1 than by individual quality. The proper
value evaluates the significance and contribution of each component to the overall variance, whereas each coefficient of the proper vector displays the percentage of each original variable’s contribution to the major component it is related to. The higher the coefficient increases, regardless of its sign, the more successful the relevant characteristics will be in identifying inbred lines (Dhakal et al., 2020).
As seen in Figure 5, PC1 was generally related with traits related to quantitative resistance, PC2 was related to lesion number and lesion breadth, PC3 was mostly concerned with grain yield, and PC4 with sporulation. In PC1 (44.60%), the variables like PDI (0.84), AUDPC (0.78), infected leaves per plant (0.75), and DI % (0.66) were positively correlated. The second principal component PC2 (15.30%), showed a positive correlation with lesion number (0.42) and lesion breadth (0.38). PC3 (13.6%) showed a highly positive relationship with grain yield (0.6) while PC4 was contributed positively by sporulation (0.56). The magnitude and direction of various traits in the different principal components are represented as a biplot as shown in Figures 6 and 7.
Ward’s method and euclidean distance
Grouping of 101 maize inbred lines were done by using Ward’s minimum variance clustering method which is very appealing as it minimizes within cluster variance. The maize inbred lines were grouped into 3 clusters as listed in Table 3. The number of clusters was determined by using the gap statistic method as represented in Figure 9. Clustering was done based on various disease parameters contributing to quantitative resistance like percent disease index (PDI), disease incidence % (DI %), AUDPC, infected leaves per plant (IL/P), lesion number per leaf (LN), lesion length (LL), lesion breadth (LB), sporulation (spores/ml)
Table 3: Distribution of 101 genotypes of maize in 3 different clusters for identification of resistant sources.
|
Cluster number |
Genotypes serial Numbers |
Total number of genotypes |
|
1 |
1,6,8,10,12,14,19,25,28,30,38,40,42,48,51,53,54,58, 61,62,64,67,73,78,84,86,87,88,90,91,96,97,98 |
33 |
|
II |
2,3,4,11,21,29,31,33,36,41,44,46,57,59,63,74,76,81, 82,83,85,92,93,94, 99,100,101 |
27 |
|
III |
5,7,9,13,15,16,17,18,20,22,23,24,26,27,32,34,35,37, 39,43,45,47,49,50,52,55,56,60,65,66,68,69,70,71, 72,75,77,79,80,89,95 |
41 |
and grain yield (t/ha) shown in Figure 8. The inter-cluster distances among 3 clusters were shown in Table 5 which is used to measure the genetic divergence among the maize inbred lines.
From Table 3, Cluster III was the largest cluster as it comprises 41 inbred lines, while cluster I and cluster II included 33 and 27 inbred lines, respectively. Mean performance of different components in each cluster from Table 4 revealed that the lowest values for PDI (24%), AUDPC (725), DI % (63%), infected leaves per plant (2.3), lesion number per leaf (1.79), lesion length (55 mm), lesion breadth (5.94 mm) and sporulation (0.78 × 10⁴) was found in cluster II. Highest grain yield (1.6 t/ha) was also reported in cluster II. The clustering clearly revealed that the genotypes under cluster II might be promising for further maize breeding programs. The highest inter-cluster distance was found between cluster II and cluster III (4.19) and the lowest was found between cluster I and cluster III (2.24). It revealed that genetic variation exists among 101 inbred lines against northern leaf blight. Similar to this study, Pasha et al. (2013) used cluster analysis with Ward’s method and Euclidean distance criteria to divide the rice genotypes into three groups based on field traits (infection type, panicle blast severity, panicle and leaf blast disease progress). All resistant varieties were placed in the first group. Sultana et al. (2018) revealed that the pathogenic variation exists among 169 isolates from mean-inter cluster distance values. The inter-cluster distance is due to the heterogenous nature of the inbred lines between the clusters. The cluster’s inbred lines were closely connected, as shown by the lowest distance (Dhakal et al., 2020).
Table 4: Mean performance of different components in each cluster.
|
Characteristics |
Cluster I, N*=33 |
Cluster II, N= 27 |
Cluster III, N=41 |
|
Percent disease index (PDI) |
38 |
24 |
52 |
|
AUDPC |
1195 |
725 |
1895 |
|
Disease incidence % |
86 |
63 |
95 |
|
Infected leaves per plant |
3.64 |
2.30 |
5.47 |
|
Lesion number per leaf |
2.05 |
1.79 |
3.32 |
|
Lesion length (mm) |
79 |
55 |
77 |
|
Lesion breadth (mm) |
7.51 |
5.94 |
7.14 |
|
Sporulation (spores/ml) |
2.22 x 10⁴ |
0.78 x 10⁴ |
1.29 x 10⁴ |
|
Yield (t/ha) |
1.28 |
1.61 |
1.09 |
N* represents the number of genotypes in the cluster.
Table 5: Mean intercluster distance values of each cluster of 101 maize inbred lines.
|
Cluster 1 |
Cluster 2 |
Cluster 3 |
|
|
Cluster 1 |
0 |
||
|
Cluster 2 |
2.82 |
0 |
|
|
Cluster 3 |
2.24 |
4.19 |
0 |
To guarantee the successful and efficient use of hybridization programs, a diversity study of Exseohilum turcicum infected maize inbred lines is crucial. The greater the inter-cluster distance range, the more diverse the populations are. Divergence values can be used to determine the cluster type for further selection and to choose the parents to employ in hybridization or breeding operations (Jagadeb and Samal 1991). The genetic diversity between and within clusters increases with increasing intra- and inter-cluster distances. To achieve maximal heterosis in hybridization and to be employed in the crossover program to get a wide range of diversity among the segregated generations, the selection of parents from distant groups was thus predicted (Sharma et al., 2020). Therefore, selecting parents from clusters II and III might be useful for producing long-lasting NLB-resistant cultivars. In contrast, clusters I and III had the smallest inter-cluster distance, indicating that their genotypes were the closest to one another. As a result, selection will not work since their genetic distance was just estimated.
Variability of quantitative traits for aggressiveness
The boxplot in Figure 10 represents the basic statistics of different traits, which contribute to the quantitative resistance of the host. Most important disease parameters like AUDPC (725), PDI (24) and DI % (63) has lowest mean value in the genotypes of Cluster II, whereas the highest mean values (1895, 52 and 95, respectively) were reported in the genotypes of cluster III. Major components of the aggressiveness of the pathogens are sporulation (0.78 x 10⁴ spores/ml), lesion length (55 mm), and lesion breadth (5.94 mm) which also has the lowest mean value in the genotypes of cluster II. The mean yield was reported highest (1.61 t/ha) in the genotypes of cluster II while minimum mean yield in cluster III (1.09 t/ha).
In NCLB studies, resistance expression included lesion type, disease score, area under the disease progress curve (AUDPC), yield loss, kernel weight loss, number of lesions per plant, lesion size and number of conidia produced on lesion segments (Zhu et al., 2023). Quantitative trait variation among populations is a fundamental need for adaptation. The pathogen life cycle divides aggression into simple quantitative features. Typically, epidemic rates are used to directly assess aggression (Cumagun and Miedaner, 2003). Aggression is measured by a range of quantitative features that are manifested during the host-pathogen interaction between genotypes of plants and pathogens. These characteristics known as aggressiveness components include lesion size, spore production rate, infection efficiency, and latent time (Sackett and Mundt, 2005). Their capacity for reproduction has an impact on their ability to spread disease. Sporulation is measured by the number of spores produced per infected leaf area (Clifford and Clothier, 1974).
Conclusions and Recommendations
The armaments race between host and pathogen is a persistent occurrence in evolution. The goal of gathering, examining, and characterizing unexplored genotypes is to find donors with numerous NLB resistance genes who can be employed right away in breeding operations. The unique inbred lines like RL_101, RL _05, RL_111, RL_180, RL_99, RL_243, RL_246, RL_249, RL_270, RL_281_1, RL_286, RL_290, RML_38, RML_144, RML_150, RML_68_2, RML_83, RML_88, RML_89, RML_93, Popcorn_2, Madhyapahad_ratokande, Popcorn_budhokande_2, ID_8002(w), and ID_8007YR® having resistance to northern leaf blight can be explored for the discovery of novel genes for broadening the gene pool to combat the pathogen competition. It was successfully established utilizing Ward’s clustering and genetic divergence analysis using Euclidean distance. The inbred lines’ rich diversity was separated into clusters, and this process revealed the inter-cluster distance between populations and individuals, which may be used to pick individuals from different clusters. It is hard to predict whether or not Ht genes will contribute to more effective long-term management of NCLB, although they may provide some disease protection when quantitative resistance is increased and introgressed into well-known maize lines or when paired with quantitative resistant traits. The knowledge gained from this investigation will aid in the preservation and use of priceless inbred lines of maize. But the research lacks multi location trial and genetic-environment interaction so this might be the future scope of the research.
Acknowledgements
The authors express their heartfelt gratitude to the Professor Sundar Man Shrestha, PhD and Adjunct Professor Hira Kaji Manandhar, PhD of Department of Plant Pathology, AFU for their valuable suggestions and feedbacks during the manuscript preparation.
Novelty Statement
The research focuses the overall performances of the genotypes of maize from various dimension for the resistance against northern leaf blight.
Author’s Contribution
Shishir Sharma: Conduct research process, data generation, data analysis, and draft preparation.
Suk Bahadur Gurung: Data generation, manuscript proofreading.
Ritesh Kumar Yadav: Design research, proofreading, and data analysis.
Bibek Phularan and Laxmi Prasad Joshi: Data collection.
Data availability
The corresponding author is willing to provide the data that back up the study’s conclusions upon reasonable request.
Funding
No any funding agencies for the study.
Ethics approval and consents
Any opinions, results, conclusions, or recommendations expressed in this publication are solely those of the authors and do not necessarily represent the views of the institutions with which they are associated.
Conflict of interest
The authors have declared no conflict of interest.
References
Abebe, D., N. Singburaudom, S. Sangchote and E. Sarobol. 2008. Evaluation of maize varieties for resistance to northern leaf blight under field conditions in Ethiopia. Kasetsart J. Natl. Sci., 42(1): 1–10.
Abera, W., H. Shimelis, J. Derera, M. Worku and M. Laing. 2016. Northern leaf blight response of elite maize inbred lines adapted to the mid-altitude sub-humid tropics. Cereal Res. Commun., 44(1): 141–152. https://doi.org/10.1556/0806.43.2015.037
Barad, A.J., S.K. Singh, G.J. Bhagora and A.H. Barad. 2019. Efficacy of different fungicides against Exserohilum turcicum causing turcicum leaf blight disease in maize. Int. J. Curr. Microbiol. Appl. Sci., 8(08): 108–114. https://doi.org/10.20546/ijcmas.2019.808.013
Campbell, C. L., and L. V. Madden. 1990. Introduction to plant disease epidemiology. John Wiley and Sons.
Carpane, P.D., A.M., Peper and F. Kohn. 2020. Management of northern corn leaf blight using Nativo (Trifloxistrobin + Tebuconazole) fungicide applications. Crop Prot., 127: 104982. https://doi.org/10.1016/j.cropro.2019.104982
Carson, M.L., 1995. A new gene in maize conferring the “chlorotic halo” reaction to infection by Exserohilum trucicum. Plant Dis., 79: 717–720. https://doi.org/10.1094/PD-79-0717
CIMMYT, 1985. Managing trials and reporting data for CIMMYT’s International maize testing program. CIMMYT, El Batan, Mexico.
Clifford, B.C. and R.B. Clothier. 1974. Physiologic specialization of Puccinia hordei on barley hosts with non-hypersensitive resistance. Trans. Br. Mycol. Soc., 63(3): 421-430. https://doi.org/10.1016/S0007-1536(74)80088-4
Cumagun, C.J.R. and T. Miedaner. 2003. Aggressiveness of 42 isolates of Gibberella zeae (Fusarium graminearum) in wheat under field and greenhouse conditions Aggressivität von 42 Gibberella zeae (Fusarium graminearum)-Isolaten bei Weizen im Feld und Gewächshaus. Z. Pflanzen. Pflanzenschutz (J. Plant Dis. Prot.) pp. 554-559.
Dhakal, A., A. Pokhrel, S. Sharma and A. Poudel. 2020. Multivariate analysis of phenotypic diversity of rice (Oryza sativa L.) landraces from Lamjung and Tanahun Districts, Nepal. Int. J. Agron., 2020: 1-8. https://doi.org/10.1155/2020/8867961
Dong, J., Y. Fan, X. Gui, X. An, J. Ma, Z. Dong, O.H. Ht and H. Ht. 2008. Geographic distribution and genetic analysis of physiological races of Setosphaeria turcica in northern China mycotoxin laboratory, Agricultural University of Hebei, Baoding, Hebei 071001, China Department of Life Science, Tangshan Teachers College. Am. J. Agric. Biol. Sci., 3(1): 389–398. https://doi.org/10.3844/ajabssp.2008.389.398
Ferguson, L.M. and M.L. Carson. 2007. Temporal variation in Setosphaeria turcica between 1974 and 1994 and origin of races 1, 23, and 23N in the United States. Phytopathology, 97(11): 1501–1511. https://doi.org/10.1094/PHYTO-97-11-1501
Galiano-Carneiro, A.L. and T. Miedaner. 2017. Genetics of resistance and pathogenicity in the maize/setosphaeria turcica pathosystem and implications for breeding. Front. Plant Sci., 8: 1–13. https://doi.org/10.3389/fpls.2017.01490
Hooda, K.S., M.K. Khokhar, M. Shekhar, C.G. Karjagi, B. Kumar, N. Mallikarjuna, R.K. Devlash, C. Chandrashekara and O.P. Yadav. 2017. Turcicum leaf blight sustainable management of a re-emerging maize disease. J. Plant Dis. Prot., 124(2): 101–113. https://doi.org/10.1007/s41348-016-0054-8
Hooker, A.L., 1963. Inheritance of chlorotic-lesion resistance to Helminthosporium turcicum in seedling corn. Phytopathology, 53: 660–662.
Hooker, A.L., 1977. A second major gene locus in corn for chlorotic‐lesion resistance to Helminthosporium turicum 1 . Crop Sci., 17(1): 132–135. https://doi.org/10.2135/cropsci1977.0011183X001700010035x
Hooker, A.L., 1981. Resistance to Helminthosporium turcicum from Tripsacum floridanum incorporated into corn. Maize Genet. Coop. Newsl., 55: 87–88.
Jagadev, P.N. and K.M. Samal. 1991. Multivariate analysis in Niger (Guizotia abyssinica cass.). Indian J. Genet. Plant Breed., 51(4): 392-394.
Kumar, S., K.T.P. Gowda, S.K. Pant, M. Shekhar, B. Kumar, B. Kaur, K.H. Chchi, O.N. Singh and B.H. Parsanna. 2011. Sources of resistance and to Exserohilum turcicum (Pass.) and Puccinia polysora (Underw.) incitant of Turcicum leaf blight and polysora rust of maize. Arch. Phytopathol. Plant Prot., 44(6): 528–536. https://doi.org/10.1080/03235400903145558
Lipps, P.E., R.C. Pratt and J.J. Hakiza. 1997. Interaction of Ht and partial resistance to Exserohilum turcicum in maize. Plant Dis., 81(3): 277–282. https://doi.org/10.1094/PDIS.1997.81.3.277
Mallowa, S.O., P.D. Esker, P.A. Paul, C.A. Bradley, V.R. Chapara, S.P. Conley and A.E. Robertson. 2015. Effect of maize hybrid and foliar fungicides on yield under low foliar disease severity conditions. Phytopathology, 105(8): 1080–1089. https://doi.org/10.1094/PHYTO-08-14-0210-R
Mubeen, S., M. Rafique, M.F.H. Munis and H.J. Chaudhary. 2017. Study of southern corn leaf blight (SCLB) on maize genotypes and its effect on yield. J. Saudi Soc. Agric. Sci., 16(3): 210-217. https://doi.org/10.1016/j.jssas.2015.06.006
Mueller, D.S., K.A. Wise, A.J. Sisson, T.W. Allen, G.C. Bergstrom, K.M. Bissonnette, C.A. Bradley, E. Byamukama and W.J. Wiebold. 2020. Corn yield loss estimates due to diseases in the United States and Ontario, Canada, from 2016 to 2019. Plant Health Progress, 21(4): 238–247. https://doi.org/10.1094/PHP-05-20-0038-RS
NARC, 2022. Accessed on 24th September 2022. Retrieved from: https://narc.gov.np/national-maize-research-program/.
NMRP, 2013. Annual report 2069/70 (2012/13). National Maize Research Program, NARC, Rampur, Chitwan, Nepal.
Ogliari, J.B., M.A. Guimarães and L.E.A. Camargo. 2007. Chromosomal locations of the maize (Zea mays L.) Htp and rt genes that confer resistance to Exserohilum turcicum. Genet. Mol. Biol., 30(3): 630–634. https://doi.org/10.1590/S1415-47572007000400021
Ogliari, J.B., M.A. Guimarães, I.O. Geraldi and L.E.A. Camargo. 2005. New resistance genes in the Zea mays - Exserohilum turcicum pathosystem. Genet. Mol. Biol., 28(3): 435–439. https://doi.org/10.1590/S1415-47572005000300017
Pasha, A., N. Babaeian-Jelodar, N. Bagheri, G. Nematzadeh and V. Khosravi. 2013. A field evaluation of resistance to Pyricularia oryzae in rice genotypes. Int. J. Agric. Crop Sci., 5(4): 390-394.
Payak, M.M. and R.C. Sharma. 1985. Maize diseases and approaches to their management in India. Trop. Pest Manage., 31(4): 302–310. https://doi.org/10.1080/09670878509371006
Prasanna, B.M., 2016. Developing and deploying abiotic stress-tolerant maize varieties in the tropics: challenges and opportunities. Mol. Breed. Sustain. Crop Improv., pp. 61-77. https://doi.org/10.1007/978-3-319-27090-6_3
Ribeiro, R.M., A.T.D.A. Júnior, G.F. Pena, M. Vivas, R.N. Kurosawa and L.S.A. Gonçalves. 2016. History of northern corn leaf blight disease in the seventh cycle of recurrent selection of an UENF-14 popcorn population. Acta Sci. Agron., 38(4): 447–455. https://doi.org/10.4025/actasciagron.v38i4.30573
Rijal, T.R., N. Dangal and D.C. Paudel. 2014. Management of maize diseases through host resistance. In: Khadka Y.G., Y.P. Giri, B.P. Sah, B.N. Mahato, S.P. Khatiwada, M. Bhatta, B.K. Chettri, A.K. Gautam, A.R. Ansari, J.D. Ranjit, D. Gauchan, R. Shrestha and B. Sapkota (eds). 2014. Proceedings of the 27th National Summer Crops Workshop, held on 18 – 20th April 2013 at National Maize Research Program, Rampur, Chitwan. Volume: 2. Nepal Agricultural Research Council.
Sackett, K.E. and C.C. Mundt. 2005. The effects of dispersal gradient and pathogen life cycle components on epidemic velocity in computer simulations. Phytopathology, 95(9): 992-1000. https://doi.org/10.1094/PHYTO-95-0992
Sharma, S., A. Pokhrel, A. Dhakal and A. Poudel. 2020. Agro-morphological characterization of rice (Oryza sativa L.) landraces of Lamjung and Tanahun District, Nepal. Ann. Plant Sci., 9(2): 3731–3741. https://doi.org/10.1155/2020/1589150
Shekhar, M. and S. Kumar. 2012. Inoculation techniques and disease rating scales for major diseases of maize. Directoriate of maize research, Pusa campus, New Delhi.
Singh, R., V.P. Mani, K.S. Koranga, G.S. Bisht, R.S. Khandelwal, P. Bhandari and S.K. Pant. 2004. Identification of additional sources of resistance to Exserohilum turcicum in maize (Zea mays L.). Sabrao J. Breed. Genet., 36(1): 45-47.
Subedi, S., 2015. A review on important maize diseases and their management in Nepal. J. Maize Res. Dev., 1(1): 28–52. https://doi.org/10.3126/jmrd.v1i1.14242
Sultana, S., S.K. Adhikary, M.M. Islam and S.M.M. Rahman. 2018. Evaluation of pathogenic variability based on leaf blotch disease development components of Bipolaris sorokiniana in Triticum aestivum and agroclimatic Origin. Plant Pathol. J., 34(2): 93-103. https://doi.org/10.5423/PPJ.OA.08.2017.0175
Sun, X., X. Qi, W. Wang, X. Liu, H. Zhao, C. Wu and X. Chang. 2020. Etiology and symptoms of maize leaf spot caused Bipolaris spp. in Sichuan, China. Pathogens, 9(229): 1–18. https://doi.org/10.3390/pathogens9030229
Tandzi, L.N. and C.S. Mutengwa. 2020. Estimation of maize (Zea mays L.) yield per harvest area: Appropriate methods. Agronomy, 10(1): 1–18. https://doi.org/10.3390/agronomy10010029
Turgay, E.B., O. Büyük, B. Tunalı, Ö. Helvacıoğlu and Ş. Kurt. 2020. Detection of the race of Exserohilum turcicum [(Pass.) K.J. Leonard and Suggs] causing northern leaf blight diseases of corn in Turkey. J. Plant Pathol., 102(2): 387–393. https://doi.org/10.1007/s42161-019-00440-1
Vale, F.X.R. J.E. Do, Parlevliet and L. Zambolim. 2001. Concepts in plant disease resistance. Fitopatol. Brasil., 26(3): 577–589. https://doi.org/10.1590/S0100-41582001000300001
Vieira, R.A., C.A. Scapim, L.M. Moterle, D.J. Tessmann, T.V. Conrado and A.T. Amaral. 2009. Diallel analysis of leaf disease resistance in inbred Brazilian popcorn cultivars. Genet. Mol. Res., 8(4): 1427–1436. https://doi.org/10.4238/vol8-4gmr655
Wang, H., Z.X. Xiao, F.G. Wang, Y.N. Xiao, J.R. Zhao, Y.L. Zheng and F.Z. Qiu. 2012. Mapping of htnb, a gene conferring non-lesion resistance before heading to Exserohilum turcicum (Pass.), in a maize inbred line derived from the Indonesian variety Bramadi. Genet. Mol. Res., 11(3): 2523–2533. https://doi.org/10.4238/2012.July.10.7
Wheeler, B.E.J., 1969. An introduction to plant diseases. John Wiley and Sons Ltd, London, New York, Sydney, Toronto.
Zhu, X., L.M. Reid, T. Woldemariam, J. Wu, K.K. Jindal and A. Kebede. 2023. Resistance breeding for northern corn leaf blight with dominant genes, polygene, and their combinations. Effects on disease traits. Agronomy, 13(4): 1096. https://doi.org/10.3390/agronomy13041096
To share on other social networks, click on any share button. What are these?


