

Protective Effects of Atractylodes macrocephala Polysaccharide on iIELs and the IL-6, TNF-α mRNA Level in E. coli induced Diarrheal Mice


Protective Effects of Atractylodes macrocephala Polysaccharide on iIELs and the IL-6, TNF-α mRNA Level in E. coli induced Diarrheal Mice
Zhongqing Wang1, Qiuyue Wu1, Ruiling Ye1, Fazul Nabi1,4, Yangfei Shang1, Sarfaraz Ali4 and Juan Liu1,2,3*

Fig. 1.
Identification of AMP.
A, the plant and administration parts of Atractylodes macrocephala. B, the entity of AMP. C, the chemical identification of AMP (1 Molish test (+), 2 biuret reaction (-), 3 Fehling’s reagent reaction (-), 4 iodine-potassium iodide reaction (-). Note: “+” positive, “-” negative). D, the standard curve of glucose.

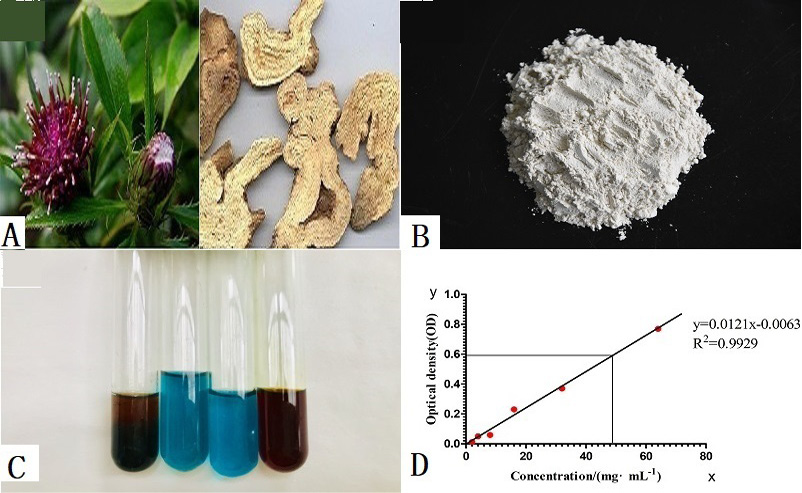
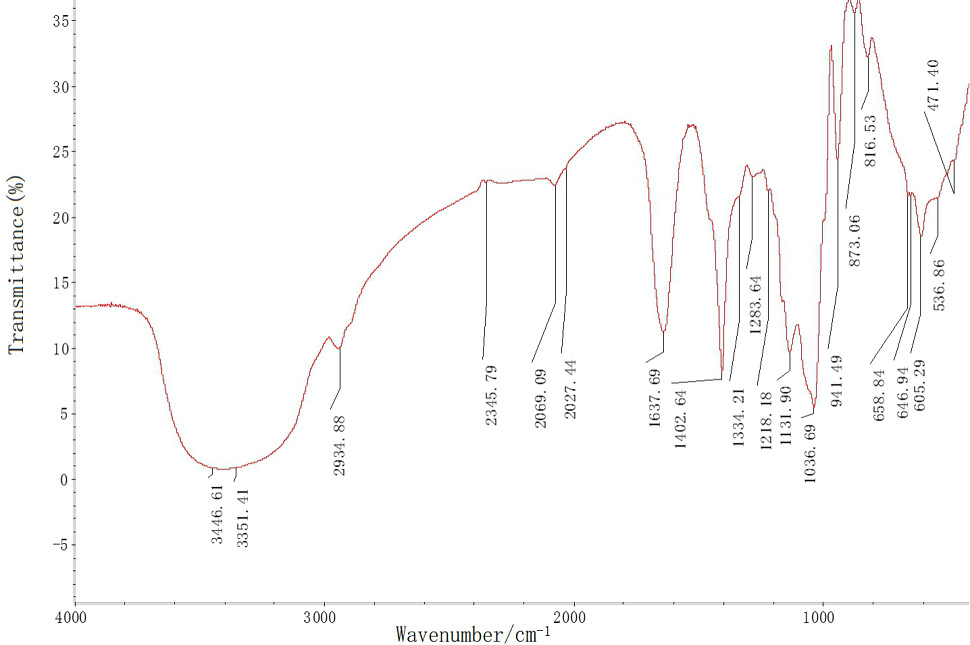
Fig. 2.
Infrared analysis atlas of AMP.

Fig. 3.
Histological sections of duodenum of mice in each group (H and E analysis). Histological sections of intestinal epithelial cells revealed A, B, C, D, E, and F for CG, IG, PG, LG, MG, and HG groups respectively. 3A showed the normal structure; 3B showed the hyperplasia, flattened crypts, pyknosis and necrosis in the intestinal epithelial cells; 3C/D/E/F showed the recovered morphology of intestinal epithelial cells (scale bar 100 μm).
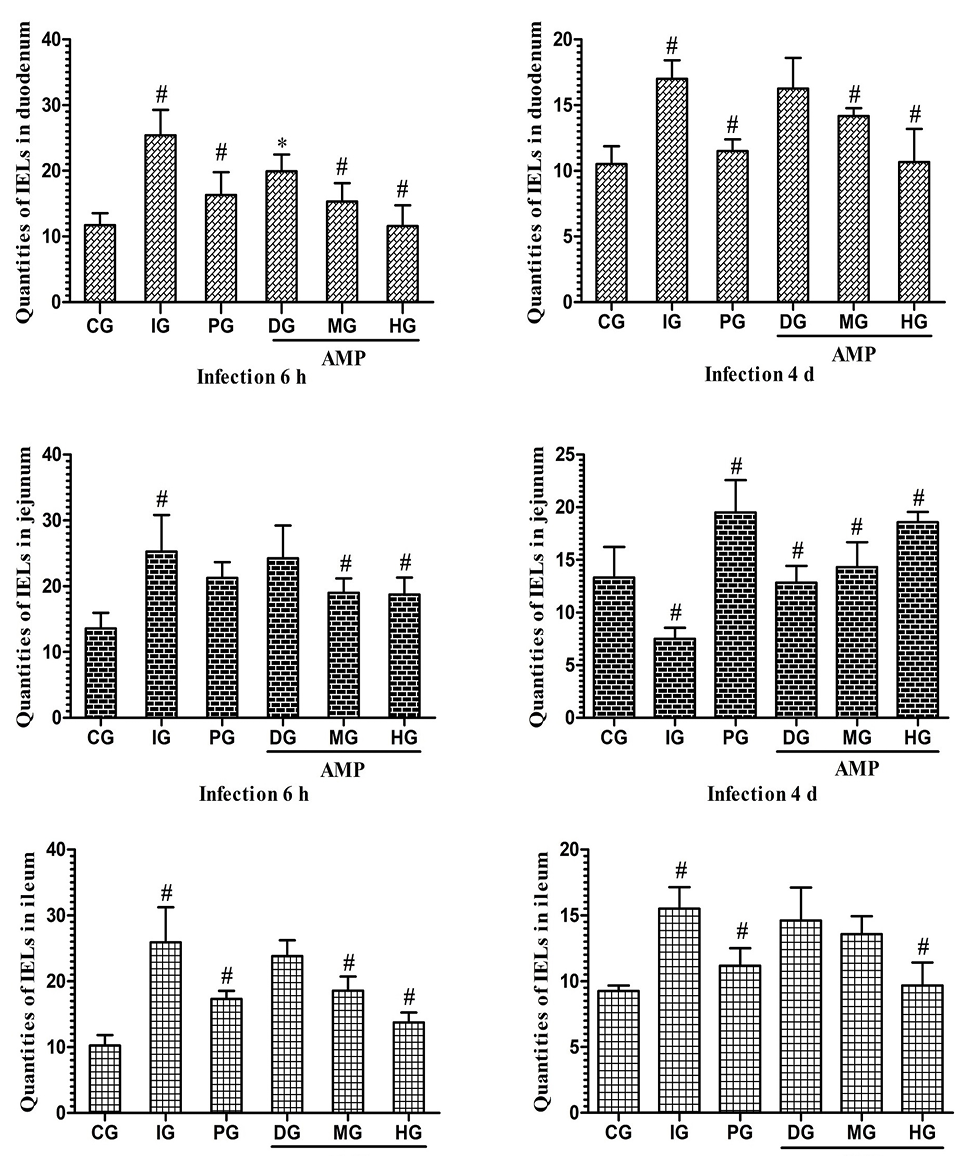
Fig. 4.
Quantity of iIELs in the small intestine of mice at 6 h and 4 d.
The quantity of iIELs in the small intestine at 6h and 4d respectively. The results are expressed in arbitrary unit and quantity is compared from the control group. Symbols # and * indicates the P<0.01 and P<0.05 respectively in the small intestine.

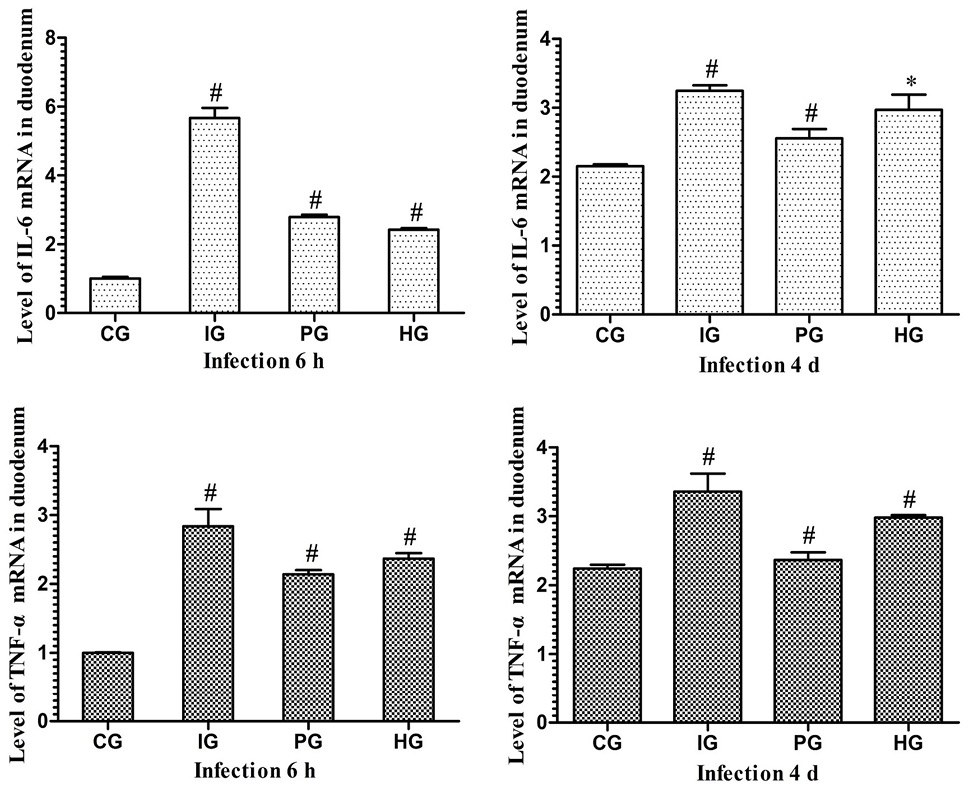
Fig. 5.
The levels of IL-6 and TNF-α mRNA in duodenum of mice at 6 h and 4 d.
Effect of AMP on IL-6, TNF-α mRNA Level in E. coli induced diarrheal mice was analyzed by reverse transcription qPCR. Results are expressed in arbitrary units; are shown relative to mRNA expression levels from the control group in duodenum of mice at 6 h and 4 d.

October 2022
Vol. 54, Iss. 5, Pages 2003-2500


