
Preliminary Development of an Enzyme-Linked Fluorescent DNA Aptamer-Magnetic Bead Sandwich Assay for Sensitive Detection of Rickettsia Cells


Preliminary Development of an Enzyme-Linked Fluorescent DNA Aptamer-Magnetic Bead Sandwich Assay for Sensitive Detection of Rickettsia Cells
John G. Bruno1*, Chien-Chung Chao2,3, Zhiwen Zhang3, Wei-Mei Ching2,3, Taylor Phillips1, Allison Edge1, Jeffery C. Sivils1
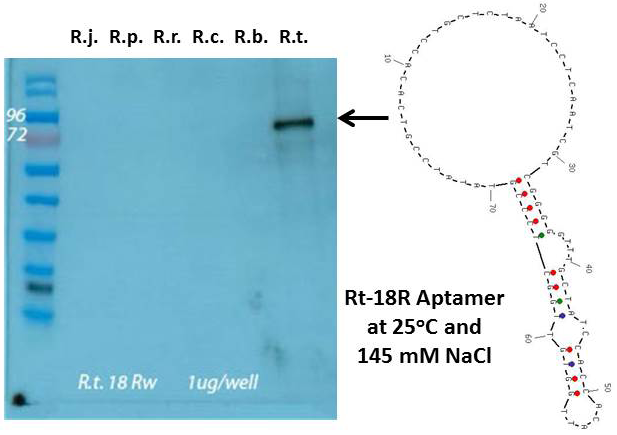
Left panel – aptamer Western blot using the Rt-18R aptamer against protein extracts and R. typhi whole cell lysate all at ~ 1 µg/well. From left to right; molecular weight markers, protein extracts from R. typhi, R. parkeri, R. rickettsii, R. conorii, R. bellii, and an R. typhi whole cell lysate. Right panel – Secondary stem-loop structure of the Rt-18R aptamer determined by energy minimization using UNAFold software with 25oC, 137 mM NaCl, and DNA parameters

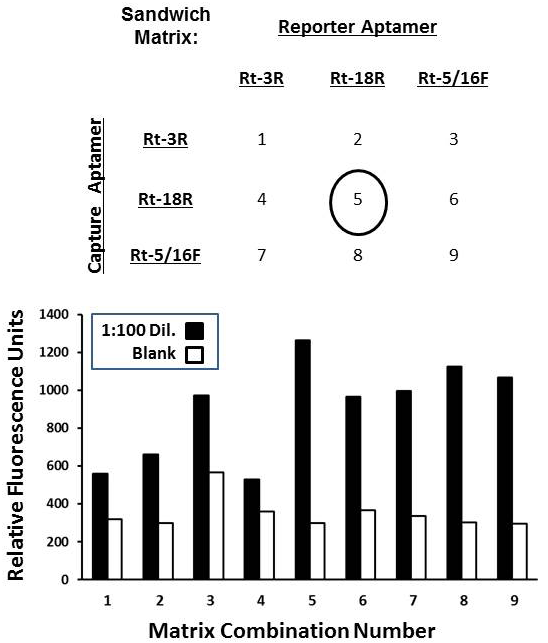
Top panel – Experimental checkerboard matrix matching the top 3 R. typhi whole cell aptamers from ELASA screening in Table 2. Sandwich assay capture and reporter aptamer pairs were assigned combination numbers 1-9 as shown. Bottom panel – results of a typical screening experiment in which the fluorescent enzyme-linked aptamer-magnetic bead sandwich assay was assessed for each combination shown in the above panel with zero (blank, white bars) and a 1:100 dilution of stock R. typhi cells (~ 1,000 cells per ml, black bars).
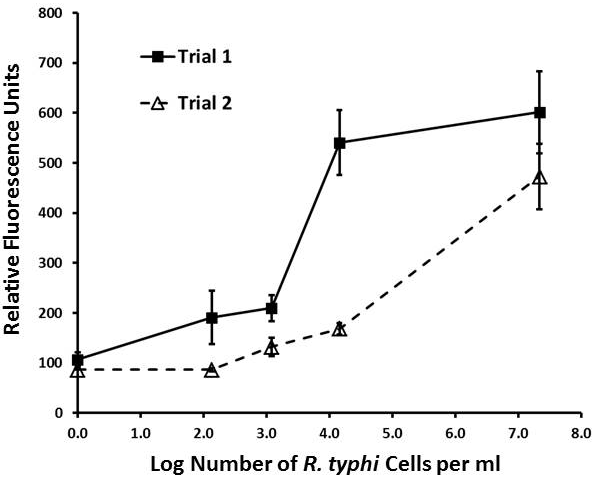
Titration results for 2 separate trials for the lyophilized homogeneous Rt-18R fluorescent aptamer-magnetic bead sandwich assay (combination 5 in Figure. 2) versus the concentration of R. typhi cells shown. Means and standard deviations of 3 readings are shown for each data point.
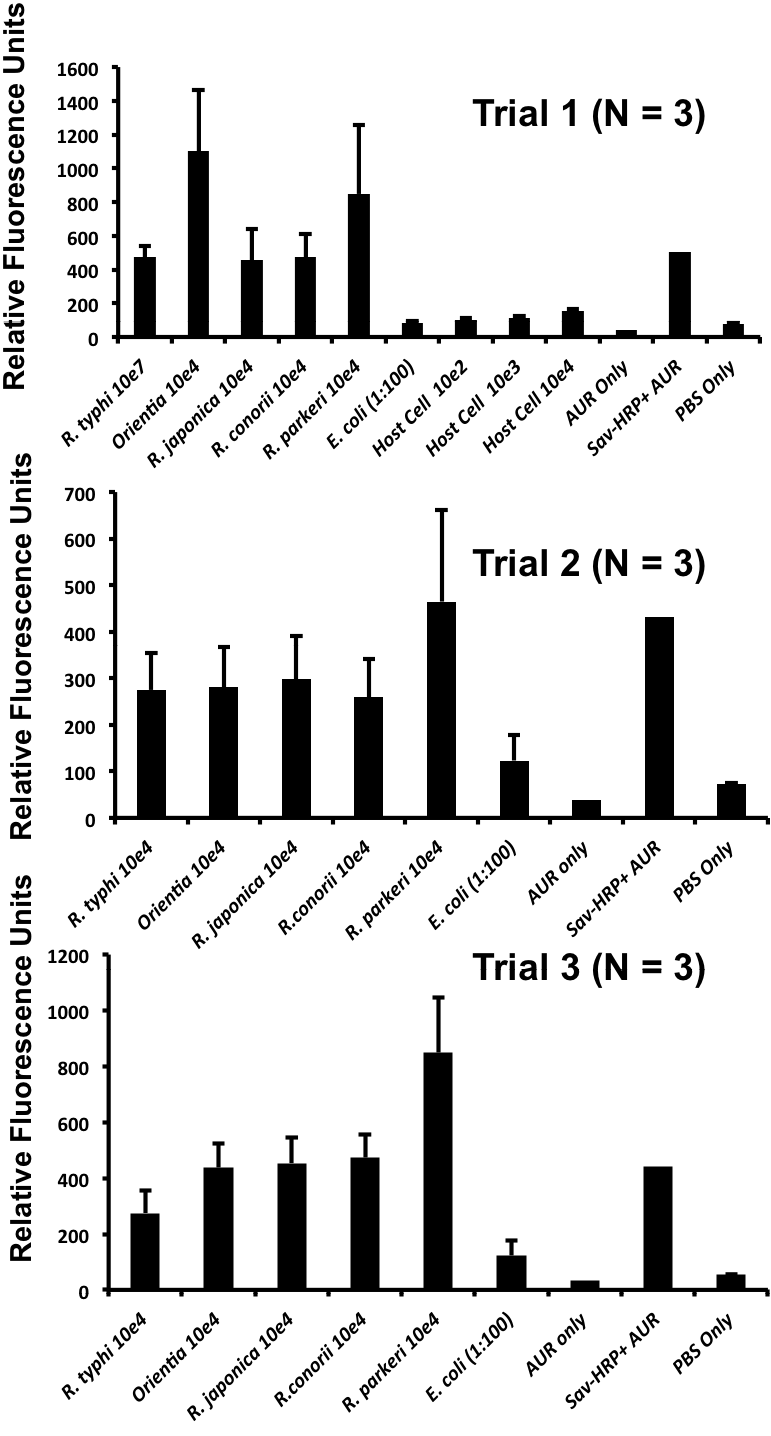
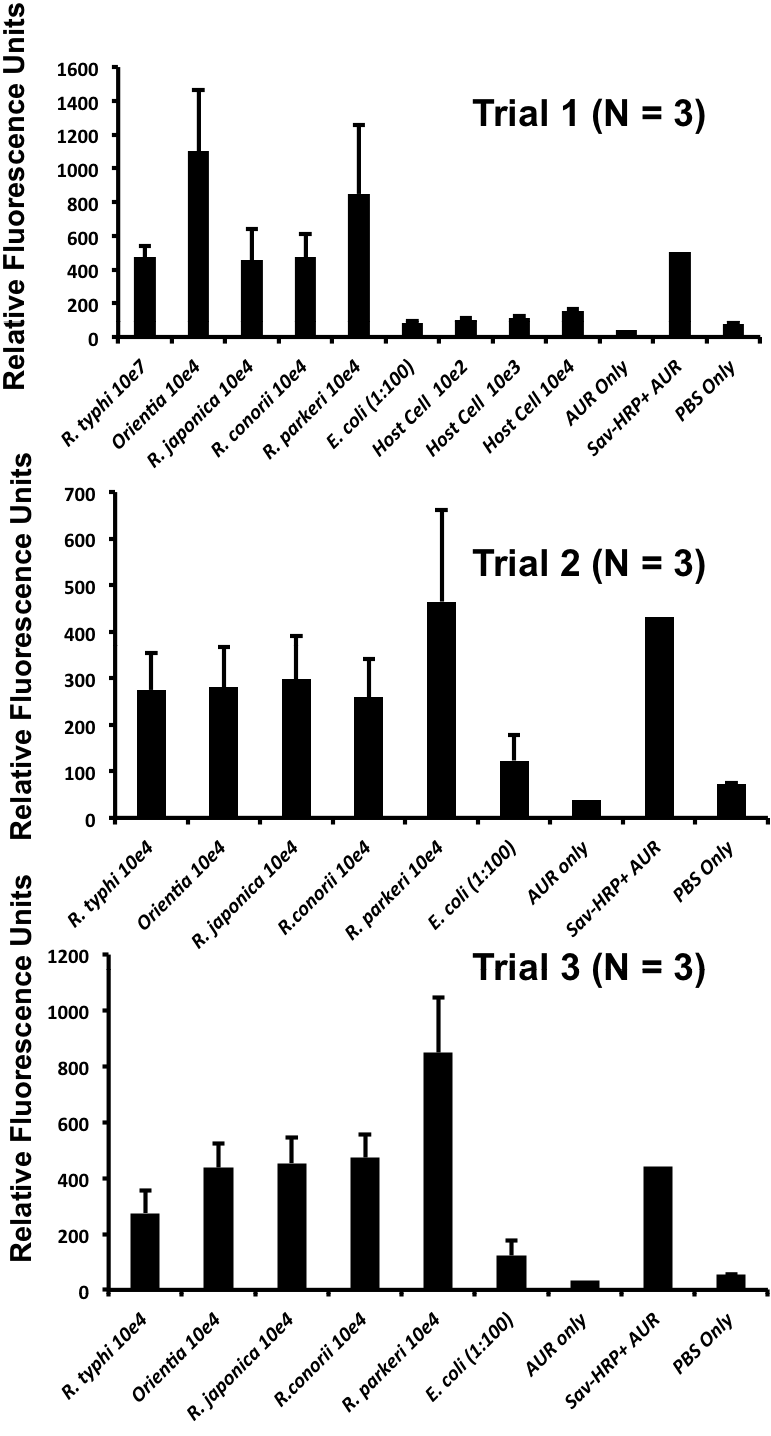
Cross-reactivity assessment of the lyophilized homogeneous Rt-18R assay versus various species of Rickettsia and Orientia, E. coli and L929 host cells at the cell concentrations (per ml) shown and with various positive and negative controls. Means and standard deviations of 3 independent readings are shown for each of the 3 trials.

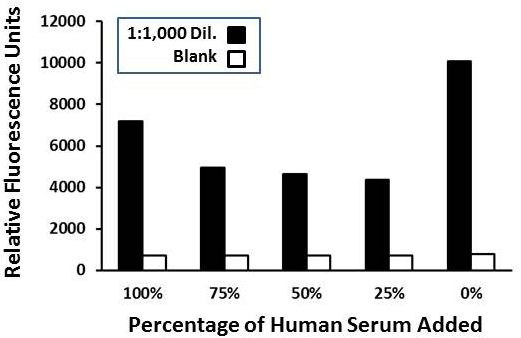
Results of the fresh reagent Rt-18R sandwich assay conducted in serum at the percentages shown with a 1:1,000 dilution of R. typhi cells (~ 100 cells per ml, black bars) versus zero added cells (blanks, white bars). AUR development was extended to ~ 2 mins which resulted in higher relative fluorescence values.

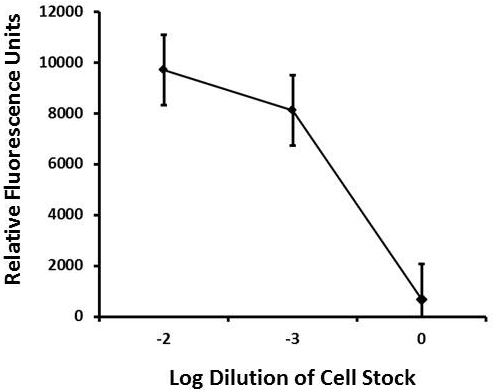
Results for use of the Rt-18R sandwich assay conducted in dog tick homogenate (5 medium-sized ticks ground into 10 ml of PBS) and then spiked with a 10-2 (~ 1,000 cells/ml) or 10-3 (~ 100 cells/ml) dilutions of R. typhi whole cells versus a zero blank. Data points represent the means and standard deviations of 3 readings.
