

Population Estimation and Habitat Analysis of Indian Grey Mongoose (Herpestes edwardsii) in Mirpur District, Azad Jammu and Kashmir


Population Estimation and Habitat Analysis of Indian Grey Mongoose (Herpestes edwardsii) in Mirpur District, Azad Jammu and Kashmir
Muhammad Furqan1, Usman Ali1,*, Anjum Ara1, Muhammad Mudassar Shahzad2, Muhammad Siddique Awan3, Riaz Aziz Minhas3, Khawaja Basharat Ahmad3, Qamar Zaman Qamar4 and Naeem Iftikhar Dar5
1Department of Zoology, Mirpur University of Science and Technology, Mirpur 10250, AJ&K
2Department of Zoology, Division of Science & Technology, University of Education Lahore
3Department of Zoology, University of Azad Jammu and Kashmir, Muzaffarabad 13100,
AJ&K
4Department of Education, Govt. of Azad Jammu and Kashmir, Muzaffarabad 13100, AJ&K
5Department of Wildlife and Fisheries, Govt. of Azad Jammu and Kashmir, Muzaffarabad 13100, AJ&K
ABSTRACT
To study distribution, population status and habitat utilization of Indian grey mongoose (Herpestes edwardsii) 18 localities were sampled from 3 zones created in Mirpur district (Azad Jammu and Kashmir). Random transects of fixed length were laid and number of active burrows counted and habitat analysed using quadrat method. Mongoose was distributed with average population density of 9.8 animal/km2, with highest (17.8 animal/Km2) density at Kalyal and lowest (3.5 animal/km2) at Panyam. Most favored altitudinal range was 450 m to-550 m (asl). Population density was the highest (12 animals/km2) in October and lowest (7.4 animals/km2) in May. Dominant vegetation included Acacia nilotica (IV= 108.9), Senegalia modesta (IV= 94.23), Broussonetia papyrifera (IV= 94.19), Calotropis procera (IV= 145.46), Dodonaea viscosa (IV=120.17), Cynodon dactylon (IV= 174.94), Chrysopogon serrulatus (IV=152.96) and Artemisia scoparia (IV= 105.69), Parthenium hysterophorus (IV= 113.82), Saccharum spontaneum (IV= 199.88) Ziziphus mauritiana (IV= 51.35), Lantana indica (IV= 78.39) and Morus alba (IV= 31.38).
Article Information
Received 19 September 2016
Revised 13 March 2017
Accepted 01 September 2018
Available online 08 February 2019
Authors’ Contribution
UA designed the study. MF, AA and MMS collected the data. MF and UA wrote the article. RAM, KBA and MSA reviewed the manuscript and analyzed the data. NID and QZQ helped in field survey and editing the manuscript.
Key words
Grey Mongoose, Population, Habitat analysis, Mirpur, AJ&K
DOI: http://dx.doi.org/10.17582/journal.pjz/2019.51.2.549.557
* Corresponding author: [email protected]
0030-9923/2019/0002-0549 $ 9.00/0
Copyright 2019 Zoological Society of Pakistan
Introduction
The Indian grey mongoose (Herpestes edwardsii Hilaire, 1818) is a small, slender carnivore with long bushy tapering tail, short legs, sharp and non-retractable claws (Nowak, 1991; Roberts, 1997). The coat is coarse, quite long and grayish to light brown in color with the individual hairs with black and white stripes, giving an overall brownish gray appearance. The muzzle which includes cheeks, edges of the ears and feet have a rusty brown shade (Roberts, 1997; Firouz, 2005; Francis, 2008; MacDonald, 2006). It is found in Saudi Arabia, Bahrain, Kuwait, Iran, Afghanistan, Pakistan, India, Sri Lanka, Nepal, and Indonesia, and has been introduced in Japan (Corbet and Hill, 1992; Wells, 1989; Wozencraft, 2005; IUCN, 2014). In Pakistan, it is widely distributed in different regions in central and northern Sindh, Cholistan, South-Western Punjab and abundantly in Rawalpindi. They are rarely present in southern Balochistan, Kohat, Bannu, Malir and in southern Sindh (Roberts, 1997; Hussain and Mahmood, 2016; Mahmood et al., 2018).
Indian grey mongoose is found in disturbed areas, dry secondary forests, thorn forests, open areas near human settlements and also observed in different areas mainly in cultivated fields, bushy vegetation, grasslands, and scrub. Sometime they move in hollow trees, holes in the ground or take shelter under rocks and in drains (Shetty et al., 1995; Roberts, 1997; Jnawali et al., 2011; Kalle et al., 2014).
Present study was aimed at estimating current population, distribution and habitat utilization by Indian grey mongoose in Mirpur.
Materials and methods
Study area
Mirpur district is situated in the southern region of Azad Kashmir. It is located at 33o14.32’N and 73o74.74’E and is 450 m asl. Topographically this region is plain, with scattered small mounds and nullahs, similar to the Pothohar region of Pakistan. Overall climate is hot and dry during summer. Study area was divided in three study zones viz. Zone A, B and C that in turn were divided in eighteen localities based on geographic conditions.
Zone A was further divided in six localities. First locality, D4 (33o13.51’N and 73o71.98’E) was slightly plain having human settlement. This locality is in developing stage leaving open plots that provide wilderness areas. Chittarpari, another locality of zone A was located at (33o12.16’N and 73o69.11’E) is adjacent to Mangla. This area has bushy vegetation with small mounds. It is thickly populated area and has poultry farm. Third locality, Bankhurma also called as Mian Muhammad Town (33o13.25N and 73o74.62’E) included a blend of hilly and plain areas, which are occupied by human settlement and side regions have wild flora in the form of Acacia nilotica and Lantana indica species. Chechian (33o10.44’N and 73o72.72’E), the fourth locality of zone A, was characterized with plain area where mostly land is used for cultivation of wheat, barley, rice and corn. Sang (33o08.37’N and 73o79.26’E) is the fifth locality of this zone. Main characteristics included plain area under agricultural use and major crops are wheat, sugarcane, barley, rice and corn. Human population is distributed in patches giving a blend of semi-urban characteristics. The sixth locality of zone A is Naugran (33o05.40’N and 73o78.06’E), which includes plain cultivation, canal banks with natural vegetation and human settlement (Fig. 1).
Six localities were included in second study zone, i.e. Zone B comprised Mehmoodabad (33o16.62’N and 73o86.28’E) was 20 Km from Mirpur and has an intermingling high and plain area. This locality is less populated by humans though natural vegetation existed at the within town. Islamgarh (33o18.48’N and 73o83.20’E), second important locality of zone B, was mainly plain and cultivated area. It is at the distance of 30 km form Mirpur district. Rahra (33o21.80’N and 73o82.59’E) was third locality of this zone, which was characterized by scanty bushy vegetation and mostly having plain land though some hillocks are found in it. The locality Palak (33o32.85’N and 73o75.45’E) of zone B, having similar topographic and habitat features of Rahra locality; however it has less human settlement. Kalyal (33o22.45’N and 73o76.57’E) and Panyam (33o24.76’N and 73o74.17’E) both were found at Chakswari town, the second major region of Mirpur district. These last two localities included plain area covered with spiny bush vegetation including Senegalia modesta, Broussonetia papyrifera and Parthenium hysterophorus. Wheat is also cultivated in this region. Thick human population though destroyed natural vegetation with in town, however allied area has enough vegetation and provide good wildlife habitat.
Zone C was divided in to six localities. First locality was Rata (33o36.81’N and 73o65.96’E) at the distance of 70 Km from Mirpur district. Land was a mixture of plain and mounds covered with the vegetation of the most type of Acacia nilotica species. Habitat was moderately degraded by the influence of thin human population. Second locality was Thara (33o42.50’N and 73o63.33’E) having similar topographic features of locality Rata. Human interference was less in this locality as compared to Rata. Sorakhi (33o37.87’N and 73o61.84’E) was third locality of zone C characterized with hillock topographic features along with plain area where less agricultural activities have been observed. Kathar (33o42.50’N and 73o63.33’E) was fourth locality of this zone, with ample vegetation cover of Senegalia modesta, Dodonaea viscosa species. Topographically this locality has a blend of small hills and plain fields, where tapering cultivation has been noted. The fifth study locality of zone C was Khadimabad (33o30.69’N and 73o64.71’E) that was mainly plain area. Less human settlement has been observed. Most of the area was under cultivation of wheat Crops. Patchy natural vegetation was found in this locality. Siakh (33o25.93’N and 73o67.48’E) was the sixth locality of this zone having similar topographic feature of Khadimabad. Both the localities were found sparsely populated.
Methodology
In each locality, 1.5 km2 area was surveyed for population estimation of Herpestes edwardsii. A 12 month surveys were conducted on selected sampling sites from April 2013 to March 2014.
Population estimation
Population was estimated at each locality by direct and indirect methods. Direct method included sighting, active burrow count following methods of Mahmood et al. (2011). Direct observation of the animals made possible by walking along the transect line. Visits were aliened at the active time of animal which was early morning and evening. Animal sighted or its signs of presence (footprints, faecal material) along transect were also noted and photographed following the method of (Hussain and Mahmood, 2016; Mahmood et al., 2018).
Population of species was estimated by applying burrows count method (Cavallini and Nel, 1995; Blaum et al., 2007; Mahmood et al., 2011). Burrows were identified on the basis of size, proper location and other characteristics described in literature. Active burrows were counted on direct observation and presence of fresh foot prints, faecal pellets and prey remains especially around the burrows. Each active burrow considered to be harbored by only one animal, as most of the researchers stated it a solitary animal (Roberts, 1997; Ahmed, 1998).
Habitat analysis
Habitat analysis was carried out with the help of quadrat method which were for herbs 1 m × 1 m, 5 m × 2 m and 10 m × 10 m for herbs, shrubs and trees respectively. A total of 10 quadrats were laid in each locality for measurement of frequency, density and cover of floral species. Recorded data were used to calculate relative density, relative frequency and relative cover that aggregated to produce importance value index (IVI) of each species (Hussain, 1989; Mahmood et al., 2011) while for cover of herbs (Daubenmire, 1959) class method was used. Formulae used for quantification of trees, shrubs and herbs species were as follows:
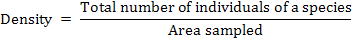

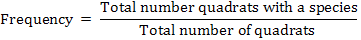


Importance Value Index (IVI) for plant species (trees, shrubs and herbs) was calculated by the following formula:
IVI = Relative density + Relative frequency + Relative cover
Results and discussion
Population distribution
Data revealed that Herpestes edwardsii was distributed in all the localities of the 3 study zones of Mirpur. Highest sightings were recorded in locality Rata (n=11), followed Chittarpari (n=8) and Bankhurma and Mehmoodabad (n=7) in each. Lowest sightings (n=1) were recorded at 5 localities including Chechian, Sang, Panyam, Thara and Siakh. Indian grey mongoose has been documented in various neighboring areas of Mirpur in a number of studies. Roberts (1997) reported this species from Pothohar region (including Jhelum that is adjacent zone A and the southern border of district Mirpur). In recent study, Mahmood et al. (2018), reported that this species has been found in Jhelum, Chakwal, Rawalpindi and Gujar Khan Regions. Rais et al. (2011) reported the distribution of Indian grey mongoose from Chotiari wetland complex, Sanghar district of Sindh province. Prior to these studies, Taber et al. (1967) confirmed the distribution of Herpestes edwardsii in Faisalabad region of Punjab province.
Population density
Data analysis showed that the maximum population density (0.65+0.03 animal/ha) was recorded at zone B, followed by (0.63+0.02 animal/ha) at zone C, while minimum (0.48+0.01 animal/ha) population density was estimated at zone A (Table I). Analysis of Variance (ANOVA) showed that there was highly significant difference (p=0.00, df=18) among population of mongoose in different study localities of all zones (Table I).
In least populated zone A, a total of 73 active burrows, were recorded in its all six localities. Highest population density (0.107 animal/ha) was recorded in Chittarpari locality, followed by D 4 (0.098 animal/ha) and Chechian (0.092 animal/ha), while lowest population density (0.052 animal/ha) was recorded at Naugran locality (Table I).
The total numbers of animal sighted in this zone during the study period were 23 and highest sightings (n= 8) were recorded in locality Chittarpari whereas lowest sightings (n=1) were noted at Chechian and Sang (Fig. 2). Zone B was highly populated zone, where average numbers of active burrows was 99.48 scattered in six different localities of this zone. Highest (0.178 animal/ha) population density was recorded in Kalyal (Chakswari), followed by Palak locality (0.143 animal/ha) while lowest (0.035 animal/ha) population density was recorded at Panyam locality (Table I). This locality also remained inactive during the month of August, September, October
Table I.- Population density of Herpestes edwardsii at different localities of Mirpur during 2013-14.
|
Study Zone |
Locality |
Altitude (m asl) |
Mean No. of burrows |
No of active burrow ± Std. Error |
Estimated population density (animal/ha) |
Total population density (animal/ha) |
|
A |
D4 |
360 |
21.83 |
14.83 + 0.63 |
0.098 |
0.48 |
|
Chittarpari |
330 |
22.5 |
16.33 + 0.71 |
0.107 |
||
|
Bankhurma |
400 |
17.5 |
11.83 + 0.25 |
0.078 |
||
|
Chechian |
255 |
21 |
13.83 + 0.48 |
0.092 |
||
|
Sang |
250 |
12 |
8.00 + 0.41 |
0.053 |
||
|
Naugran |
240 |
13.16 |
7.83 + 0.25 |
0.052 |
||
|
B |
Mehmoodabad |
400 |
22.66 |
16.5 + 1.18 |
0.11 |
0.65 |
|
Islamgarh |
380 |
19.5 |
12.5 + 0.63 |
0.083 |
||
|
Rahra |
430 |
24 |
17.16 + 1.11 |
0.114 |
||
|
Kalyal |
410 |
38.16 |
26.83 + 0.48 |
0.178 |
||
|
Palak |
380 |
27.5 |
21.16 + 0.85 |
0.143 |
||
|
Panyam |
360 |
7.5 |
5.33 + 1.78 |
0.035 |
||
|
C |
Rata |
480 |
27.83 |
20.83 + 0.82 |
0.138 |
0.63 |
|
Sorakhi |
540 |
32 |
25.33 + 0.58 |
0.168 |
||
|
Thara |
545 |
20 |
13.83 + 0.75 |
0.092 |
||
|
Kathar |
540 |
17 |
11.83 + 0.48 |
0.078 |
||
|
Khadimabad |
420 |
16.66 |
10.33 + 0.65 |
0.068 |
||
|
Siakh |
380 |
16.66 |
10.33 + 0.48 |
0.082 |
Table II.- Altitudinal variation in population density of Mongoose in study area during study period.
|
Altitudinal class (asl) m |
Area surveyed (Km2) |
Total burr-ows |
Active burr-ows |
Sigh-ting |
Indirect Evidences |
Popula-tion density (Animal /Km2) |
Popula-tion density (Animal /ha) |
||
|
Faeces |
Footp-rints |
Prey remains |
|||||||
|
I (Below 350) |
36 |
412 |
275 |
12 |
15 |
19 |
1 |
7.64 |
0.076 |
|
II (350-450) |
90 |
1279 |
893 |
42 |
21 |
40 |
19 |
9.92 |
0.099 |
|
III (450-550) |
36 |
581 |
431 |
20 |
12 |
6 |
1 |
11.97 |
0.120 |
and November because in these month water level rises up to 1242 feet, so animals migrate surrounding areas and again come in the month of December and onward back when level decreases that’s why less no of animal were present. The total numbers of animal sighted in this zone during the study period were 28 and highest sighting (n=7) were in locality Mehmoodabad and lowest sighting (n=1) in Panyam locality (Fig. 2). In group maximum number of animals (n=3) were sighted in locality Rahra.
Zone C which was also further divided in six localities having different population density and number of burrows. The average numbers of active burrows were estimated to be 92.48. Highest mean numbers of active burrows were noted in locality Sorakhi that resulted in highest (0.168 animal/ha) population density in this locality, followed by Rata (0.138 animal/ha). Lowest population density (0.068 animal/ha) was recorded at Khadimabad and Siakh localities (Table I). The total numbers of animal sighted in this zone during the study period were 23 with highest sightings (n= 11) in locality Rata whereas lowest sightings (n=1) were recorded at Thara and Siakh (Fig. 2). At one time maximum no of animal sighted (n=5) were in locality Rata which was largest group in all localities.
Results could be compared with the findings of Shetty et al. (1995) who concluded a density ranged between 0.048 animal/km2 to 0.118 animal/km2 in Sariska tiger reserve, Rajhistan, India. Kalle et al. (2014) recorded a mean abundance range of Indian grey mongoose from 0.12 ± 0.073 to 0.68 ± 0.35 in western Ghat, India. Jnawali et al. (2011) estimated a total of 10000 individuals in Chitwan National Park, Nepal, that is higher than the population estimated during present study.
Population density of Indian grey mongoose was evaluated at different altitudinal levels of the study area. Highest population density of 0.12 animals/ha was noted in Class III (450 m to-550 m) while minimum (0.08 animals/ha) population density was recorded as in Class I (below 350 m) (Table II). Although there was no pertinent literature for radial comparison of altitudinal aspects of population density, most of researchers reported this species in plain areas. Roberts (1997), Ahmed (1998), Mirza (1998), Rais et al. (2011) and Taber et al. (1967) reported this species from Punjab and Sindh provinces, that more or less having similar altitudinal ranges.
Season pose important effects on grey mongoose population. During present study, highest population density (0.12 animals/ha) was recorded in the month of October 2013, followed by March 2014 (0.113 animal/ha) and December 2013 (0.110 animal/ha) whereas lowest population density (0.074 animals/ha) was recorded in the month of May 2013 (Table III), resulting an average high population in winter or wet season. This view is testified by a recent study conducted by Kalle et al. (2014) in India. They reported the mean abundance of grey mongoose increased in wet season (λ mean 0.68 ± 0.35) was higher than dry (summer) season (λ mean 0.34 ± 0.16). Detection probability may increase in winter season due to frequent rains, which facilitated grey mongoose to leave a more visible footprint on ground as compared to dry season. Furthermore during winter season, deciduous trees shed off their leaves, consequently enhanced sightings and burrows detection probability of this animal (Kumara and Singh, 2007). Likewise, in winter season, food of grey mongoose reduced and animal has to extend its home range to meet its food requirement.
Habitat analysis
Habitat analysis of the Indian grey mongoose was carried out at the 18 localities of the study area to determine the habitat characteristics of this specie. Vegetation is important because it provides animals with suitable hiding places, proper hinder escape and increase detection of prey so that they can easily capture them (Lima, 1990; Schooley et al., 1996; Santiapillai et al., 2000; Blumstein et al., 2004). The habitat of Indian grey mongoose in the study area consist upon a mixture of plain and mounds regions covered with thorny vegetation, cultivated lands and scrub forests.
Phytosociological analysis showed that the dominant plant species were Acacia nilotica (IV= 108.9), Senegalia modesta (IV= 94.23), Broussonetia papyrifera (IV= 94.19), Calotropis procera (IV= 146.45), Dodonaea viscosa (IV=120.17), Cynodon dactylon (IV=174.94), Chrysopogon serrulatus (IV=149.21) and Artemisia scoparia (IV= 105.69) in most of the study localities (Tables IV, V, VI). Kalyaal locality is the potential habitat of Indian grey mongoose having highest population density (0.178 animal/ha) having dominant plant species such as Acacia nilotica (IV= 100.98), Parthenium hysterophorus (IV= 94.23) and Chrysopogon serrulatus (IV=149.21). Habitat of this locality generally characterized by open land, scrub forest in a combination of cultivated areas, such a potential habitat was documented in various studies including Janawali et al. (2011) in Nepal, Kait and Sahi (2012) in Jammu and Kalle et al. (2014) in western Ghats, India. Another locality containing higher (0.168 animal/ha) population density was Sorakhi that has a dominant vegetation of Senegalia modesta (IV= 75.84), Saccharum spontaneum (IV= 123.82) and Artemesia scoparia (IV= 105.69). This locality contained plain and hilly topographic
Table III.- Monthly variation in population density of mongoose in study area during 2013-14.
|
Months |
Area surv-eyed (Km2) |
Total burro-ws |
Active burro-ws |
Sigh-ting |
Indirect evidences |
Population density(Animal /Km2) |
Population density (Animal /ha) |
|||
|
Faeces |
Foot-prints |
Prey remains |
||||||||
|
Apr-13 |
6 |
86 |
61 |
3 |
0 |
3 |
0 |
10.17 |
0.102 |
|
|
May-13 |
9 |
97 |
67 |
7 |
1 |
2 |
0 |
7.44 |
0.074 |
|
|
Jun-13 |
16.5 |
218 |
165 |
14 |
3 |
4 |
2 |
10 |
0.10 |
|
|
Jul-13 |
9 |
101 |
70 |
4 |
1 |
4 |
1 |
7.78 |
0.078 |
|
|
Aug-13 |
15 |
213 |
158 |
7 |
5 |
2 |
2 |
10.53 |
0.105 |
|
|
Sep-13 |
16.5 |
203 |
132 |
5 |
5 |
5 |
2 |
8 |
0.080 |
|
|
Oct-13 |
6 |
96 |
72 |
1 |
1 |
2 |
2 |
12 |
0.120 |
|
|
Nov-13 |
7.5 |
98 |
68 |
2 |
3 |
2 |
0 |
9.07 |
0.091 |
|
|
Dec-13 |
18 |
260 |
182 |
10 |
7 |
9 |
9 |
10.11 |
0.101 |
|
|
Jan-14 |
18 |
251 |
173 |
8 |
9 |
5 |
2 |
9.61 |
0.096 |
|
|
Feb-14 |
22.5 |
360 |
248 |
9 |
5 |
13 |
0 |
11.02 |
0.110 |
|
|
Mar-14 |
18 |
289 |
203 |
4 |
8 |
12 |
1 |
11.28 |
0.113 |
|
Table IV.- Comparison of importance value of trees, shrubs and herbs of different localities of Zone A of the study area during study period.
|
Species |
Localities |
|||||
|
D.4 |
Chittarpari |
Bankhurma |
Chechian |
Sang |
Naugran |
|
|
Senegalia modesta |
44.47 |
35.05 |
- |
- |
- |
- |
|
Acacia nilotica |
- |
94.91 |
71.89 |
92.96 |
91.94 |
71.69 |
|
Broussonetia papyrifera |
44.8 |
14.27 |
63.45 |
75.04 |
94.19 |
77.01 |
|
Dalbergia sissoo |
63.75 |
11.08 |
61.64 |
- |
59.86 |
45.86 |
|
Morus alba |
10.03 |
- |
12.49 |
- |
- |
31.38 |
|
Prosopis cineraria |
48.19 |
56.83 |
65.88 |
119.25 |
- |
- |
|
Calotropis procera |
58.44 |
51.21 |
50.83 |
- |
84.78 |
89.42 |
|
Lantana indica |
- |
33.77 |
62.84 |
78.39 |
- |
- |
|
Parthenium hysterophorus |
94.32 |
53.62 |
- |
113.82 |
- |
- |
|
Prosopis juliflora |
68.96 |
94.72 |
79.08 |
- |
- |
- |
|
Saccharum spontaneum |
78.23 |
66.64 |
108.6 |
107.78 |
- |
199.88 |
|
Ziziphus nummularia |
- |
- |
- |
- |
158.65 |
110.66 |
|
Ajuga bracteosa |
- |
- |
91.1 |
71.63 |
- |
60.68 |
|
Artemisia scoparia |
52.6 |
84.24 |
- |
- |
- |
|
|
Cynodon dactylon |
129.8 |
174.94 |
100.06 |
161.17 |
143.01 |
|
|
Cannabis sativa |
43.19 |
- |
- |
94.56 |
60.7 |
|
|
Sonchus arvensis |
- |
- |
- |
- |
52.74 |
- |
Table V.- Comparison of importance value of trees, shrubs and herbs of different localities of Zone B of the study area during study period.
|
Species |
Localities |
|||||
|
Mehmoodabad |
Islamgarh |
Rahra |
Kalyal |
Palak |
Panyam |
|
|
Senegalia modesta |
60.85 |
37.22 |
43.25 |
- |
72.84 |
80.47 |
|
Acacia nilotica |
93.67 |
84.98 |
108.99 |
100.98 |
26.78 |
73.02 |
|
Dalbergia sissoo |
72.82 |
64.24 |
65.99 |
66.14 |
57.36 |
60.61 |
|
Ziziphus mauritiana |
28.83 |
36.54 |
25.45 |
22.45 |
- |
- |
|
Calotropis procera |
58.69 |
146.45 |
74.1 |
- |
66.33 |
91.72 |
|
Parthenium hysterophorus |
- |
- |
108.62 |
94.23 |
92.5 |
139.72 |
|
Ricinus communis |
123.43 |
- |
42.01 |
73.43 |
48.78 |
68.52 |
|
Ziziphus nummularia |
117.94 |
73.63 |
- |
- |
- |
- |
|
Artemisia scoparia |
- |
104.23 |
- |
63.44 |
- |
58.81 |
|
Cynodon dactylon |
138.13 |
- |
82.53 |
- |
127.8 |
123.8 |
|
Canabis sativa |
- |
- |
- |
25.73 |
- |
- |
|
Chrysopogon serrulatus |
- |
- |
- |
149.21 |
- |
74.9 |
|
Euphorbia helioscopia |
71.45 |
76.87 |
- |
- |
66.43 |
- |
|
Rumex nepalensis |
- |
- |
51.21 |
61.56 |
- |
- |
Table VI.- Comparison of importance value of trees, shrubs and herbs of different localities of Zone C of the study area during study period.
|
Species |
Localities |
|||||
|
Rata |
Sorakhi |
Thara |
Kathar |
Khadimabad |
Siakh |
|
|
Senegalia modesta |
54.11 |
75.84 |
94.23 |
93.79 |
93.62 |
79.31 |
|
Acacia nilotica |
65.4 |
- |
20.9 |
44.16 |
61.25 |
38.75 |
|
Carissa opaca |
- |
- |
22.71 |
9.05 |
- |
- |
|
Dalbergia sissoo |
41.52 |
62.31 |
41.74 |
36.09 |
50.77 |
39.14 |
|
Azadirachta indica |
14.72 |
- |
22.18 |
30.93 |
- |
21.18 |
|
Olea ferruginea |
18.88 |
22.38 |
- |
11.49 |
- |
- |
|
Ziziphus mauritiana |
26 |
- |
23.9 |
- |
18.95 |
51.35 |
|
Calotropis procera |
- |
- |
69.08 |
53.39 |
85.77 |
47.38 |
|
Dodonaea viscosa |
120.17 |
- |
88.14 |
113.2 |
- |
- |
|
Saccharum spontaneum |
- |
123.82 |
- |
- |
121.34 |
69.04 |
|
Ziziphus nummularia |
74.23 |
- |
69.26 |
80.18 |
- |
98.52 |
|
Artemisia scoparia |
94.4 |
105.69 |
- |
- |
- |
- |
|
Cynodon dactylon |
- |
88.83 |
- |
- |
151.1 |
- |
|
Chrysopogon serrulatus |
- |
- |
133.95 |
101.08 |
- |
152.96 |
|
Malva sylvestris |
49.53 |
- |
43.32 |
- |
35.31 |
63.45 |
|
Sonchus arvensis |
- |
- |
70.89 |
- |
61.6 |
- |
features with open forest, scrub land and also cultivated fields and is comparable with Shetty et al. (1995), Rais et al. (2011) and Kalle et al. (2014).
Least populated locality Panyam had Senegalia modesta (IV= 80.47), Parthenium hysterophorus (IV= 139.72) and Cynodon dactylon (IV=123.8) dominant species among tree, shrubs and tree, respectively (Table V). Dominant plants recorded during present study are the characteristic species of dry thorn scrubs as documented in earlier studies (Roberts, 1997; Mirza, 2011) in Punjab areas of Pakistan. Similar habitat of Indian grey mongoose was reported in previous literature (Prater, 1980; Choudhury et al., 2013; Kait and Sahi, 2012). Prater (1980) reported this specie in scrub lands, open forests, near cultivated fields and human habituation in land. Choudhury et al. (2013) supported the same view point stating that scrublands as a potential habitat of this species.
Acknowledgement
Authors are grateful to Prof. Dr. Afsar Mian for improving this manuscript. We are thankful to Faraz Akram (PMAS-AAUR) for his skillful guidance during fieldwork. We are indebted to Zakir Hussain and Waqar Ahmed for their assistance during fieldwork.
Statement of conflict of interest
Authors have declared no conflict of interest.
References
Ahmed, M., 1998. Pakistan ki Jangli Hayat (Wildlife of Pakistan). Inter Graphic Printers, Islamabad, pp. 361-364.
Blaum, N., Rossmanith, E., fleissner, G. and Jeltsch, F., 2007. The conflicting importance of shrubby landscape structures for the reproductive success of the Yellow mongoose (Cynictis pencillata). J. Mammal., 88: 194-200. https://doi.org/10.1644/05-MAMM-A-314R3.1
Blumstein, D.T., Verneyre, L. and Daniel, J.C., 2004. Reliability and the adaptive utility of discrimination among alarm callers. Proc. biol. Sci., 271: 1851-1857. https://doi.org/10.1098/rspb.2004.2808
Cavallini, P. and Nel, J., 1995. Comparative behavior and ecology of two sympatric mongoose (Cynictic penicillata and Galerella pulverulenta). S. Afr. J. Zool., 30: 46-49. https://doi.org/10.1080/02541858.1995.11448371
Choudhury, A., Wozencraft, C., Muddapa, D., Yonzon, P., Jennings, A. and Geraldine, V., 2013. Herpestes edwardsii. The IUCN red list of threatened species. Ver. 2014.2. Commission, Islamabad, pp. 18-112.
Corbet, G.B. and Hill, J.E., 1992. Mammals of the Indo-Malayan Region. A systematic review. Oxford University Press, Oxford, UK.
Daubenmire, R.F., 1959. A canopy coverage method of vegetation analysis. Northw. Sci., 3: 43-46.
Firouz, E., 2005. The complete fauna of Iran. I.B. Tauris Publishers, London, pp. 67.
Francis, C.M., 2008. A field guide to the mammals of South-East Asia. New Holland Publishers, London, pp. 293.
Hussain, F., 1989. Field and laboratory manual of plant ecology. University grants.
Hussain, R. and Mahmood, T., 2016. Comparative ecology of two sympatric mongoose species (Herpestes javanicus and H. edwardsii) in Pothwar Plateau, Pakistan. Pakistan J. Zool. 48: 1931-1943.
IUCN, 2014. The IUCN red list of threatened species, Ver. 2014.3. Available at: www.iucnredlist.org (Accessed 10 August, 2014).
Jnawali, S.R., Baral, H.S., Lee, S., Acharya, K.P., Upadhyay, G.P., Pandey, M., Shrestha, R., Joshi, D., Laminchhane, B.R., Griffiths, J., Khatiwada, A.P., Subedi, N. and Amin, R., 2011. The status of Nepal mammals: The national red list series. IUCN.
Kait, R. and Sahi, D.N., 2012. Determination of the local, national/global status and effect of urbanization on Carnivora Mammals in Jammu District and Trikuta Hills of Jand K, India. J. Biodiv. Conserv., 4: 530-534.
Kalle, K., Ramesh, T., Qureshi, Q. and Sankar, K., 2014. Estimating seasonal abundance and habitat use of small carnivores in the Western Ghats using an occupancy approach. J. Ecol., 30: 469-480.
Kumara, H.N. and Singh, M., 2007. Small carnivores Karnataka: Distribution and sight records. J. Bomb. nat. Hist. Soc., 104: 155-162.
Lima, S.L., 1990. Protective cover and the use of space, different strategies in finches. Oikos, 58: 151-158. https://doi.org/10.2307/3545422
Macdonald, D.W., 2006. The encyclopedia of mammals. Oxford University Press, Oxford.
Mahmood, T., Husssain, I. and Nadeem, M.S., 2011. Population estimates, habitat preference and the diet of small Indian mongoose Herpestes javanicus in Potohar plateau, Pakistan. Pakistan J. Zool., 43: 103-111.
Mahmood, T., Fazal, F., Akrim, F., Fatima, H. and Nadeem, M.S., 2018. Comparative morphology and anatomy of two sympatric mongoose species (Herpestes javanicus and H. edwardsii) from Potohar Plateau. Pakistan J. Zool., 50: 385-387.
Mirza, Z.B., 1998. Illustrated handbook of animal biodiversity of Pakistan. Center for Environmental research and conservation, Islamabad, pp. 98.
Mirza, Z.B., 2011. Pakistan ke Hayatyati Mantaqy our Nizam (Ecosystems of Pakistan). Urdu Science Board, Cabinet Division, Pakistan.
Nowak, R.M., 1991. Walker’s mammals of the World. The Johns Hopkins University Press, Baltimore and London, pp. 771-773.
Prater, S.H., 1980. The book of Indian animals. Bombay Natural History Society, 3rd Ed. Oxford University Press, New Delhi, pp. 324-25.
Rais, M., Khan, M.Z., Abbass, D., Akber, G., Nawaz, R. and Islam, S., 2011. A qualitative study on wildlife of Chotiari Reseroir; sanghar, Sindh, Pakistan. Pakistan J. Zool., 43: 237-247.
Roberts, T.J., 1997. The mammals of Pakistan, 2nd ed. Oxford University Press, London, pp. 191-193.
Santiapillai, C., DeSilv, M. and Dissanayake, S., 2000. The status of mongooses (family Herpestidae) in Ruhuna National Park, Sri Lanka. J. Bomb. nat. Hist. Soc., 97: 208-214.
Schooley, R.L., Sharpe, P.B. and Van Horne, B., 1995. Can shrub cover increase predation risk for a desert rodent? Can. J. Zool., 74: 157-163. https://doi.org/10.1139/z96-020
Shetty, J., Shetty, G. and Kanakaraj, S., 1995. Mating behavior of the Indian grey mongoose Herpestes edwardsii Geoffroy. J. Bomb. nat. Hist. Soc., 92: 26-29.
Taber, R.D., Sheri, A.N. and Mustafa, S.A, 1967. Mammals of Lyallpur region, West Pakistan. J. Mammal., 48: 392-40. https://doi.org/10.2307/1377772
Wells, D.R., 1989. Notes on the distribution and taxonomy of peninsular Malaysian mongooses (Herpestes). Nat. His. Bull. Siam Soc., 37: 87-97.
Wozencraft, W.C., 2005. Order Carnivora. In: Mammal species of the world: A taxonomic and geographic reference, Third edition (eds. D.E. Wilson and D.M. Reeder). Smithsonian Institution Press, Washington, DC, USA, pp. 532-628.
To share on other social networks, click on any share button. What are these?


