

Methanolic Extract of Neem Plant Inhibits NS3 and NS5A Nonstructural Proteins of HCV 3A Genotype


Methanolic Extract of Neem Plant Inhibits NS3 and NS5A Nonstructural Proteins of HCV 3A Genotype
Ubaida Hussain1,2*, Amtul Jamil Sami1*, Shazia Rafique3*, Muhammad Idrees khan3 and Ahmad Ali Shahid3

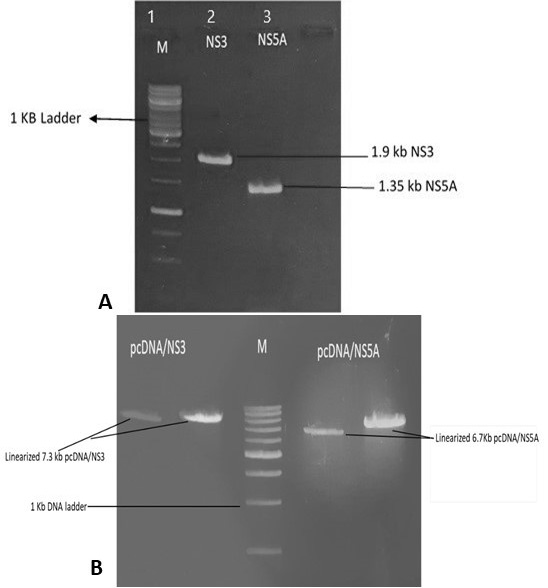
(A) PCR amplification of NS3 and NS5A; Lane 1 DNA size marker (1 Kb), lane 2 amplified gene product NS3 (1.9 kb) lane 3 amplified gene product NS5A (1.3 KB). (B) Linearized purified plasmid constructs; Lane 1 and 2 linearized pcDNA/NS3 (5.4+1.9=7.3 kb) lane 3 DNA ladder (1 Kb) lane 4 and 5 linearized pcDNA/NS5A (5.4+1.3=6.7kb).

RT PCR of stable cell lines; Lane 2-4 NS3 1.9 kb positive stable clones, lane 5-6 negative control NS3, lane7-10 positive stable clones of NS5A (1.3 kb) lane 11-13 negative control NS5A, lane 14 1Kb DNA ladder.

Western blot analysis of HepG2 NS3 (A) and NS5A (B) stable cell lines; Protein marker lane 1. Lane 2-5 positive NS3 clones, while lane 1 in B is positive NS5A clones lane 2-5 negative control 6-8.
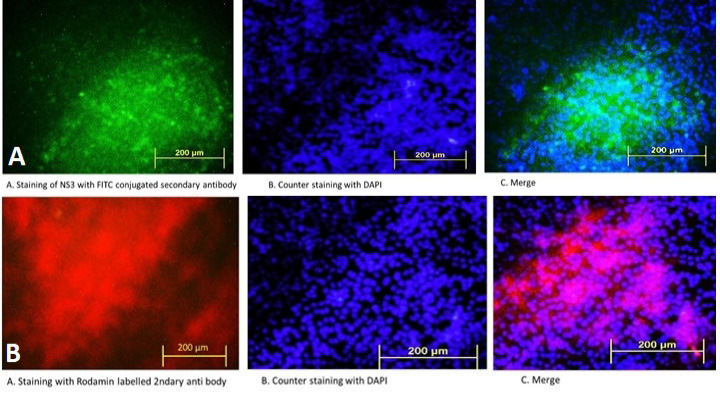
Immunoflourescence assay for NS3 protein (A) and NS5A protein (B) A NS3 staining with FITC labelled secondary antibody, counter staining with DAPI, merge. B NS5A staining with rodamin labelled secondry antibody, counter staining with DAPI, merge.

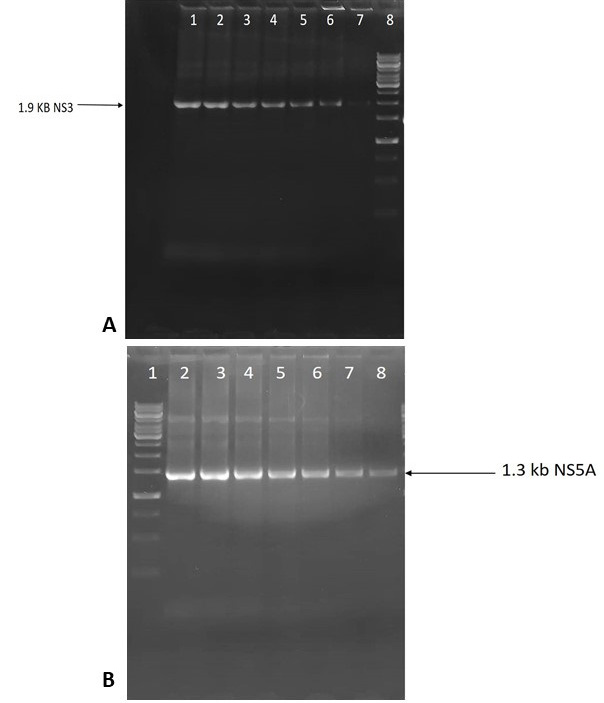
Effect of concentration of A. indica seed extract on expression of nonstructural gene NS3 (A) and NS5A (B). RT-PCR results: lane 1 in A positive control, lane 2-7: increasing extract concentrations (100, 200, 300, 400, 500, 600 µg/mL), lane 8: 1kb DNA ladder. B., lane 1: 1kb DNA ladder, lane 2: positive control, lane 3-8: increasing extract concentrations (100, 200, 300, 400, 500, 600 µg/mL).
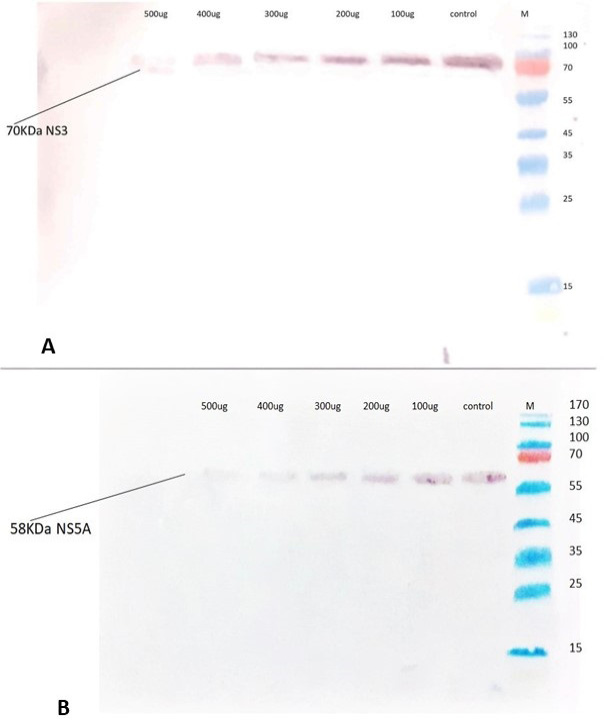
Effect of concentration of A. indica seed extract on expression of nonstructural protein NS3 (A) and NS5A (B). Western blot analysis of A. indica treated NS5A stable cell lines, (right to left ) lane 1: protein marker, lane 2: positive control, Lane 3-7: increasing extract concentrations (100, 200, 300, 400, 500 µg/mL).

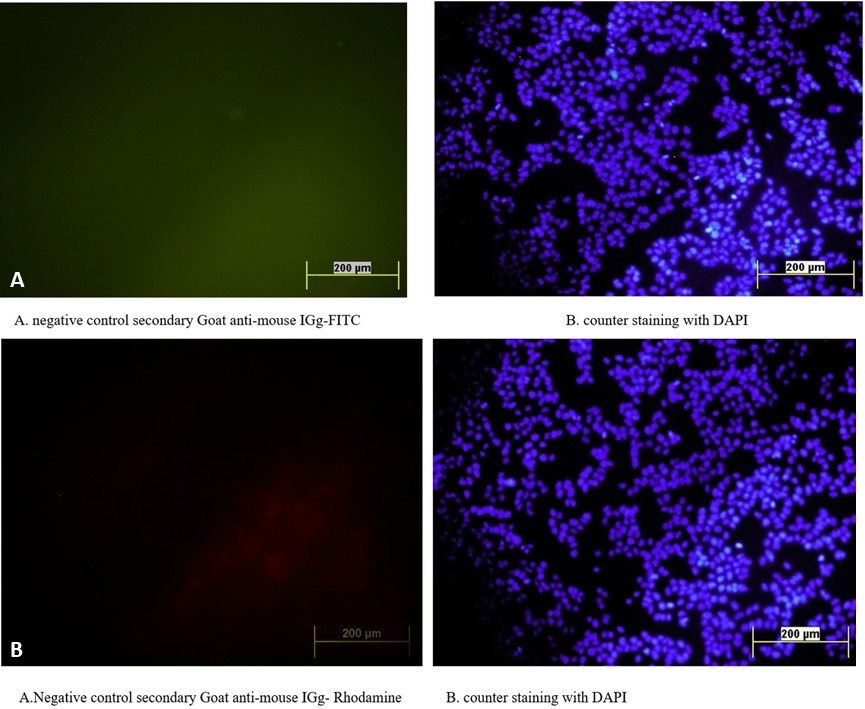
Stable cell line control immunofluorescence assay. A: staining with goat anti mouse secondary antibody FITC in A and Rodamin in B; B: counter staining with DAPI.


