
Iron Excess Impact on Pancreatic Beta Cell Structure and Fasting Blood Glucose Levels in Male Wistar Rats (Rattus norvegicus)


Iron Excess Impact on Pancreatic Beta Cell Structure and Fasting Blood Glucose Levels in Male Wistar Rats (Rattus norvegicus)
Anisa Muthia Fakhira1, Madihah Madihah1, Susi Susanah2, Erick Khristian3, Ratu Safitri1*

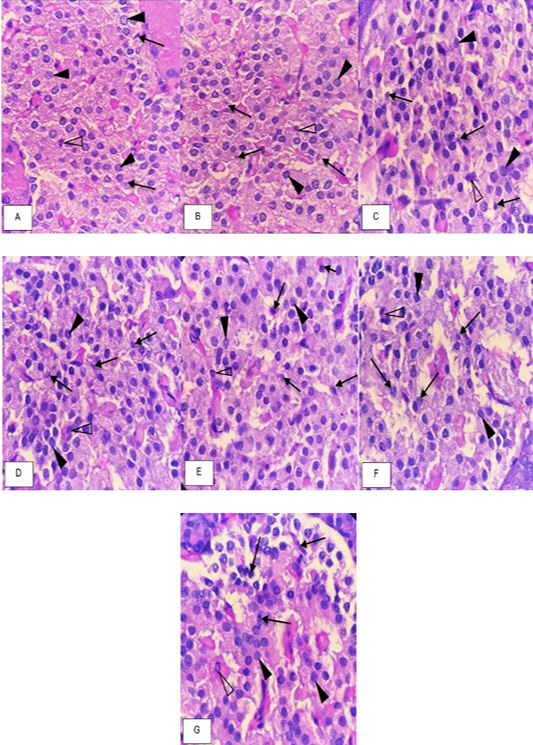
Figure 1:
Histopathological Representation of Islets of Langerhans in Rat Pancreas Post-Treatment with PAS Staining at 1000× Magnification.
Note: (A) Control; (B) ID 10 mg/kg BW; (C) ID 20 mg/kg BW; (D) ID 30 mg/kg BW; (E) ID 40 mg/kg BW; (F) ID 50 mg/kg BW; (G) ID 60 mg/kg BW; (↑) necrotic beta cells; (▲) normal beta cells; (∆) alpha cells.
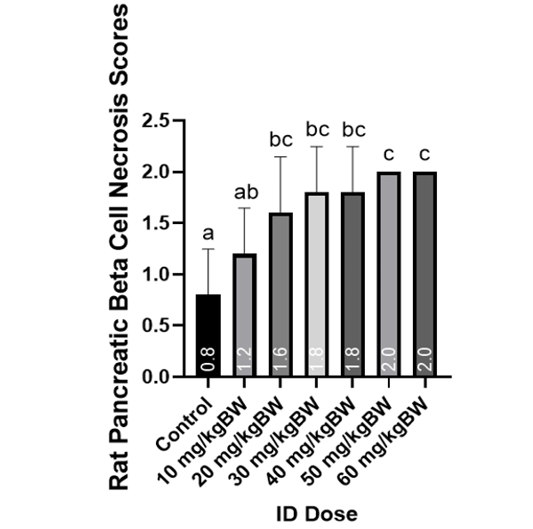
Figure 2:
Graph of rat pancreatic beta cell necrosis score with iron excess conditions.
Note: Different letters indicate the results of Mann-Whitney U analysis, indicating significant differences between treatments (P<0.05).
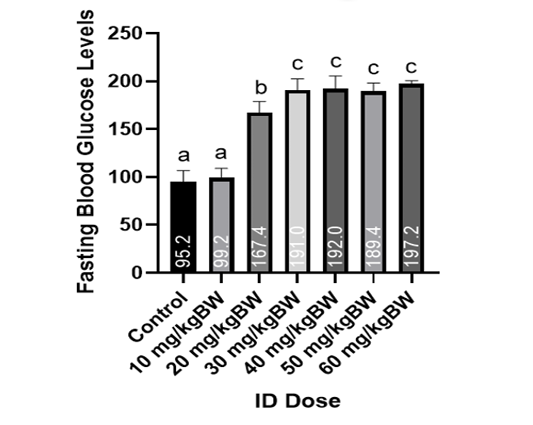
Figure 3:
Graph of rat fasting blood glucose levels from rat blood serum in iron excess conditions.
Note: different letters indicate significant differences between Duncan’s advanced test treatments (P<0.05).

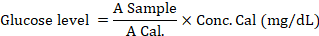
Equation 1

March 2024
Vol. 12, Iss. 3, pp. 392-585
