Investigation of Bovine Disease and Events through Machine Learning Models
Investigation of Bovine Disease and Events through Machine Learning Models
Ghalib Nadeem* and Muhammad Irfan Anis
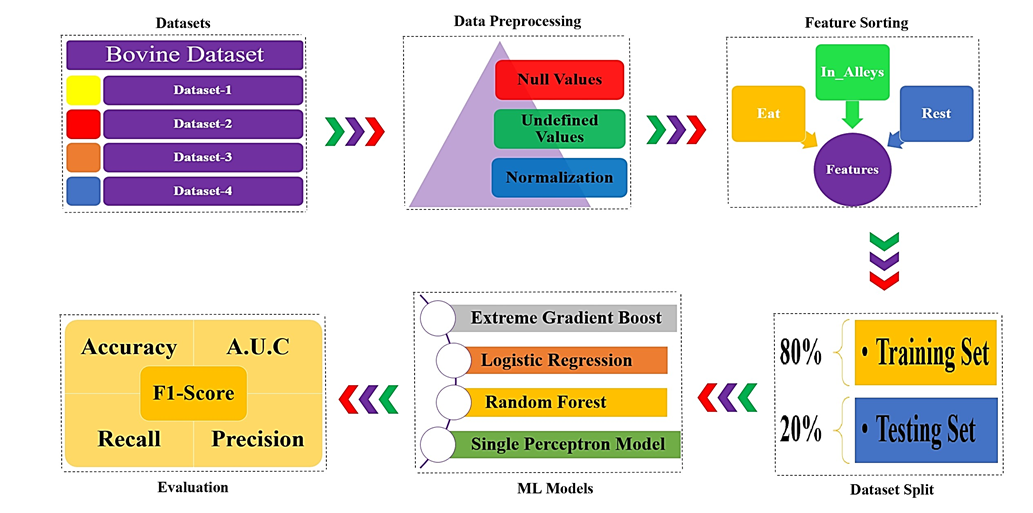
Block diagram of entire flow.
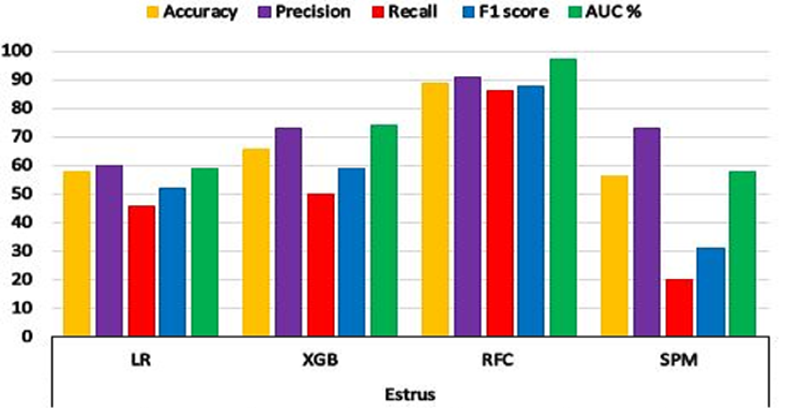
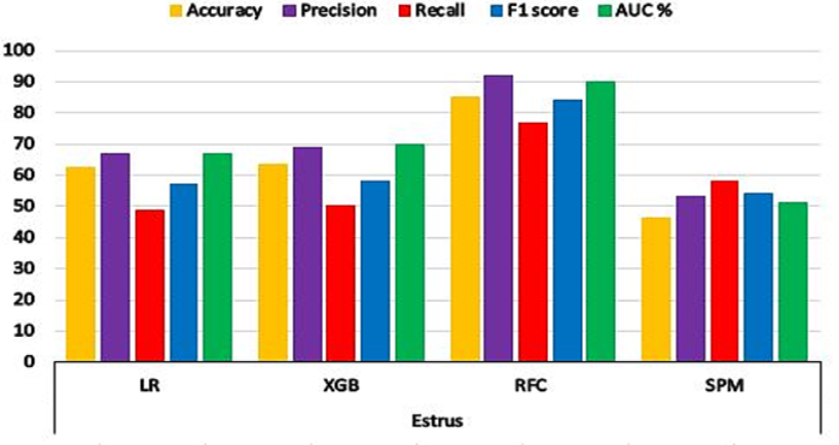
Graphical result of ML models for the event of Estrus in Data-set-1.
Graphical result of ML models for the event of Calving in Data-set-1.
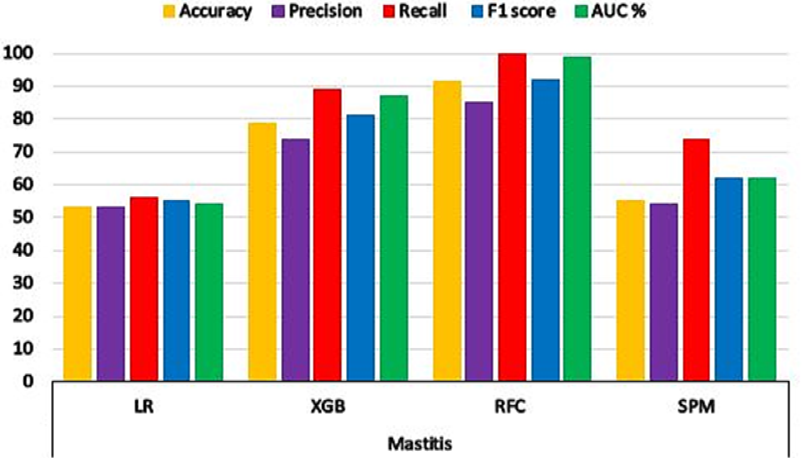
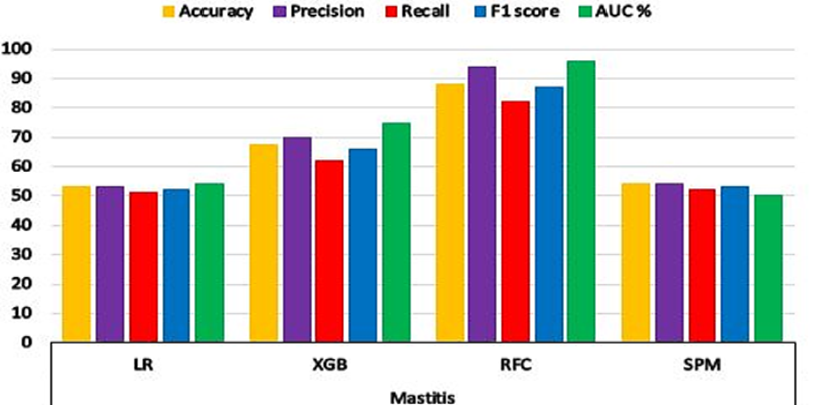
Graphical result of ML models for the event of Mastitis in Data-set-1.
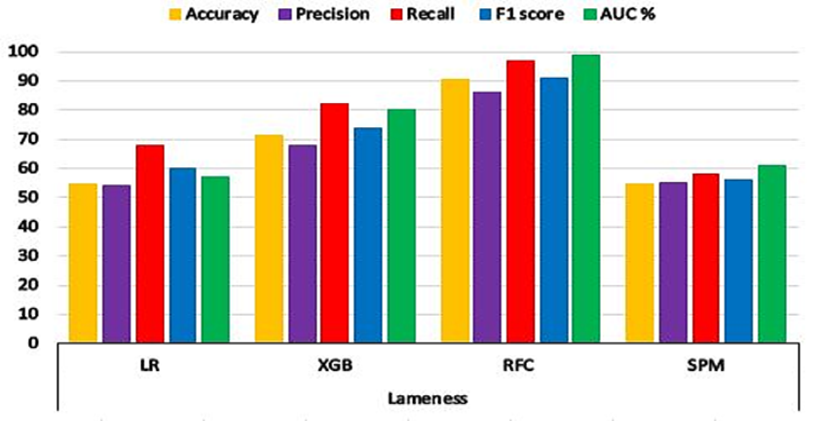
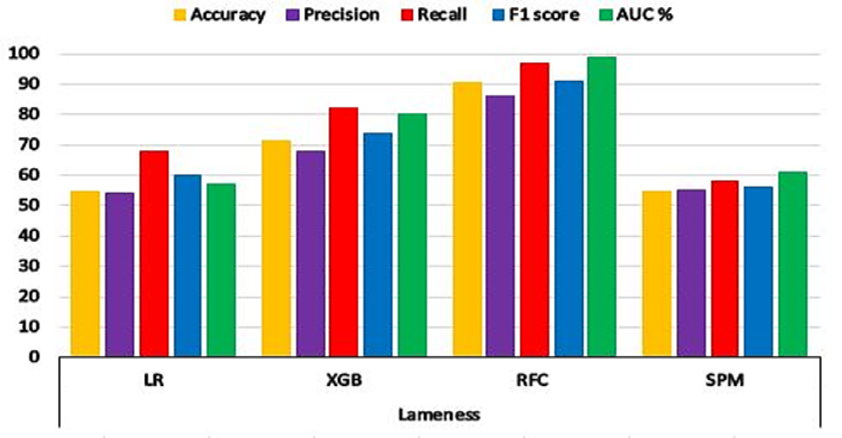
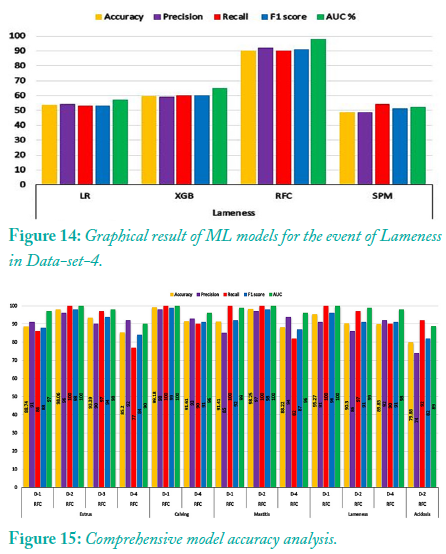
Graphical result of ML models for the event of Lameness in Data-set-1.
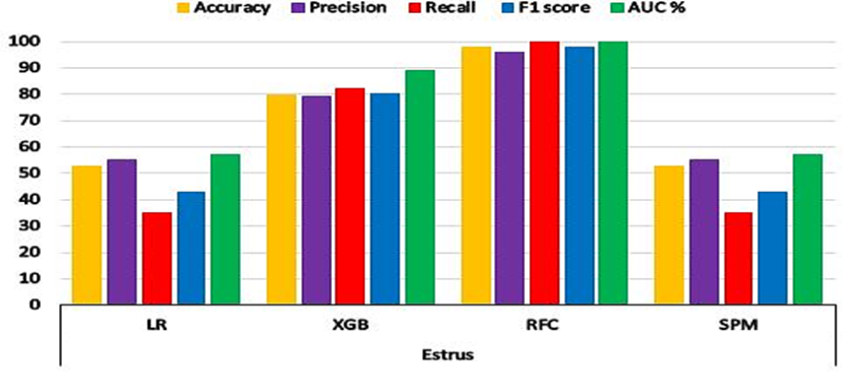
Graphical result of ML models for the event of Estrus in Data-set-2.
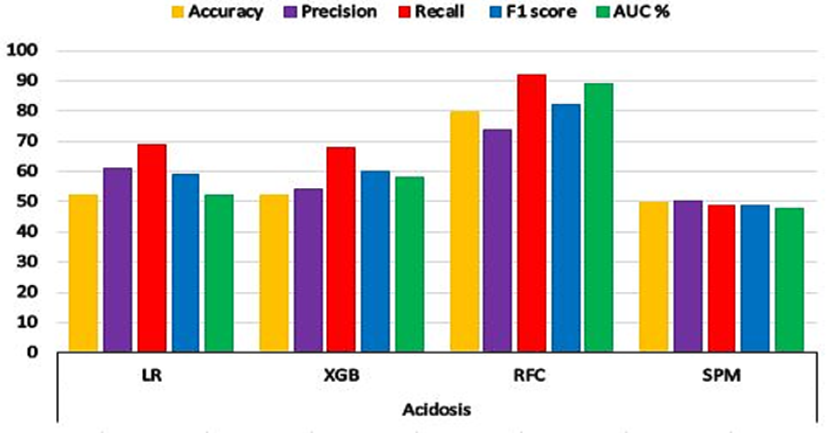
Graphical result of ML models for the event of Acidosis in Data-set-2.
Graphical result of ML models for the event of Mastitis in Data-set-2.
Graphical result of ML models for the event of Lameness in Data-set-2.
Graphical result of ML models for the event of Estrus in Data-set-3.
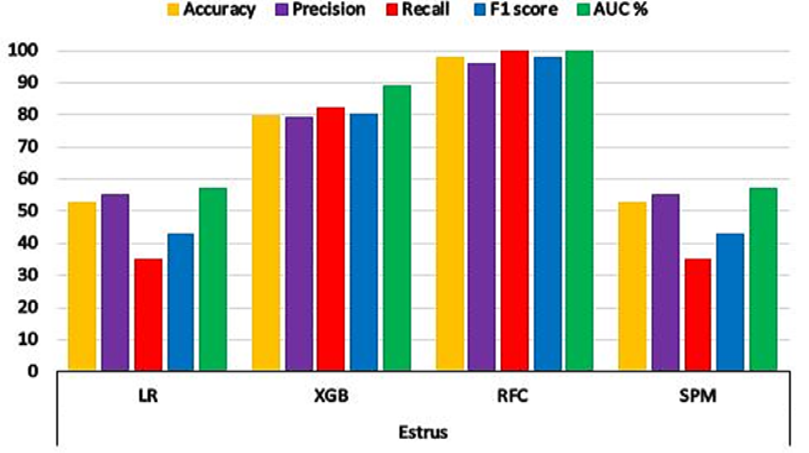
Graphical result of ML models for the event of Estrus in Data-set-4.
Graphical result of ML models for the event of Estrus in Data-set-4.
Graphical result of ML models for the event of Mastitis in Data-set-4.


