
Inquisition of Variations in Serum Protein Profile Induced by Fat Rich Diet in Rattus norvegicus


Inquisition of Variations in Serum Protein Profile Induced by Fat Rich Diet in Rattus norvegicus
Ambreen Asghar, Tasleem Akhtar, Nadeem Sheikh*
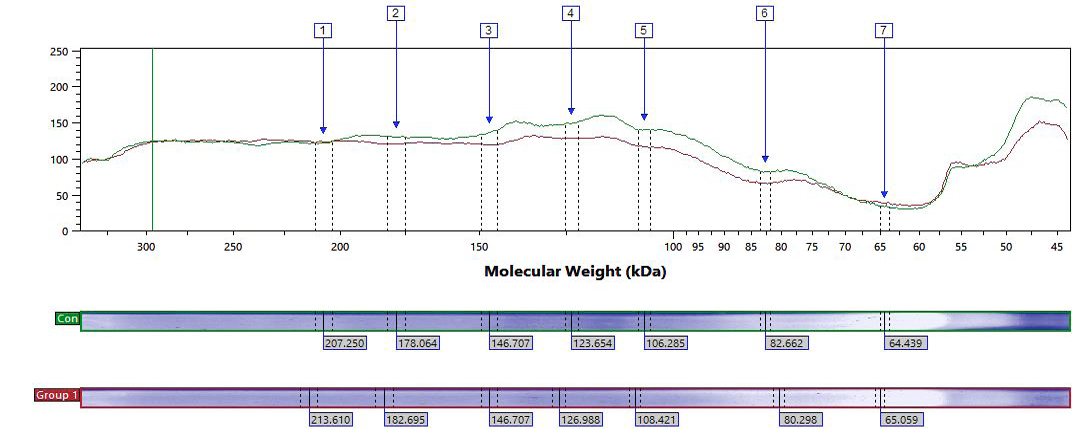
Figure 1:
Electropherogram representing the control and group 1, given the volume of protein expression on Y-axis and molecular weight on X-axis.
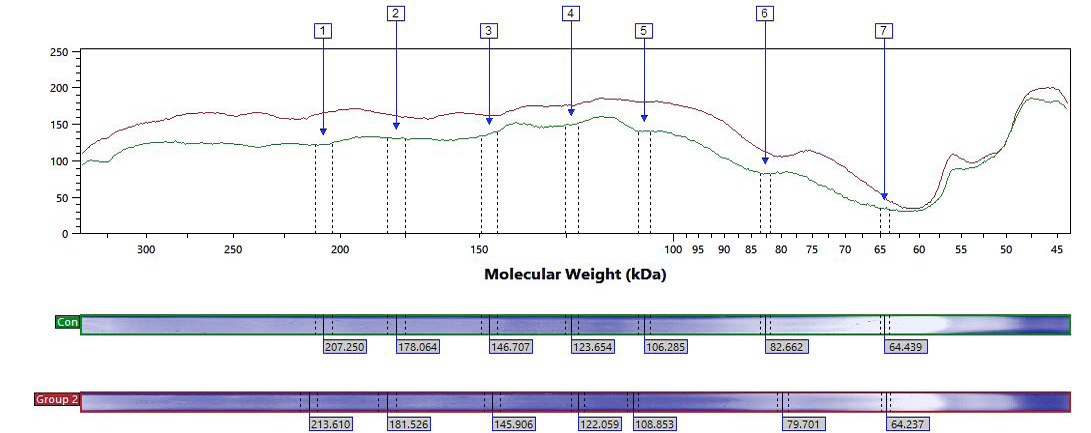
Figure 2:
Electropherogram representing evaluation of control and group 2, given the volume of protein expression on Y-axis and molecular weight on X-axis.

June 2018
Vol. 33, Iss. 1, Pages 1-97

