
In vitro Prebiotic Selection of Probiotic Lactic Acid Bacterium, Lactobacillus mindensis CA4


In vitro Prebiotic Selection of Probiotic Lactic Acid Bacterium, Lactobacillus mindensis CA4
Dyana Louis Anak Peter, Elldiwirna Saimen, Lucky Poh Wah Goh, Mohd. Khalizan Sabullah, Rahmath Abdulla, Jualang Azlan Gansau and Roslina Jawan*
BioAgriTech Research Group (BioATR), Faculty of Science and Natural Resources, Universiti Malaysia Sabah, Jalan UMS, Kota Kinabalu 88400, Sabah, Malaysia.
Abstract | Prebiotics are indigestible fibre components that are only fermented by the gut microbiota and provide benefits to the host’s wellbeing and health. However, probiotic substrate preferences vary according to the strain, and choosing a suitable prebiotic is essential to produce symbiotic products. This study aimed to investigate fermentability of different types of prebiotics by bacteriocin-like inhibitory substances (BLIS) producing lactic acid bacterium, Lactobacillus mindensis CA4. The prebiotic tested were bambangan, noni, tuhau, torch ginger, and mung bean at concentrations of 0.5, 1.0, 1.5, 2.0 and 2.5% (v/v), respectively. All data were recorded at 0, 24, and 48 h of incubation time. Results showed that noni fruit was the most preferred prebiotic due to constant leading in viable cell count until 48 h of fermentation. The viable cells count in the glucose-free MRS medium supplemented with noni started at 8.83 × 10⁶ CFU/mL (before fermentation) and increased to 8.67 × 10⁸ CFU/mL (24 h) and slightly decreased to 2.55 × 10⁸ CFU/mL (48 h). Result also demonstrated that the viable cells count in a medium supplemented with bambangan, noni and mung bean significantly increased with increasing concentrations (0.5 – 2.5%, v/v). However, the viable cells count was decreased in medium supplemented with tuhau and torch ginger within 24 h of fermentation. Result shows that the type and concentration of prebiotics exhibited a significant effect on the bacterial growth population of Lactobacillus mindensis CA4 and can be used in the production of functional foods containing prebiotic ingredients or as supplementation of prebiotic in diet. A potential type with perfect formulation of prebiotics will exert myriad effects on health promotion and gives very promising market in the food industry not only for economic but also scientific evidence of its advantages.
Received | February 21, 2024; Accepted | August 6, 2024; Published | October 14, 2024
*Correspondence | Roslina Jawan, BioAgriTech Research Group (BioATR), Faculty of Science and Natural Resources, Universiti Malaysia Sabah, Jalan UMS, Kota Kinabalu 88400, Sabah, Malaysia; Email: roslinaj@ums.edu.my
Citation | Peter, D.L.A., E.S.L.P.W. Goh, M.K. Sabullah, R. Abdulla, J.A. Gansau and R. Jawan. 2024. In vitro prebiotic selection of probiotic lactic acid bacterium, Lactobacillus mindensis CA4. Sarhad Journal of Agriculture, 40(Special issue 1): 130-141.
DOI | https://dx.doi.org/10.17582/journal.sja/2024/40/s1.130.141
Keywords | Gut microbiota, Lactic acid bacteria, Probiotic, Prebiotic
Copyright: 2024 by the authors. Licensee ResearchersLinks Ltd, England, UK.
This article is an open access article distributed under the terms and conditions of the Creative Commons Attribution (CC BY) license (https://creativecommons.org/licenses/by/4.0/).
Introduction
Probiotics are microorganisms that offer health benefits to consumers when eaten or applied to the body in particular quantities (FAO, 2006). Probiotics are made up of several microorganisms but the most common are Lactobacillus and Bifidobacterium, which are lactic acid bacteria (LAB), a health-promoting bacteria found in a well-balanced intestinal microbiota (Ventura et al., 2009). Probiotics may modify human immunological activity by increasing innate and adaptive immune responses, altering microbial habitat in the intestine, improving gut barrier function, competitive adherence to the mucosa and epithelium, and producing antimicrobial compounds (Tegegne and Kebede, 2022). Prebiotics are non-digestible food ingredients that specifically promote the growth or activity of beneficial microorganisms, including the probiotic LAB, where it positively affects the host organisms (Davani-Davari et al., 2019). Prebiotics have been shown to have a variety of health benefits, including gut health maintenance, cancer prevention, immune boosting, cholesterol reduction, obesity and constipation prevention, cardiovascular disease risk reduction, bacteriocin development, and many others (Patel and Goyal, 2012). Colon bacteria, primarily Bifidobacterium and Lactobacillus, have been selected as targets to improve the health inside gut as they consisted of health-promoting properties. This had been accomplished by prebiotic use, an indigestible fibre compounds which only fermented by the body’s colon bacteria (Charalampopoulos and Rastall, 2012). The fibres and carbohydrates, for example resistant starch, inulin, or oligosaccharides (short polymers of glycosidic residues) have been shown to enhance the number of Bifidobacterium and Lactobacillus among the colic microflora and they are the most used prebiotics (Gibson et al., 2004).
However, in recent years, researchers put an interest in phenolic compounds as prebiotic for LAB due to the good abundance in food, the antioxidant properties, and their capabilities in preventing diseases (Zeng et al., 2023; Sharma et al., 2022). On top of that, phenolic substances have been placed on the same biological level as prebiotics (Marchesi et al., 2016). It has been thought to be nutritionally undesirable because they precipitate proteins, block digestive enzymes, and interfere with the absorption of vitamins and minerals, lowering food nutritional value. The recent identification of their antioxidant benefits, on the other hand, has slowed the research of their negative health impacts (Rodriguez et al., 2009). Besides, dietary fiber can be found in most plant sources. Therefore, it is important to look at possible prebiotics as well as other chemical compounds from readily available sources. These sources include ripe bambangan (Mangifera pajang), noni (Morinda citrifolia), tuhau (Etlingera coccinea), torch ginger (Etlingera elatior) and mung bean (Vigna radiata).
The advantageous effects of prebiotics and probiotics have led to the development of symbiotics, which are products that contain both elements being used selectively by LAB (Schrezenmeir and de Vrese, 2001). Individual bacteria strains have a strong preference for their substrate, so understanding how to use it selectively is crucial (Crittenden et al., 2002). For example, Bifidobacterium strains prefer oligo- and polysaccharides derived from xylose and use these prebiotics to promote their own growth (Iyer and Kailasapathy, 2005). As a result, it is critical to choose the right prebiotic for the probiotic when creating a symbiotic product. Therefore, the objectives of this study are to investigate the effect of different types of prebiotics on the cell viability, and to determine the complementary of prebiotics to bacteriocin-like inhibitory substances (BLIS) producing lactic acid bacterium, Lactobacillus mindensis CA4.
Materials and Methods
Sample and culture preparation of Lactobacillus mindensis CA4
The prebiotic samples (ripe bambangan (Mangifera pajang), noni (Morinda citrifolia), tuhau (Etlingera coccinea), torch ginger (Etlingera elatior) and mung bean (Vigna radiata) were purchased from a market in Kota Kinabalu, Sabah, Malaysia. In prebiotic preparation, at first, the ripe bambangan, noni, tuhau and torch ginger were cleaned and washed in running tap water meanwhile the mung bean was washed and soaked in the water. Then, ripe bambangan and noni were peeled, and the seed was separated from the pulp. Tuhau and torch ginger were peeled and cut into small pieces same as the pulp of bambangan and noni (Figure 1). Each sample was blended using the cooking blender, respectively. The blended samples were then cooked at 100 °C with 1:1 ratio of water followed by filtering with a muslin cloth to obtain the filtrate. The filtrates were stored at 4 ℃ until further used.
The LAB used in this study is BLIS-producing lactic acid bacterium, Lactobacillus mindensis CA4 isolated from cow milk according to our published work in Kasimin et al. (2020). The stock culture of L. mindensis CA4, containing MRS medium added with 20% (v/v) glycerol (BDH Laboratory Supplies, Poole, England) was prepared and maintained at -80 ℃. Prior to use in the experiment, the frozen stock was thawed and streaked into MRS agar plates and grown at 37 °C. A single colony of L. mindensis CA4 was inoculated onto MRS broth medium and incubated at 37 °C for 16 h. The culture was then sub-cultured in fresh MRS broth medium and grown until the mid- or late exponential growth phase (16–18 h) was reached (OD600 of 1.5–3.5).
Incorporation of prebiotics into the culture media
The broth media was prepared according to the method suggested by Hernandez-Hernandez et al. (2012) with slight modifications. The glucose-free MRS medium consists of peptone (10 g/L), beef extract (10 g/L), yeast extract (5 g/L), ammonium citrate (2 g/L), sodium acetate (5 g/L), magnesium sulphate (0.10 g/L), manganese sulphate (0.05 g/L), dipotassium hydrogen phosphate (2 g/L), and Tween 80 (polysorbate 80) (1 g/L). The filtrate prebiotic was supplemented into the glucose-free MRS medium at different concentrations of 0.5, 1.0, 1.5, 2.0, and 2.5% (v/v). After that, the mixture of media and prebiotic was sterilized by autoclaving at 121 °C (15 lbs pressure) for 15 minutes.
Batch culture fermentations
The in vitro batch fermentation was conducted according to Pérez-Burillo et al. (2021). About 100 mL of the sterile prebiotic-incorporated medium at various concentrations were transferred into 250 mL Erlenmeyer flasks, respectively. About 1 % (v/v) of the active culture was inoculated into the incorporated media. Two controls which are commercial MRS medium and glucose-free MRS medium were prepared and inoculated with the active culture. The cultures were then incubated at 37 °C in a horizontal shaker (B. Braun Biotech International, Melsungen, Germany) and agitated at 100 rpm for 48 h.
Analytical procedures
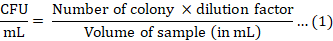
Cell viability assessment: During the fermentation, samples were withdrawn at 0, 24, and 48 h intervals and prepared for analysis. The changes in culture pH were measured using a pH meter (Mettler-Toledo, Switzerland). Viable cell count was reported as colony-forming units (CFU/mL) using the spread plate method according to Jawan et al. (2021). Briefly, decimal serial dilutions ranging from 101 to 109 of each suspension in 100 mM sodium phosphate buffer (pH 6.5) were spread evenly on the surface of MRS agar plates in triplicates. After incubation at 37 °C for 24 h, the number of viable cells was determined according to Equation 1.
In titratable acidity analysis, about 10 mL of fermented sample was taken and added into beaker. Then, 3-5 drops of methyl were added and stirred. Methyl is an indicator where it is in an acidic solution, it appears red, but turns yellow when the solution becomes neutral or basic. Next, 0.1 M Sodium hydroxide (NaOH) was added drop by drop until the solution starts to turn yellowish using burette graduated in millilitres (mL). Then, the amount of NaOH used for the titration was noted. The titratable acidity was calculated based on Equation 2.
Lactic acid concentration (%)

Statistical analysis
The data were subjected to one-way analysis of variance (ANOVA) by IBM SPSS Statistic Software and the significance of the difference between means was determined by Duncan’s multiple range test (p < 0.05). Values were expressed as means of triplicate determinants ± standard deviation (SD).
Results and Discussion
Growth compatibility of lactobacillus mindensis CA4 in different types of prebiotics
The initial viable cell count before fermentation are summarized in Table 1. In this study, the growth compatibility of Lactobacillus mindensis CA4 in glucose-free MRS medium supplemented with various types of prebiotics was assessed. The viable count of L. mindensis CA4 in medium supplemented with bambangan and tuhau was slightly higher than in controls and other medium-supplemented prebiotics. Medium supplemented with bambangan and tuhau give 1.07 × 10⁷ and 1.02 × 10⁷ CFU/mL, respectively. In terms of pH value, all treatments recorded pH at the range of 5.78 – 6.20. The pH reading for medium supplemented with bambangan and noni were slightly lower than other media, which are 5.79 and 5.78, respectively. The diversity of pH values according to the type of fruit-based prebiotic was also observed in the study of Dalu et al. (2019).
Table 1: Cell viability of Lactobacillus mindensis CA4 growth in various types of prebiotics at concentration of 2% (v/v) before fermentation.
|
Prebiotic |
pH |
Viable cell |
|
CFU/mL (Mean ± SD) |
||
|
MRS (Control) |
6.20 ± 0.01 |
8.17 × 10⁶ ± 0.76 defg |
|
Glucose-free MRS (Control) |
6.14 ± 0.01 |
5.83 × 10⁶ ± 0.76 h |
|
Bambangan |
5.79 ± 0.01 |
1.07 × 10⁷ ± 0.08 abc |
|
Noni |
5.78 ± 0.01 |
8.83 × 10⁶± 1.04 cdef |
|
Tuhau |
6.09 ± 0.01 |
1.02 × 10⁷ ± 0.08 abc |
|
Torch ginger |
6.06 ± 0.01 |
8.83 × 10⁶ ± 0.76 cdef |
|
Mung bean |
6.12 ± 0.01 |
9.67 ×10⁶ ± 0.76 bcd |
Note: All values are expressed as means±standard deviation in triplicate. Data followed by the same letters are not significantly different (p<0.05) according to Duncan’s multiple range test to evaluate the effect of investigated parameters. S.D: standard deviation.
Table 2 illustrates the average readings of viable cells count of L. mindensis CA4 at 24 h of incubation time. Among the treatments, mung bean showed the highest viable cells count followed by noni, tuhau, torch ginger, and bambangan gives the lowest value. Treatment with mung bean was 1.36 and 2.85 times higher as compared to MRS and glucose-free MRS medium, respectively. Prebiotics are made up of different oligosaccharides in various concentrations. It was reported that mung beans contain high resistant starch and soybean-oligosaccharide such as raffinose and stachyose (Tang et al., 2014). Whereas noni fruit has pectin polysacharrides compound such as arabinose, galactose, galacturonic acid and rhamnose (Bui et al., 2006); tuhau and torch ginger reported consist of carbohydrate and high dietary phenolic such as flavonoids and phenolics (Prabawati et al., 2021); and bambangan fruit pulp consists of fructo-oligosaccharides and majority of monosaccharides components (mannose, arabinose, glucose, and fructose) as reported by Tangah et al. (2017). The ability of polyphenols to influence the gut microbiota has been demonstrated to have favourable benefits (Serra et al., 2018) and several research had been highlighting polyphenols potential as a candidate prebiotic.
Table 2: Cell viability of Lactobacillus mindensis CA4 growth in various types of prebiotics at concentration of 2% (v/v) after 24 h of incubation.
|
Prebiotic |
pH |
Viable cell |
|
CFU/mL (Mean ± SD) |
||
|
MRS (Control) |
4.53 ± 0.01 |
7.00 × 10⁸± 0.50 efghi |
|
Glucose-free MRS (Control) |
5.75 ± 0.01 |
3.33 × 10⁸± 0.58 l |
|
Bambangan |
5.62 ± 0.01 |
5.17 × 10⁸± 1.52 ijkl |
|
Noni |
5.70 ± 0.01 |
8.67 × 10⁸± 2.47 bcdef |
|
Tuhau |
5.69 ± 0.01 |
6.83 × 10⁸ ± 0.76 fghi |
|
Torch ginger |
5.68 ± 0.01 |
5.50 × 10⁸± 0.50 hijk |
|
Mung bean |
5.70 ± 0.01 |
9.50 × 10⁸ ± 0.50 bc |
Note: All values are expressed as means±standard deviation in triplicate. Data followed by the same letters are not significantly different (p<0.05) according to Duncan’s multiple range test to evaluate the effect of investigated parameters. S.D: standard deviation.
Table 3: Cell viability of Lactobacillus mindensis CA4 growth in various types of prebiotics at concentration of 2% (v/v) after 48 h of incubation.
|
Prebiotic |
pH |
Viable cell |
|
CFU/mL (Mean ± SD) |
||
|
MRS (Control) |
3.82 ± 0.01 |
3.50 × 10⁷± 0.50 fg |
|
Glucose-free MRS (Control) |
5.80 ± 0.01 |
- |
|
Bambangan |
5.75 ± 0.01 |
8.17 × 10⁷ ± 0.76 c |
|
Noni |
5.80 ± 0.01 |
2.55 × 10⁸± 0.13 a |
|
Tuhau |
5.74 ± 0.01 |
3.67 × 10⁷± 0.76 fg |
|
Torch ginger |
5.76 ± 0.01 |
- |
|
Mung bean |
5.55 ± 0.01 |
- |
Note: All values are expressed as means±standard deviation in triplicate. Data followed by the same letters are not significantly different (p<0.05) according to Duncan’s multiple range test to evaluate the effect of investigated parameters. S.D: standard deviation.
Table 3 shows the viable cell count of L. mindensis CA4 after 48 h of incubation. Generally, the viable cell count in all treatments showed a decreasing pattern compared to 24 h. There was no viable count recorded in glucose-free MRS (control), torch ginger, and mung bean. Medium supplemented with noni exhibited the highest viable cell count followed by bambangan and tuhau. As for pH values, only MRS (control) medium and medium supplemented with mung bean continue to decrease from 24 h to 48 h incubation. The reduction in pH was caused by organic acids such as lactic acid produced by LAB during fermentation as a result of metabolism through glycolytic pathway (Laosee et al., 2022).
The viable cell count in the medium supplemented with noni multiplied from 8.83 x 10⁶ CFU/mL to 8.67 x 10⁸ CFU/mL within 24 h, and constantly survives at 48 h with reasonable value (2.55 x 10⁸ CFU/mL). This result was supported by Wang et al. (2009) where they studied the feasibility of noni fruit to produce probiotic noni juice by L. casei, L. plantarum and B. longum. All the tested strains grew faster and nearly reached 109 CFU/mL within 48 h and decreased slowly afterward. Besides that, Chaudhary et al. (2019) also showed that L. plantarum and P. acidilactici grew well in noni juice and mulberry juice within 48 h fermentation in their study of feasibility of noni and mulberry as a raw substrate to produce probiotic noni and mulberry juice by lactic acid bacteria. As noni consist of abundance pectin polysaccharides, pectin polysaccharides molecules specifically compost of homogalacturonan (HG) or α-1, 4-linked units of d-galacturonic acid (GalA); rhamnogalacturonan I (RGI), containing repeating units of α-(1,4)-galacturonosyl and α-(1,2)-rhamnosyl with arabinan/galactan side chains; and rhamnogalacturonan II (RGII) substituted with various monosaccharides. Pectins or pectic oligosacharrides (POS) always been referred as one of highly potential prebiotic and currently being investigate further (Gomez et al., 2014). Pectin-containing matrices for encapsulation of Lactobacillus and Bifidobacterium have been used in several research to promote bacterial survival in intestinal environments. According to Chaluvadi et al. (2012), when compared to alginate alone, symbiotic matrices supplemented with POS exhibited a greater protective effect on B. breve, L. acidophilus, and L. reuteri. Meanwhile, Khorasani and Shojaosadati (2016) revealed a pectin-based formulation that was employed to entrap probiotic Bacillus coagulans and boost its survival rate in gastrointestinal fluids.
Although viable cell count in medium supplemented with mung bean recorded the highest count (9.50 x 10⁸ CFU/mL) at 24 h incubation, the bacteria did not survive till the end of incubation at 48 h which concluded that it was not a potential prebiotic for survivability of L. mindensis CA4. This data was supported by Wu et al. (2015) where they found L. plantarum reached the highest growth at 5 h of incubation time and decrease in number of viable cells thereafter. The reason of the bacteria grown in high population within the time possibility due to the prebiotic content of the mung bean. L. fermentum and L. plantarum growth were reported to be stimulated by 4.95 and 5.25 times, respectively, by soybean soluble polysaccharides high in Gal A and Ara within 24 h reported by Lin et al. (2020). Wu et al. (2015) also demonstrated that the metabolites produced by the fermentation process also aided the release of angiotensin I-converting enzyme (ACE) inhibitory peptides throughout the in vitro gastrointestinal digestion process. The protein from mung beans is a good source of ACE inhibitory peptides. Unfortunately, the ACE inhibitory activity only lasts within 5 h. Therefore, noni fruit is the most suitable and complementary prebiotic for L. mindensis CA4.
Growth compatibility of lactobacillus mindensis CA4 in different concentrations of prebiotics
The initial data for viable cell count of Lactobacillus mindensis CA4 in glucose-free MRS supplemented with prebiotics at various concentrations (0.5, 1.0, 1.5, 2.0 and 2.5%, v/v) along with MRS and glucose-free MRS medium as controls are tabulated in Table 4. The viable cell count in treatment supplemented with bambangan and noni increased with increasing concentrations. Contrary, the bacterial population count in medium supplemented with tuhau and torch ginger decreased with increasing concentrations. The viable cell count in medium supplemented with mung bean increased from concentration of 0.5-1.5% (v/v) and then decreased accordingly. The highest viable cell count was observed in medium-supplemented with bambangan at 2.5% (v/v) while the lowest in treatment with Glucose-free MRS. Bambangan and noni recorded a pH value at the range of 5.78 – 5.90, while tuhau, and torch ginger exhibited slightly higher pH (6.05–6.13).
Table 4: Cell viability of Lactobacillus mindensis CA4 in different types and concentrations of prebiotics before incubation.
|
Prebiotic |
Concentration (%, v/v) |
pH |
Viable cell |
|
CFU/mL (Mean ± SD) |
|||
|
MRS (Control) |
- |
6.20 ± 0.00 |
8.17 × 10⁶± 0.76 defg |
|
Glucose-free MRS (Control) |
- |
6.14 ± 0.00 |
5.83 × 10⁶ ± 0.76 h |
|
Bambangan |
0.5 |
5.80 ± 0.00 |
7.30 × 10⁶± 0.76 fgh |
|
1.0 |
5.80 ± 0.00 |
7.67 × 10⁶ ± 0.76 efg |
|
|
1.5 |
5.79 ± 0.00 |
1.00 × 10⁷± 0.05 bc |
|
|
2.0 |
5.79 ± 0.00 |
1.07 × 10⁷ ± 0.08 abc |
|
|
2.5 |
5.78 ± 0.00 |
1.18 × 10⁷ ± 0.13 a |
|
|
Noni |
0.5 |
5.80 ± 0.00 |
7.50 × 10⁶± 1.00 fg |
|
1.0 |
5.80 ± 0.00 |
7.33 × 10⁶± 0.58 fgh |
|
|
1.5 |
5.79 ± 0.00 |
9.00 × 10⁶± 0.50 cdef |
|
|
2.0 |
5.78 ± 0.00 |
8.83 × 10⁶± 1.04 cdef |
|
|
2.5 |
5.78 ± 0.00 |
9.30 × 10⁶± 1.04 cde |
|
|
Tuhau |
0.5 |
6.08 ± 0.00 |
1.02 × 10⁷± 0.08 abc |
|
1.0 |
6.08 ± 0.00 |
1.17 × 10⁷± 0.18 ab |
|
|
1.5 |
6.09 ± 0.00 |
1.13 × 10⁷± 0.10 ab |
|
|
2.0 |
6.09 ± 0.00 |
1.02 × 10⁷± 0.08 abc |
|
|
2.5 |
6.09 ± 0.00 |
8.83 × 10⁶± 0.76 cdef |
|
|
Torch ginger |
0.5 |
6.08 ± 0.00 |
8.83 × 10⁶± 1.04 cdef |
|
1.0 |
6.08 ± 0.00 |
1.02 × 10⁷± 0.08 abc |
|
|
1.5 |
6.06 ± 0.00 |
1.00 × 10⁷± 0.10 bc |
|
|
2.0 |
6.06 ± 0.00 |
8.83 × 10⁶± 0.76 cdef |
|
|
2.5 |
6.05 ± 0.00 |
9.00 × 10⁶± 0.50 cdef |
|
|
Mung bean |
0.5 |
6.13 ± 0.00 |
6.83 × 10⁶± 1.61 gh |
|
1.0 |
6.13 ± 0.00 |
8.67 × 10⁶± 0.76 cdef |
|
|
1.5 |
6.12 ± 0.00 |
1.00 × 10⁷± 0.05 bc |
|
|
2.0 |
6.12 ± 0.00 |
9.67 × 10⁶± 0.76 bcd |
|
|
2.5 |
6.12 ± 0.00 |
9.30 × 10⁶± 1.04 cde |
Note: All values are expressed as means ± standard deviation in triplicate. Data followed by the same letters are not significantly different (p < 0.05) according to Duncan’s multiple range test to evaluate the effect of investigated parameters. S.D: standard deviation.
Table 5 shows the viable cell count of L. mindensis CA4 in glucose-free MRS supplemented with prebiotics at various concentrations after 24 h incubation. The trend of bacterial population count was similar as before fermentation where the viable cells count in medium supplemented with bambangan and noni significantly increased with increasing concentrations. Meanwhile, medium supplemented with tuhau and touch ginger decreased in viable cell count with increasing concentrations. Inversely on medium treatment with mung bean, viable cell count increased from concentration of 0.5-1.5% (v/v) then decreased accordingly. The best three treatments [1.0 % (v/v) of tuhau, 0.5 % (v/v) of torch ginger and 1.5 % (v/v) of mung bean] recorded 1.86 times higher of viable cell count as compared to commercial MRS medium. While bambangan at 0.5% (v/v) and glucose-free MRS exhibited the lowest cells population at 3.33 x 10⁸ CFU/mL.
Table 5: Cell viability of Lactobacillus mindensis CA4 in different types and concentrations of prebiotics after 24 h of incubation.
|
Concentration (%, v/v) |
pH |
Viable cell |
|
|
CFU/mL (Mean ± SD) |
|||
|
MRS (Control) |
- |
4.53 ± 0.01 |
7.00 × 10⁸± 0.50 efghi |
|
Glucose-free MRS (Control) |
- |
5.75 ± 0.01 |
3.33 × 10⁸± 0.58 l |
|
Bambangan |
0.5 |
5.68 ± 0.01 |
3.33 × 10⁸± 0.28 l |
|
1.0 |
5.68 ± 0.01 |
3.83 × 10⁸± 0.58 kl |
|
|
1.5 |
5.66 ± 0.01 |
3.83 × 10⁸± 0.76 kl |
|
|
2.0 |
5.62 ± 0.01 |
5.17 × 10⁸± 1.53 ijkl |
|
|
2.5 |
5.54 ± 0.01 |
1.07 × 10⁹± 0.08 b |
|
|
Noni |
0.5 |
5.82 ± 0.01 |
4.33 × 10⁸± 1.04 jkl |
|
1.0 |
5.81 ± 0.01 |
5.67 × 10⁸± 1.26 hijk |
|
|
1.5 |
5.82 ± 0.01 |
6.00 × 10⁸± 2.00 hij |
|
|
2.0 |
5.70 ± 0.01 |
8.67 × 10⁸± 2.47 bcdef |
|
|
2.5 |
5.68 ± 0.01 |
9.67 × 10⁸± 1.04 bc |
|
|
Tuhau |
0.5 |
5.71 ± 0.01 |
6.33 × 10⁸± 1.53 ghij |
|
1.0 |
5.70 ± 0.01 |
1.33 × 10⁹± 0.13 a |
|
|
1.5 |
5.70 ± 0.01 |
9.00 × 10⁸± 1.00 bcde |
|
|
2.0 |
5.69 ± 0.01 |
6.83 × 10⁸± 0.76 fghi |
|
|
2.5 |
5.68 ± 0.01 |
5.17 × 10⁸± 0.76 ijkl |
|
|
Torch ginger |
0.5 |
5.68 ± 0.01 |
1.32 × 10⁹± 0.08 a |
|
1.0 |
5.69 ± 0.01 |
9.33 × 10⁸± 0.76 bcd |
|
|
1.5 |
5.68 ± 0.01 |
8.33 × 10⁸± 1.04 cdefg |
|
|
2.0 |
5.68 ± 0.01 |
5.50 × 10⁸± 0.50 hijk |
|
|
2.5 |
5.68 ± 0.01 |
4.67 × 10⁸± 1.26 jkl |
|
|
Mung bean |
0.5 |
5.73 ± 0.01 |
7.33 × 10⁸± 1.04 defgh |
|
1.0 |
5.73 ± 0.01 |
7.33 × 10⁸± 0.76 defgh |
|
|
1.5 |
5.72 ± 0.01 |
1.32 × 10⁹± 0.08 a |
|
|
2.0 |
5.70 ± 0.01 |
9.50 × 10⁸± 0.50 bc |
|
|
2.5 |
5.70 ± 0.01 |
8.17 × 10⁸± 0.76 cdefg |
Note: All values are expressed as means ± standard deviation in triplicate. Data followed by the same letters are not significantly different (p < 0.05) according to Duncan’s multiple range test to evaluate the effect of investigated parameters. S.D: standard deviation.
Table 6: Cell viability of Lactobacillus mindensis CA4 on different types and concentrations prebiotic samples after 48 h of incubation.
|
Prebiotic |
Concentration (%, v/v) |
pH |
Viable cell |
|
CFU/mL (Mean±SD) |
|||
|
MRS (Control) |
- |
3.82 ± 0.01 |
3.50 × 10⁷± 0.50 fg |
|
Glucose-free MRS (Control) |
- |
5.80 ± 0.01 |
- |
|
Bambangan |
0.5 |
5.85 ± 0.01 |
6.67 × 10⁶ ± 2.02 d |
|
1.0 |
5.84 ± 0.01 |
3.37 × 10⁷± 0.76 fg |
|
|
1.5 |
5.82 ± 0.01 |
3.00 × 10⁷± 0.00 g |
|
|
2.0 |
5.75 ± 0.01 |
8.17 × 10⁷ ± 0.76 c |
|
|
2.5 |
5.64 ± 0.01 |
3.33 × 10⁷ ± 0.29 fg |
|
|
Noni |
0.5 |
6.04 ± 0.01 |
6.00 × 10⁷ ± 2.65 de |
|
1.0 |
5.95 ± 0.01 |
1.55 × 10⁸ ± 0.05 b |
|
|
1.5 |
5.95 ± 0.01 |
1.43 × 10⁸ ± 0.03 b |
|
|
2.0 |
5.80 ± 0.01 |
2.55 × 10⁸ ± 0.13 a |
|
|
2.5 |
5.85 ± 0.01 |
4.33 × 10⁷ ± 1.26 fg |
|
|
Tuhau |
0.5 |
5.73 ± 0.01 |
9.17 × 10⁷ ± 1.26 c |
|
1.0 |
5.75 ± 0.01 |
4.67 × 10⁷ ± 0.76 ef |
|
|
1.5 |
5.73 ± 0.01 |
3.67 × 10⁷ ± 0.76 fg |
|
|
2.0 |
5.74 ± 0.01 |
3.67 × 10⁷ ± 0.76 fg |
|
|
2.5 |
5.72 ± 0.01 |
3.33 × 10⁷± 0.58 fg |
|
|
Torch ginger |
0.5 |
5.73 ± 0.01 |
- |
|
1.0 |
5.75 ± 0.01 |
- |
|
|
1.5 |
5.74 ± 0.01 |
- |
|
|
2.0 |
5.76 ± 0.01 |
- |
|
|
2.5 |
5.74 ± 0.01 |
- |
|
|
Mung bean |
0.5 |
5.58 ± 0.01 |
- |
|
1.0 |
5.56 ± 0.01 |
- |
|
|
1.5 |
5.55 ± 0.01 |
- |
|
|
2.0 |
5.55 ± 0.01 |
- |
|
|
2.5 |
5.54 ± 0.01 |
- |
Note: All values are expressed as means ± standard deviation in triplicate. Data followed by the same letters are not significantly different (p < 0.05) according to Duncan’s multiple range test to evaluate the effect of investigated parameters. S.D: standard deviation.
Phuriyakorn et al. (2019) stated that ethanol extracts of Etlingera elatior are high in chlorogenic acid based on an in vitro investigation using faecal batch culture demonstrating the prebiotic potential in improving gut homeostasis. Ghasemzadeh et al. (2015) found that the extract of Etlingera spp. from Kelantan, Malaysia, contained significant levels of phenolic and flavonoid components, contributing to its high antioxidant effects. Niyibituronsa et al. (2019) reports that fermented soybean products have higher antioxidant activity than unfermented ones. Besides that, Duh et al. (1997) stated that at a concentration of 100 ppm (0.01%) extraction of mung bean hulls exhibited stronger antioxidant activity than butylated hydroxyanisole on the peroxidation of linoleic acid which made them concluded that mung bean is a potential source of natural antioxidants owing to their marked antioxidant activity. In this study, high concentration of prebiotic could lead to inhibitory effect to bacterial growth. This study supported by Phuriyakorn et al. (2019) showed that the extracts of E. elatior did not enhance the growth of bifidobacteria and lactobacilli, and the populations of harmful bacteria reduced significantly (p<0.05) during faecal fermentation. This could be due to E. elatior extract that contains phenolic chemicals that have antibacterial properties.
Similar as before, Table 6 shows the viable cell count of L. mindensis CA4 population in glucose-free MRS supplemented with prebiotics samples with various concentrations after 48 h of incubation. The viable cell count pattern was slightly different than before fermentation and 24 h data. The viable cell count in 48 h for all treatments demonstrated decreased values in comparison to 24 h incubation time except for bambangan and noni. Viable cells count in these two treatments show an increased trend along with increasing concentrations (0.5 – 2.0, v/v). In medium supplemented with tuhau, the viable cell count decreased along with increasing concentrations. Whereas there were no viable cells observed in medium supplemented with torch ginger and mung bean as well as in glucose-free MRS. The highest viable cell count was observed in 2% (v/v) noni and lowest was in 0.5% (v/v) bambangan.
Titratable acidity of prebiotics medium by Lactobacillus mindensis CA4
Table 7 shows the lactic acid concentration (LAC) (%) in medium supplemented with prebiotics at various concentrations before and after fermentation along with MRS and glucose-free MRS as controls. The LAC before and after fermentation was significantly different between all treatments. However, there is no significant difference of LAC between the concentrations for all treatments after the fermentation except for bambangan and mung bean. LAC was increased in medium supplemented of bambangan, noni and mung bean with increasing concentrations (0.5-2.5%, v/v). MRS resulted in the highest LAC whereas glucose-free MRS gave the lowest value. Among the prebiotics, treatment with 0.5% (v/v) of bambangan and noni were the lowest and treatment with 2.5% (v/v) of mung bean was the highest.
Table 7: The lactic acid concentration (%) of prebiotic sources before and after 48 h of fermentation.
|
Prebiotic |
Concentration (%, v/v) |
Lactic acid concentration (%±SD) |
|
|
Before fermentation (0 h) |
After fermentation (48 h) |
||
|
MRS (Control) |
- |
0.000 |
2.224 ± 0.045 a |
|
Glucose-free MRS (Control) |
- |
0.000 |
0.123 ± 0.098 p |
|
Bambangan |
0.5 |
0.009 |
0.240 ± 0.052 o |
|
1.0 |
0.270 ± 0.000 o |
||
|
1.5 |
0.420 ± 0.052 lmn |
||
|
2.0 |
0.480 ± 0.052 jkl |
||
|
2.5 |
0.841 ± 0.052 e |
||
|
Noni |
0.5 |
0.009 |
0.240 ± 0.052 o |
|
1.0 |
0.390 ± 0.052 mn |
||
|
1.5 |
0.360 ± 0.000 n |
||
|
2.0 |
0.450 ± 0.000 klm |
||
|
2.5 |
0.420 ± 0.052 lmn |
||
|
Tuhau |
0.5 |
0.000 |
0.510 ± 0.052 ijk |
|
1.0 |
0.540 ± 0.000 ghi |
||
|
1.5 |
0.600 ± 0.053 fg |
||
|
2.0 |
0.570 ± 0.053 fgh |
||
|
2.5 |
0.631 ± 0.000 f |
||
|
Torch ginger |
0.5 |
0.000 |
0.540 ± 0.000 ghi |
|
1.0 |
0.570 ± 0.053 fgh |
||
|
1.5 |
0.631 ± 0.000 f |
||
|
2.0 |
0.570 ± 0.053 fgh |
||
|
2.5 |
0.600 ± 0.053 fg |
||
|
Mung bean |
0.5 |
0.000 |
0.894 ± 0.012 de |
|
1.0 |
0.961 ± 0.052 cd |
||
|
1.5 |
0.991 ± 0.000 c |
||
|
2.0 |
1.021 ± 0.052 c |
||
|
2.5 |
1.111 ± 0.052 b |
||
Note: All values are expressed as means ± standard deviation in triplicate. Data followed by the same letters are not significantly different (p < 0.05) according to Duncan’s multiple range test to evaluate the effect of investigated parameters. S.D: standard deviation.
Extending the growing period to more than 24 h did not result in a substantial increase in the number of viable bacteria cells. Sugar metabolism was characterised by the uptake of glucose during the fermentation of the medium enriched with prebiotics, but the fermented medium maintained the sugars when acidification began. According to Rault et al. (2009), such high pH values were compatible with high cellular viability and acidification activity. Combining these data, it is possible to conclude that cellular viability and membrane integrity are only maintained at high levels when the pH is kept high, as in pH 5 cultures. On the contrary, when a low pH gradient was recorded, the cells viability and membrane integrity were disturbed. This study also could support the reason of dead bacterial population in medium supplemented with mung bean where its pH reading continued to decrease from 24 h to 48 h incubation. But the others were adjusted to their own optimal pH, involving slight increase in pH to maintain cell viability.
With an increase in concentration, a greater amount of lactic acid was required to lower the acidity to the same pH level as indicated by greater titratable acidity during the fermentation process. This was shown in Table 7 where LAC significantly increased in medium supplemented of bambangan, noni and mung bean with increasing concentrations (0.5-2.5%). However, this concept did not apply to LAC of medium supplemented with tuhau and torch ginger where the LAC has no significant difference from each concentration. Furthermore, the concentration of tuhau and torch ginger prebiotic did not affect the pH value and there was also no significant difference seen between pH under different concentration within 24 to 48 h (Tables 5 and 6). Next, there is a significant difference between LAC before and after fermentation time in all treatments (Table 7). This proves that production of lactic acid did not occur before fermentation and only happened after incubation time (48 h). In addition, anaerobic fermentation increases the concentration of lactic acid in the medium sample. The increase of lactic acid then causes a decrease of pH cells. The MRS medium produced the highest level of lactic acid (Table 7) and the lowest pH value (Table 6). Previous findings pointed out, however, that the titratable acidity-pH relationship is not constant under all conditions and can be altered by things like organism type, initial apparent acidity, and buffer capabilities (Ratzke and Gore, 2018; Wilkowske, 1954).
Conclusion and Recommendations
The most preferred prebiotic for Lactobacillus mindensis CA4 was determined to be noni fruit due to constant leading in the viable cell count up until 48 h of fermentation. The viable cells count in the glucose-free MRS medium supplemented with noni was recorded at 2.55 x 10⁸ CFU/mL after 48 h of fermentation. Moreover, in the effect of concentration of prebiotics towards the growth of L. mindensis CA4, different types of prebiotics exhibited diverse patterns throughout the 48 h of incubation time. The number of viable cells in medium supplemented with bambangan, noni, and mung bean were increased with increasing concentrations while tuhau and torch ginger demonstrated an opposite trend. Contrary, on medium treatment with mung bean the bacterial population increased from concentration of 0.5-1.5% (v/v) then decreased accordingly. The result demonstrated that the types and concentrations of prebiotics influence the bacterial growth population. More in-depth studies such as screening more prebiotics, genomic and metabolic analysis, and optimization of the fermentation culture conditions are needed in the following work.
Acknowledgements
This work was supported by the Universiti Malaysia Sabah internal grants: SBK0522-2022 and GUG0639-2/2023.
Novelty Statement
As a result of the advantageous properties of prebiotics and probiotics, symbiotics which is a product that include both ingredients and are specifically used by lactic acid bacteria have been developed. Understanding how to implement a substrate selectively is essential since each bacterial strain has distinct affinity for its substrate. The authors have revealed from this investigation that noni fruit was the prevalent prebiotic for the locally isolated probiotic lactic acid bacterium, Lactobacillus mindensis CA4 since it consistently led in viable bacterial populations for up to 48 hours and increased the number of viable cells with increasing concentrations.
Author’s Contribution
Roslina Jawan and Jualang Azlan Gansau: Conceptualization
Dyana Louis Anak Peter, Elldiwirna Saimen and Lucky Poh Wah Goh: Methodology.
Roslina Jawan and Rahmath Abdulla: Validation.
Dyana Louis Anak Peter and Roslina Jawan: Formal analysis.
Dyana Louis Anak Peter, Elldiwirna Saimen: Investigation, data curation
Jualang Azlan Gansau, Mohd. Khalizan Sabullah and Roslina Jawan: Resources.
Dyana Louis Anak Peter: Writing original draft.
Dyana Louis Anak Peter and Roslina Jawan and Rahmath Abdulla: Writing review and editing.
Mohd. Khalizan Sabullah and Lucky Poh Wah Goh: Visualization.
Roslina Jawan and Jualang Azlan Gansau: Supervision.
Roslina Jawan, Jualang Azlan Gansau and Mohd. Khalizan Sabullah: Project administration.
Roslina Jawan: Funding acquisition.
All authors have read and agreed to the published version of the manuscript.
Conflict of interest
The authors have declared no conflict of interest.
References
Bui, A.K.T., A. Bacic and F. Pettolino. 2006. Polysaccharide composition of the fruit juice of Morinda citrifolia (Noni). Phytochemistry, 67(12): 1271–1275. https://doi.org/10.1016/j.phytochem.2006.04.023
Chaluvadi, S., A.T. Hotchkiss, J.E. Call, J.B. Luchansky, J.G. Phillips, L. Liu and K.L. Yam. 2012. Protection of probiotic bacteria in a symbiotic matrix following aerobic storage at 4 ºC. Benef. Microbes, 3: 175-187. https://doi.org/10.3920/BM2012.0005
Charalampopoulos, D., and R.A. Rastall. 2012. Prebiotics in foods. Curr. Opin. Biotechnol., 23(2): 187–191. https://doi.org/10.1016/j.copbio.2011.12.028
Chaudhary, A., V. Sharma and B.S. Saharan. 2019. Probiotic potential of noni and mulberry juice fermented with lactic acid bacteria. Asian J. Dairy Food Res., 38(2): 114-120. https://doi.org/10.18805/ajdfr.DR-1435
Crittenden, R., S. Karppinen, S. Ojanen, M. Tenkanen, R. Fagerström, J. Mättö, M. Saarela, T. Mattila-Sandholm and K. Poutanen. 2002. In vitro fermentation of cereal dietary fibre carbohydrates by probiotic and intestinal bacteria. J. Sci. Food Agric., 82(8): 781–789. https://doi.org/10.1002/jsfa.1095
Dalu, K.C.A., N. Nurhayati and J. Jayus. 2019. In vitro modulation of fecal microflora growth using fermented “pisang mas” banana and red guava juices. Curr. Res. Nutr. Food Sci., 7(2): 449-456. https://doi.org/10.12944/CRNFSJ.7.2.14
Davani-Davari, D., M. Negahdaripour, I. Karimzadeh, M. Seifan, M. Mohkam, S.J. Masoumi, A. Berenjian and Y. Ghasemi. 2019. Prebiotics: Definition, types, sources, mechanisms, and clinical applications. Foods, 8(3): 92. https://doi.org/10.3390/foods8030092
Duh, P.D., W.J. Yen, P.C. Du and G.C. Yen. 1997. Antioxidant activity of mung bean hulls. J. Am. Oil Chem. Soc., 74(9): 1059–1063. https://doi.org/10.1007/s11746-997-0025-0
Food and Agriculture Organization of the United Nations (FAO), World Health Organization. 2006. Probiotics in food: health and nutritional properties and guidelines for evaluation. FAO Agriculture Series No. 37.
Ghasemzadeh, A., H.Z.E. Jaafar, A. Rahmat and S. Ashkani. 2015. Secondary metabolites constituents and antioxidant, anticancer and antibacterial activities of Etlingera elatior (Jack) R.M. Sm grown in different locations of Malaysia. BMC Complement. Altern. Med., 15(1). https://doi.org/10.1186/s12906-015-0838-6
Gibson, G.R., H.M. Probert, J.V. Loo, R.A. Rastall and M.B. Roberfroid. 2004. Dietary modulation of the human colonic microbiota: Updating the concept of prebiotics. Nutr. Res. Rev., 17(2): 259–275. https://doi.org/10.1079/NRR200479
Gómez, B., B. Gullón, C. Remoroza, H.A. Schols, J.C. Parajó and J.L. Alonso. 2014. Purification, characterization, and prebiotic properties of pectic oligosaccharides from orange peel wastes. J. Agric. Food Chem., 62: 9769-9782. https://doi.org/10.1021/jf503475b
Hernández-Hernández, O., A. Muthaiyan, F.J. Moreno, A. Montilla, M.L. Sanz and S.C. Ricke. 2012. Effect of prebiotic carbohydrates on the growth and tolerance of Lactobacillus. Food Microbiol., 30(2): 355–361. https://doi.org/10.1016/j.fm.2011.12.022
Iyer, C. and K. Kailasapathy. 2005. Effect of co-encapsulation of probiotics with prebiotics on increasing the viability of encapsulated bacteria under in vitro acidic and bile salt conditions and in yogurt. J. Food Sci., 70(1): M18-M23. https://doi.org/10.1111/j.1365-2621.2005.tb09041.x
Jawan, R., S. Abbasiliasi, J.S., Tan, M.R. Kapri, S. Mustafa, M. Halim and A.B. Ariff. 2021. Evaluation of the estimation capability of response surface methodology and artificial neural network for the optimization of bacteriocin-like inhibitory substances production by Lactococcus lactis Gh1. Microorganisms, 9(3): 579. https://doi.org/10.3390/microorganisms9030579
Kasimin, M.E., A.A.M. Faik, J. Jani, S. Abbasiliasi, A.B. Ariff and R. Jawan. 2020. Probiotic properties of antimicrobial-producing lactic acid bacteria isolated from dairy products and raw milks of Sabah (Northern Borneo), Malaysia. Malays. Appl. Biol., 49(3): 95–106. https://doi.org/10.55230/mabjournal.v49i3.1580
Khorasani, A.C. and S.A. Shojaosadati. 2016. Bacterial nanocellulose-pectin bio-nanocomposites as prebiotics against drying and gastrointestinal condition. Int. J. Biol. Macromol., 83: 9-18. https://doi.org/10.1016/j.ijbiomac.2015.11.041
Laosee, W., D. Kantachote, W. Chansuwan and N. Sirinupong. 2022. Effects of probiotic fermented fruit juice-based biotransformation by lactic acid bacteria and Saccharomyces boulardii CNCM I-745 on anti-salmonella and antioxidative properties. J. Microbiol. Biotechnol., 32(10): 1315-1324. https://doi.org/10.4014/jmb.2206.06012
Lin, D., X. Long, L. Xiao, Z. Wu, H. Chen, Q. Zhang, D. Wu, W. Qin and B. Xing. 2020. Study on the functional properties and structural characteristics of soybean soluble polysaccharides by mixed bacteria fermentation and microwave treatment. Int. J. Biol. Macromol., pp. 561–568. https://doi.org/10.1016/j.ijbiomac.2020.04.133
Marchesi, J.R., D.H. Adams, F. Fava, G.D.A. Hermes, G.M. Hirschfield, G. Hold, M.N. Quraishi, J. Kinross, H. Smidt, K.M. Tuohy, L.V. Thomas, E.G. Zoetendal and A. Hart. 2016. The gut microbiota and host health: A new clinical frontier. Gut, 65(2): 330–339. https://doi.org/10.1136/gutjnl-2015-309990
Niyibituronsa, M., A.N. Onyango, S. Gaidashova, S. Imathiu, M.D. Boevre, D. Leenknecht, E. Neirnck, S.D. Saeger, P. Vermeir and K. Raes. 2019. The growth of different probiotic microorganisms in soymilk from different soybean varieties and their effects on antioxidant activity and oligosaccharide content. J. Food Res., 8(1): 41. https://doi.org/10.5539/jfr.v8n1p41
Patel, S. and A. Goyal. 2012. The current trends and future perspectives of prebiotics research: A review. 3 Biotech, 2(2): 115–125. https://doi.org/10.1007/s13205-012-0044-x
Pérez-Burillo, S., S. Molino, B. Navajas-Porras, A.J. Valverde-Moya, D. Hinojosa-Nogueira, A. López-Maldonado, S. Pastoriza and J.A. Rufián-Henares. 2021. An in vitro batch fermentation protocol for studying the contribution of food to gut microbiota composition and functionality. Nat. Prot., 16(7): 3186–3209. https://doi.org/10.1038/s41596-021-00537-x
Phuriyakorn, S., V. Seechamnanturakit and S. Wichienchot. 2019. Antioxidant and prebiotic gut-microbiota effects of dietary phenolic compounds in Etlingera elatior extracts. Int. Food Res. J., 26(2): 1751–1761.
Prabawati, N.B., V. Oktavirina, M. Palma and W. Setyaningsih. 2021. Edible flowers: Antioxidant compounds and their functional properties. Horticulturae, 7(4): 66. https://doi.org/10.3390/horticulturae7040066
Ratzke, C. and J. Gore. 2018. Modifying and reacting to the environmental pH can drive bacterial interactions. PLoS Biol., 16(3): e2004248. https://doi.org/10.1371/journal.pbio.2004248
Rault, A., M. Bouix and C. Béal. 2009. Fermentation pH influences the physiological-state dynamics of Lactobacillus bulgaricus CFL1 during pH-controlled culture. Appl. Environ. Microbiol., 75(13): 4374–4381. https://doi.org/10.1128/AEM.02725-08
Rodríguez, H., J.A. Curiel, J.M. Landete, B. de las Rivas, F.L. de Felipe, C. Gómez-Cordovés, J.M. Mancheño and R. Muñoz. 2009. Food phenolics and lactic acid bacteria. Int. J. Food Microbiol., 132(2–3): 79–90. https://doi.org/10.1016/j.ijfoodmicro.2009.03.025
Schrezenmeir, J. and M. de Vrese. 2001. Probiotics, prebiotics, and symbiotics approaching a definition. Am. J. Clin. Nutr., 73(2 Suppl): 361S-364S. https://doi.org/10.1093/ajcn/73.2.361s
Serra, D., L.M. Almeida and T.C. Dinis. 2018. Dietary polyphenols: A novel strategy to modulate microbiota- gut-brain axis. Trends Food Sci. Technol., 78: 224-233. https://doi.org/10.1016/j.tifs.2018.06.007
Sharma, R., B. Diwan, B.P. Singh and S. Kulshrestha. 2022. Probiotic fermentation of polyphenols: Potential sources of novel functional foods. Food Prod. Process Nutr., 4: 21. https://doi.org/10.1186/s43014-022-00101-4
Tang, D., Y. Dong, H. Ren, L. Li and C. He. 2014. A review of phytochemistry, metabolite changes, and medicinal uses of the common food mung bean and its sprouts (Vigna radiata). Chem. Central J., 8(1): 4. https://doi.org/10.1186/1752-153X-8-4
Tangah, J., F.E. Bajau, W. Jilimin, H.T. Chan, S.K. Wong and E.W.C. Chan. 2017. Phytochemistry and pharmacology of Mangifera pajang: An iconic fruit of Sabah, Malaysia. Syst. Rev. Pharm., 8(1): 86–91. https://doi.org/10.5530/srp.2017.1.15
Tegegne, B.A. and B. Kebede. 2022. Probiotics, their prophylactic and therapeutic applications in human health development: A review of the literature. Heliyon, 8(6): e09725. https://doi.org/10.1016/j.heliyon.2022.e09725
Ventura, M., S. O’Flaherty, M.J. Claesson, F. Turroni, T.R. Klaenhammer, D. van Sinderen and P.W. O’Toole. 2009. Genome-scale analyses of health-promoting bacteria: Probiogenomics. Nat. Rev. Microbiol., 7(1): 61–71. https://doi.org/10.1038/nrmicro2047
Wang, C-Y., N. Chang-Chai, S. Hsuan, T. Wen-Sheng and S. Yuan-Tay. 2009. Probiotic potential of noni juice fermented with lactic acid bacteria and bifidobacteria. Int. J. Food Sci. Nutr., 60(Suppl 6): 98-106. https://doi.org/10.1080/09637480902755095
Wilkowske, H.H., 1954. Relationship between titratable acidity and pH during lactic acid fermentation in reconstituted Nonfat milk. J. Dairy Sci., 37(1): 22-29. https://doi.org/10.3168/jds.S0022-0302(54)91227-8
Wu, H., X. Rui, W. Li, X. Chen, M. Jiang and M. Dong. 2015. Mung bean (Vigna radiata) as probiotic food through fermentation with Lactobacillus plantarum B1-6. LWT Food Sci. Technol., 63(1): 445–451. https://doi.org/10.1016/j.lwt.2015.03.011
Zeng, Y., W. Zhou, J. Yu, L. Zhao, K. Wang, Z. Hu and X. Liu. 2023. By-products of fruit and vegetables: antioxidant properties of extractable and non-extractable phenolic compounds. Antioxidants, 12(2): 418. https://doi.org/10.3390/antiox12020418
To share on other social networks, click on any share button. What are these?


