

High Pathogenicity Island (HPI) Main Structural Genes and their Bioinformatics Analysis in Clinically Isolated E. coli from Saba Pigs


High Pathogenicity Island (HPI) Main Structural Genes and their Bioinformatics Analysis in Clinically Isolated E. coli from Saba Pigs
Chunlan Shan1, Chaoying Liu1, Qin Lu1, Guowen Fu2, Syed Aftab Hussain Shah3, Rana Waseem Akhtar4, Ru Zhao2, Libo Gao2, Chang Liu2, Shushu Miao2, Hongdan Wang2 and Hong Gao2*
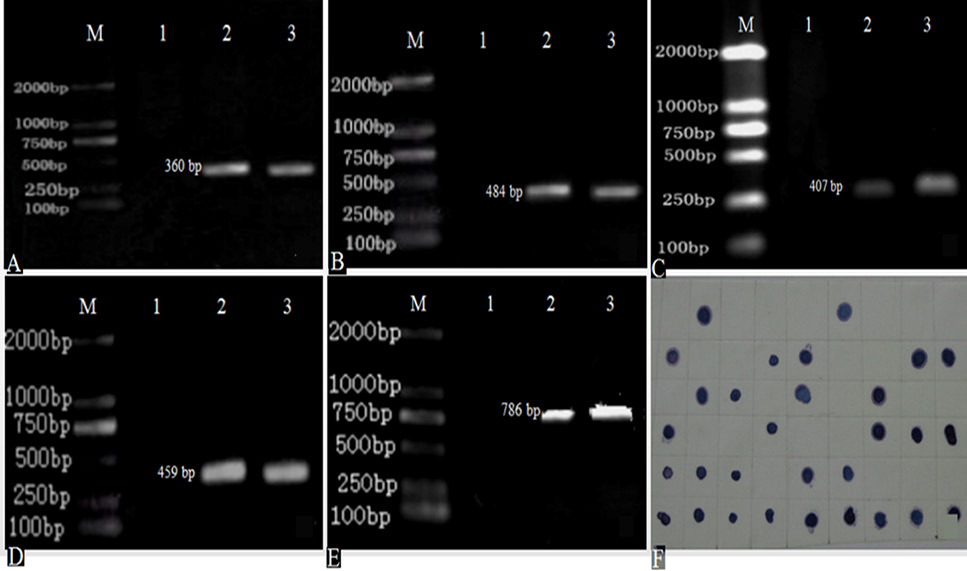
Detection of PCR and colony spots in situ hybridization for HPI irp1, irp2, irp3, irp4, irp5 gene (A-E, genetic test results of HPI irp1, irp2, irp3, irp4, irp5 in turn; F, colony spot hybridization for irp2 gene; M, DL 2000 Marker; 1, negative control; 2, positive strain; 3, experimental strain).

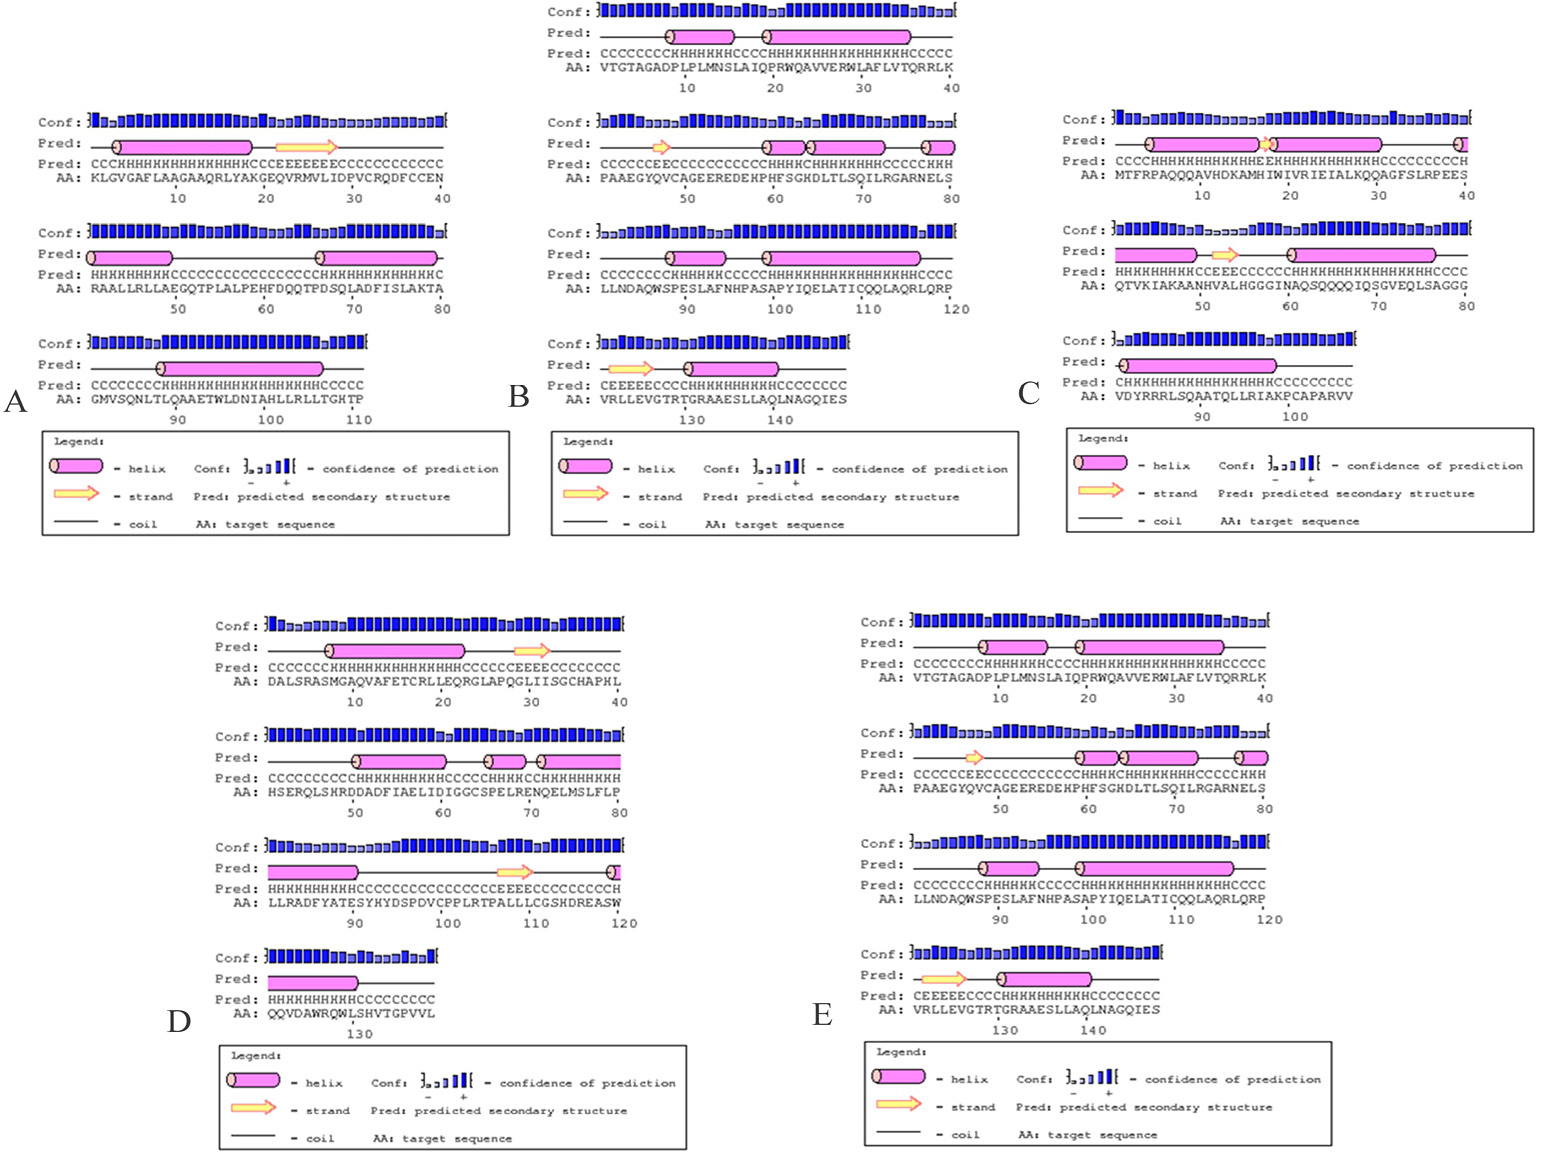
Predication of protein secondary structure of HPI major structure genes (A-E, in sequence, prediction of protein secondary structure of irp1, irp2, irp3, irp4 and rp5 genes, respectively).
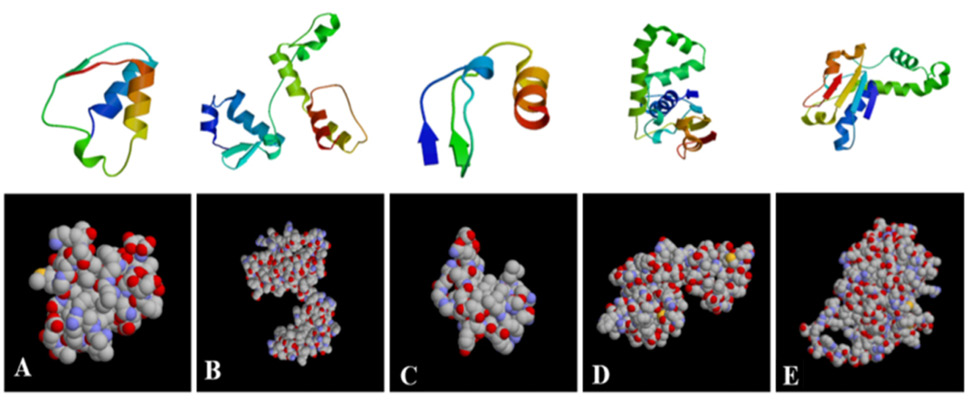
Prediction of protein tertiary structure of HPI major structure genes (A-E, in sequence, prediction of protein tertiary structure prediction of irp1, irp2, irp3, irp4 and irp5 genes).
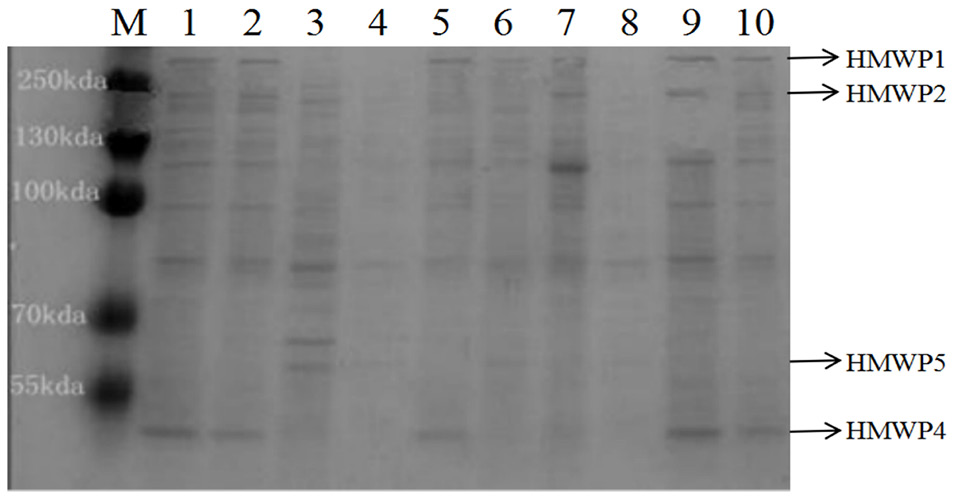
The expression profile of HMWPs under iron starvation (M: Protein marker; 1, Positive strain; 2-10, The experimental strains. HMWPs bands, irp1-348kDa, irp2-229kDa, irp4-29kDa, irp5-57kDa; irp3 was the basic protein (pH 8.8) so did not detect protein bands).

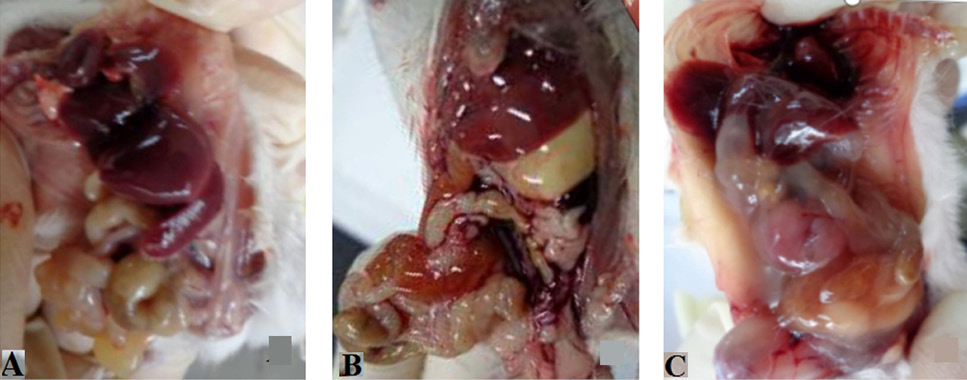
Gross pathological signs of mice (A, control group; B, HPI+ infection group; C, HPI- infection group).
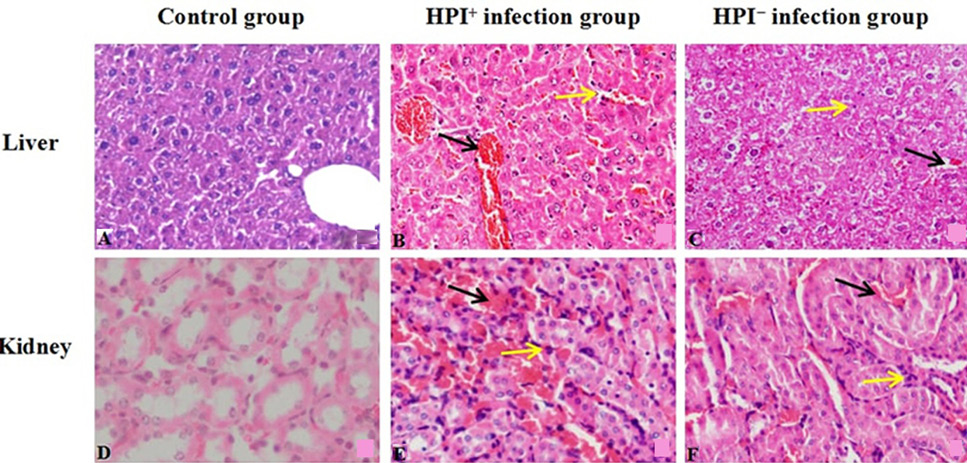
Histopathology observations of liver and kidney in mice (HE, 400×); A, liver of control group; B, liver of HPI+ -infection group; C, liver of HPI--infection group; D, kidney of control group; E, kidney of HPI+-infection group; F, kidney of HPI--infection group). Black arrow indicates red blood cells; yellow arrow indicates lymphocyte infiltrations.
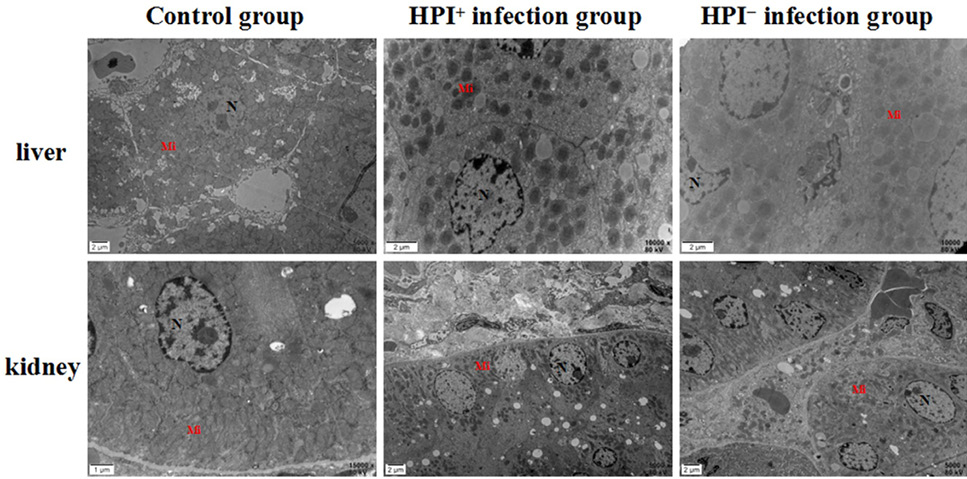
Ultrastructural histopathology observations of liver and kidney in mice. Control group, HPI+-infection group, and HPI--infection group.


