
Glucomannan Potential of Banana Corms (Musa paradisiaca) as Prebiotics


Research Article
Glucomannan Potential of Banana Corms (Musa paradisiaca) as Prebiotics
Nurul Fajrih1,2, Komang Gede Wiryawan1*, Sumiati1 and Suraya Kaffi Syahpura3
1Department of Nutrition and Feed Technology, Faculty of Animal Science, IPB University, Indonesia; 2Department of Animal Science, Faculty of Agriculture, Mulawarman University, Indonesia; 3Department of Animal Husbandry of Politeknik Negeri Lampung, Indonesia.
Abstract | This study aims to extract and isolate glucomannan from banana corm and evaluate its potential as a prebiotic in vitro. Extraction activities were carried out by maceration with a ratio of 1: 10, namely 200 g of banana corm flour and 2 liters of aquadest by chromatographic column elution using ethanol as the mobile phase and diaion as the stationary phase. Further tested to determine the content of glucomannan in the extract. The extract was tested as carbon source for lactic acid bacteria (L. plantarum and L. rhamnosus) and pathogenic bacteria (E. coli and Salmonella). Bacterial growth Media using control media without sugar sources, MRS + glucose media, and MRS + banana corm extract (BCE) media. Based on the results of the study, BCE contains glucomannan by 33.59% with a yield of 14.15%, and in vitro test results show that BCE is only able to be fermented by the lactic acid bacteria but not by pathogens. In addition, BCE can be utilized as a source of carbon for the growth of lactic acid bacteria characterized by the growth of L. plantarum and L. rhamnosus which continues to increase the number of cells until the incubation period of 48 hours each amounted to 8.107 log CFU/ml and 7.771 Log CFU / ml while in pathogenic bacteria there is no growth. Based on this result, it can be concluded that BCE can be used as a prebiotic.
Keywords | Glucomannan, Prebiotics, Polysaccharides, Banana corms, LAB
Received | June 10, 2023; Accepted | September 16, 2023; Published | November 20, 2023
*Correspondence | Komang Gede Wiryawan, Departement of Nutrition and Feed Technology, Faculty of Animal Science, IPB University, Indonesia; Email: [email protected]
Citation | Fajrih N, Wiryawan KG, Sumiati and Syahpura SK (2023). Glucomannan potential of banana corms (Musa paradisiaca) as prebiotics. Adv. Anim. Vet. Sci., 11(11):1887-1896.
DOI | https://dx.doi.org/10.17582/journal.aavs/2023/11.11.1887.1896
ISSN (Online) | 2307-8316
Copyright: 2023 by the authors. Licensee ResearchersLinks Ltd, England, UK.
This article is an open access article distributed under the terms and conditions of the Creative Commons Attribution (CC BY) license (https://creativecommons.org/licenses/by/4.0/).
INTRODUCTION
The banana plant is one of Indonesia’s leading plants that are widely cultivated for fruit. Banana crop production is reported to increase every year. In 2019 it reached 7.280.658 tons and increased up to 8.182.756 tons in 2020 (BPS, 2020). The high production of banana plants produces a lot of waste, including the highest, in the form of banana corms. The corm is a banana stem in the form of a tuber found at the bottom of the banana plant. Based on the data obtained in the field that banana cultivation in 1 hectare with a planting distance of 3 x 3 meters can produce a maximum of 1000 banana plant clumps in a year. The average weight of a banana corm in one tree is 10-15 kg which can be assumed that in a year a banana plant produces a fairly large waste of banana corms of 10-15 tons. The corm is not handled and left to rot in the soil because it is considered a waste that is not useful and of economic value, even though it is reported to have a fairly high nutritional and fiber content.
The dried banana corm has the main chemical content in the form of carbohydrates of 79.16% and these carbohydrates contain 29.62% fiber, 36.7% hemicellulose, and 74.99% starch (Saragih, 2013; Haryati et al., 2011; Rahmawati, 2019). The high content of carbohydrates and fiber in banana corms is very likely to be used as a source of new prebiotics including the possibility of oligosaccharide compounds and polysaccharide compounds. These compounds are carbohydrates that can not be digested and are known to have a prebiotic effect because they are selectively able to increase the growth of beneficial bacteria in the intestines (Rusdi et al., 2021). In addition, it can be fermented by bacteria into short-chain fatty acids, especially acetate, propionate, and butyrate to lower intestinal pH whose impact can inhibit the growth of pathogenic bacteria including Salmonella and E. coli (Lam and Cheung, 2013).
Prebiotics that are generally given to poultry includes those from the oligosaccharides group such as fructooligosaccharides (FOS), manooligosaccharides (MOS), galactooligosaccharides (GOS), xylooligosaccharides (XOS), raffinose and stachyose. However, currently, prebiotic studies are not only derived from oligosaccharide components but have also been widely studied and developed other candidates that function as prebiotics including from the polysaccharide group such as inulin, cellulose, hemicellulose, pectin, glucomannan, and resistant starch. It is considered a potential prebiotic because its properties show some characteristics similar to oligosaccharide prebiotics (Ricke et al., 2020). This is supported by the opinion of Rusdi et al. (2021) who stated that in the last five years, researchers in the world have begun to shift to explore new sources of prebiotics in agricultural products because, in addition to being cheap, they are also available in large quantities and can help reduce waste and pollutants.
The high hemicellulose content in corm waste is thought to contain the main polysaccharide in the form of glucomannan. According to Aryanti and Abidin (2015), glucomannan is a polysaccharide of the hemicellulose type consisting of galactose, glucose, and mannose chain bonds where the main chain bonds are glucose and mannose while the branch is galactose. Glucomannan is a water-soluble polysaccharide that has a molecular weight between 200.000–2.000.000 which is composed of D-mannose and D-glucose units with a ratio of 1.6: 1 bound together in a ß-1, 4 bond which makes glucomannan indigestible by digestive enzymes so that it can function as a prebiotic (Harmayani et al., 2014; Anggela et al., 2020). Several studies have been carried out to obtain glucomannan from various plants, including the most developed, namely the porang plant. Saputro et al. (2014) obtained glucomannan from porang tubers by 36.69%-64.22% which was extracted from various ethanol concentrations using a UV-Vis Spectrophotometer. Wardani et al. (2021) reported glucomannan levels in porang tubers of 38.53% which were also extracted with ethanol using a UV-Vis Spectrophotometer. Meanwhile, Widjanarko and Megawati (2015) reported glucomannan levels in konjac flour of 63.49% extracted with ethanol using the gravimetric method. Research on the glucomannan potential of banana corms as prebiotics is still limited, so it is necessary to conduct studies to obtain glucomannan from banana corms considering their abundant potential in nature and can become a new source of glucomannan production. In addition, given the content of oxalic acid in porang and konjac tubers, it causes limited use of glucomannan which is generally developed. This study aims to extract and isolate glucomannan from banana corms and evaluate its potential as a prebiotic that can support the growth of beneficial bacteria.
MATERIALS AND METHODS
Preparation of tools and materials
The material used to extract is a banana corm kepok (Musa paradisiaca) obtained from Tanggamus Regency, Lampung Province. Wet banana corms were cleaned with running water to remove adhering dirt. Next, the banana corm was sliced into thin strips with a thickness of 0.5 cm. After that, it was dried by drying in the sun for 3 days or dried using an oven at a temperature of 60o C for 15 hours. After drying, then grind until banana corm flour was obtained.
Extraction procedure and fractionation
The extraction procedure was carried out based on the modified methods of Subeki et al. (2004) and Syahpura et al. (2015). The extraction process is carried out by elution of chromatographic columns using ethanol as the mobile phase and diaion as the stationary phase. Extraction was carried out by maceration in a ratio of 1: 10, namely 200 g of banana corm flour and 2 liters of aqua dest (H2O). The material was mixed and then heated for 30 minutes then further filtered until a filtrate and pulp were obtained. The filtrate obtained in the form of a liquid extract was then concentrated using a rotary vacuum evaporator at a temperature of 400C until a viscous extract was obtained. The extract fraction obtained was then incorporated into diaion HP-20 chromatographic columns and diluted with H2O (1 L), 20% H2O/EtOH (1 L), and 50% H2O/EtOH (1L) and EtOH (1 L) respectively. Each extract fraction was then qualitatively tested using HPLC to determine whether there was a prebiotic content in the sample. The prebiotic standards used are FOS (fructooligosaccharides), glucomannan, and inulin. Fractions containing prebiotics were then analyzed using a UV-Vis Spectrophotometer to determine their levels.
Analysis of banana corms glucomannan levels
Banana corm extract (BCE) containing glucomannan was then quantitatively analyzed using UV Vis Spectrophotometer with DNS (Dinitro Salicylic Acid) method according to the method (Chua et al., 2012). The procedure, among others, the first is the manufacture of 3,5-dinitro salicylic acid (DNS) which consists of two mixed solutions, namely solution A and B. Solution A is prepared by mixing 0.7 g of phenol, 1.5 mL of sodium hydroxide (10%), 5 mL of aqua dest and 0.7 g of sodium bisulfite. Solution B is prepared by mixing 22.5 g of potassium sodium tartrate, 30 mL of sodium hydroxide (10 %), and 88 mL of 3,5-dinitrosalicylic acid (DNS) solution (1%). Solution A and solution B were then mixed and stored in a brown reagent bottle at room temperature.
The next procedure was the manufacture of sodium hydroxide formic acid buffer. Buffer’s solution (formic acid and sodium hydroxide 0.1 M) was prepared by mixing 1 mL of formic acid with 60 mL of aquadest into a 250 mL dosing flask and then adding 50 ml of 0.5% NaOH solution, diluted with aquadest to the mark. Then proceed to the manufacture of standard glucose (1 mg/mL) diluted and taken as much (0.4; 0.5; 0.6; 0.7; 0.8; 1.0) mL and added aquadest up to each volume of 2 mL standard glucose solution into a 25 ml measuring flask and then 1.5 mL of 3,5 - dinitrosalicylic acid (DNS) solution was added and homogenized. Next, the mixture was heated in a waterbath for 5 minutes, cooled, and aquadest was added to a volume of 25 mL. Absorbance was measured at a wavelength of 550 nm.
The process of making the extract was based on the method of Chua et al. (2012) flour extract containing glucomannan weighed as much as 0.2 g in 50 mL of buffer solution (formic acid sodium hydroxide) and stirred for 4 hours then dissolved with a buffer solution up to 100 mL. The process of making hydrolyzate was put 5 mL of extract into a 25 mL measuring flask, then added 2.5 mL of sulfuric acid 3M and homogenized. The mixture was heated in a water bath for 1.5 hours and then cooled. Then 2.5 mL of NaOH 6M was added to the mixture and then homogenized and aquadest was added to a volume of 25 mL. The absorbance of the sample was measured by putting 2 mL of glucomannan extract and 2 mL of glucomannan hydrolysate in a 25 mL flask, then added 1.5 mL of 3,5 - Dinitrosalicylic acid (DNS) and heated in a waterbath for 5 minutes. After that, aquadest was added up to 25 mL and analyzed with a UV-Vis spectrophotometer at a wavelength of 550 nm. The resultant absorbance value was then used to calculate glucomannan levels using the formula:
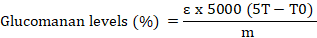
Information
ɛ: Correction factor (0.9); T: The amount (mg) of glucose in glucomannan hydrolyzate obtained from the series; Standard T0: The amount (mg) of glucose in glucomannan extract obtained from the series Standard; M: Sample mass (200 mg).
Sugar fermentation test
The sugar fermentation test was carried out with the aim of knowing whether glucomannan from BCE is capable of being fermented by lactic acid bacteria or not. This fermentation test was done by modifying the growth medium of lactic acid bacteria (LAB) according to the method of Cappuccino and Sherman (2008) and Murray et al. (2007). Observation of LAB growth on agar media was done by making MRS base growth media (without sugar source) as control treatment (-), MRS media (with sugar source that is glucose) as control treatment (+), and MRS media treatment (with sugar source BCE). LAB growth observation on agar media was done by making MRS basic growth media (without sugar source) consisting of peptone 2.0 g/L, Sodium chloride 5.gm/L, Dipotassium phosphate 0.30 g/L, Bromothymol blue 0.030 g/L, Agar 3.0 gm/L. The basic Media was then autoclaved, while the tested BCE sugar is filtered sterile and then added to the agar media. The test bacteria were then grown on each treatment medium. Bacteria that can ferment sugars produce short-chain fatty acids, characterized by a change in the color of the indicator in the medium. The resulting acid changes the blue bromtimol indicator from green to yellow and preferably if the bacteria cannot ferment, then the acid is not formed and the color of the medium remains green, blue or brownish. BCE fermentation tests are also performed on pathogenic bacteria (E. coli and Salmonella) to determine whether the sugar can be fermented by pathogenic bacteria or not.
BCE testing for lactic acid bacteria growth
Testing BCE containing glucomannan was performed using the method of Daud et al. (2009) modified. Testing of banana weevil extract was carried out using lactic acid bacteria. The type of LAB used is L. plantarum and L. rhamnosus. The media used as bacterial growth medium is MRS liquid media with glucose sugar source as carbon source and MRS media treatment with sugar source from BCE as carbon source. The culture of each LAB is grown on all 2 types of treatment media. To avoid contamination, each of them was made Duplo in each observation, namely at 0 hours, 12 hours, 24 hours, 36 hours, and 48 hours. Incubation was carried out aerobically for the bacteria L. rhamnosus and L. plantarum in an incubator at 37oC. To create anaerobic conditions used anoxomat apparatus. The calculation of the amount of LAB was carried out after incubation for 24 hours. The control treatment was carried out through the same stages as the work on the treatment of media using BCE sugar.
BCE testing for the growth of pathogenic bacteria
BCE testing was also performed on pathogenic bacteria using the method of Daud et al. (2009) modified. The types of pathogenic bacteria used are Escherichia coli and Salmonella typhimurium. Media used as a growth medium for e coli bacteria was a liquid medium NA base and bacteria Salmonella typhimurium used liquid medium TSB base but the source of sugar was replaced with sugar from BCE containing glucomannan. As a comparison (control) used TSB media with a source of glucose sugar. Cultures of each pathogenic bacterium were grown on BCE and control sugar-containing media. To avoid contamination, each made duplo at each observation at 0 hours, 12 hours, 24 hours, 36 hours, and 48 hours. Incubation was carried out aerobically in a 37oC incubator. Calculation of the amount of growth of pathogenic bacteria was carried out after incubation for 24 hours. Control was carried out through the same stages as the work on the treatment medium.
Total bacterial calculation
LAB and pathogen total count used Total Plate Count (TPC) method based on the method (Nufuz et al., 2016). TPC was done to determine the number of bacteria contained in a product by counting bacterial colonies and grown on agar media. TPC analysis used plate count agar media by planting 0.1 ml sample from dilution into a petri dish, then incubated for 48 hours at a temperature of 350C. Colony count results in the form of (cfu) per ml/g. Colony calculations were performed at dilution series of 10-6cfu/ml, 10-7cfu/ml, and 10-8cfu/ml. The bacterial colony was placed on a petri dish in the counting chamber, the counting device was set to the zero position and the bacterial colony begins to be counted with the use of a pointing needle while looking at the number on the counting screen. Calculation of the number of colonies from 30-300 colonies used the formula (Sutton, 2011).
RESULTS AND DISCUSSION
Extraction and fractionation results
Based on the results of extraction and fractionation, banana corm extract has a glucomannan content of 33.59% (Table 1). Glucomannan was qualitatively identified in fraction 4, namely the EtOH fraction (1L), while in fractions 1, 2, and 3, respectively, namely H2O (1 L), 20% H2O / EtOH (1 L), and 50% H2O/ EtOH (1L) did not show the presence of glucomannan compounds or other prebiotics. The presence of glucomannan in the 4th fraction occurs because the fraction uses 100% ethanol solvent without the addition of H2O. Ethanol is reported to have a high level of polarity that is able to reduce the impurity compounds present in banana corm flour so that the content of the desired ingredient in this case is glucomannan. This is in accordance with Puspaningrum and Sumadewi (2017) that the use of organic solvents such as ethanol is able to reduce the solubility of the extracted material, so as to increase the precipitate in the solution used. In addition, the research of Wardani et al. (2021) also reported on the use of ethanol to extract glucomannan from porang tubers because ethanol can remove other compounds trapped in glucomannan particles such as ash, oxalate, starch, and protein.
Table 1: Results of extraction and purification of glucomannan from banana corm extract.
|
No. |
Parameters |
Yield (%) |
|
1. |
Glucomannan |
33,59 |
|
2. |
Rendements |
14,15 |
|
3. |
Total sugar |
8,4 |
|
4. |
Reducing sugars |
3,3 |
|
5. |
DP (Degree of polymerization) |
2,54 |
In this study, glucomannan purification was carried out using separation technology with column chromatography. The separation of the components of banana corm extract by column chromatography aims to find out the components of the compound that can be separated. Chromatography is still relatively new to the sugar industry but has developed longer for hydrocarbon separation (Musita, 2012). The elusion process carried out in this study is to use diaion as the stationary phase and ethanol as the mobile phase. Diaion is a material that is very non-polar, while sugar compounds (glucose, fructose, disaccharides, oligosaccharides, polysaccharides) are polar. In this process, only non-polar compounds will be bound by diaions so that what will be expelled first is the polar fraction while the non-polar fraction will be retained (Musita, 2012). Based on this, the use of ethanol as a mobile phase in this study was able to precipitate glucomannan in the extract fraction. Unlike those who use the water fraction (H2O) both in fractions 1, 2, and 3, there is no visible presence of glucomannan after analysis. This is likely to happen because extraction with water alone has not been able to release the bonds of proteins, fats, and starches that are strongly bound together with polysaccharides during the extraction process and there is no hydrolysis process.
Based on the results of extraction and fractionation obtained yield of glucomannan in banana corm extract is 14.15% (Table 1). The results are still small might be due to the influence of the contact time between the solvent and the sample. Extraction by maceration method requires a long contact time, while in this study the contact time was less than 24 hours. In the opinion of Wardani and Handrianto (2020) that a long extraction time will further increase the purification of glucomannan levels because the buffer will hydrolyze starch as impurities so that it will produce lower starch and will dissolve the purified mannan and increase the reducing sugar. However, banana corm extract has a degree of polymerization (DP) of 2.54 (Table 1) which means it qualifies to be a source of prebiotics. This is following the opinion of Afni et al., (2017) that oligosaccharides with DP 2-5 can be used as prebiotics. Furthermore, Nuraida et al. (2011) stated that a low DP value would be easier for lactic acid bacteria to ferment in support of their growth. DP is the number of monomer units bound to the carbohydrate structure, the value of which is influenced by the total sugar content and the reducing sugar content. The greater the total sugar content and the smaller the reducing sugar content obtained, the DP value will be greater and vice versa (Yuliana et al., 2014). This study obtained a total sugar content of 8.4 and 3.3 reducing sugars (Table 1).
Determination of glucomannan content from BCE (Banana Corm Extract)
After detecting the presence of glucomannan in BCE, then the quantitative determination of glucomannan levels is carried out to determine its levels. The determination used UV-Vis Spectrophotometers with a reducing sugar test with 3, 5-dinitrosalicylic (DNS) reagents. The DNS method was chosen because it is the most frequently used method and is more precise than other methods (Chua, 2011). DNS functions as a reagent that can form colored compounds in the presence of reducing sugars such as glucose and mannose so that they can absorb electromagnetic radiation. The reaction that occurs is a redox reaction between glucose and DNS which forms an acid-3-amino-5-nitro salicylic compound (Wardani et al., 2021).
The glucomannan content in this study was determined by measuring the glucomannan content in glucomannan extracts and hydrolyzates. Measurement of glucomannan levels in glucomannan extract aims to prevent the estimation of excess glucomannan content due to the presence of free reducing sugars from other sources such as starch that may be present in the test sample. The analysis activity begins with making a calibration curve of the comparison compound, namely glucose because glucose is a monomer of glucomannan which can provide more accurate measurement results than mannose. This was done based on the results of research by Chua et al. (2012) which reported that glucose standards have a higher sensitivity than manosa. Absorption measurements were carried out at a wavelength of 540 nm because the reddish-orange acid-3-amino-5-nitrosalcylate compound can strongly absorb electromagnetic radiation at a wavelength of 540 nm. Based on the measurement results obtained calibration curve is shown in Figure 1.
The linear regression equation obtained is y = 0.9435-0.2542 with the value of R2 = 0.9967 (Figure 1) which is then used to calculate the levels of glucomannan in banana corm extract. BCE containing purified glucomannan is dissolved in a buffer solution (formic acid-sodium hydroxide) to dissolve glucomannan because its solubility is lower than starch. In addition, stirring is carried out to increase the solubility of glucomannan and to remove insoluble substances such as starch and cellulose (Wardani et al., 2021). Glucomannan extract and hydrolysate were added with 3, 5- Dinitro Salisilic Acid (DNS) reagent and heated to accelerate the reaction between glucose in the extract and hydrolysate with DNS reagent to form colored compounds that can absorb electromagnetic radiation.
The absorbance values of glucomannan extract and hydrolyzate and their levels can be seen in (Table 2). Based on the calculation of the linear regression equation standard glucose curve then obtained the average levels in the extract of 0.3996 mg and the hydrolysate of 0.9413 mg. Glucomannan levels in the extract and glucomannan hydrolysate are then used to calculate the total glucomannan levels based on the formula that has been listed in the research method. Based on the calculation results obtained total glucomannan levels amount to 33.59% (Table 2) The results of glucomannan obtained are still relatively small which may be caused by several factors including the influence of extraction time, temperature, stirring time, type of solvent, or plant origin used. Anindita et al. (2016) stated that high and low levels of glucomannan in plants are influenced by starch levels, fiber levels, or other compounds. Further stated by Faridah et al. (2012) that the increase in glucomannan levels goes hand in hand with the decrease in other non-glucomannan components such as oxalate, protein, fat, ash, and starch.
BCE fermentation as a carbon source
The results obtained in the fermentation test using BCE instead of glucose showed a positive result. BCE containing glucomannan can be fermented by test bacteria i.e.
Table 2: Absorbance values and glucomannan levels in BCE.
|
Sample |
Absorbance |
Sample weight |
Amount of glucose based on the standard series (mg) |
The average amount of glucose based on the standard series (mg) |
Glucomannan levels (%) |
|
Glucomannan hydrolysate |
0.6247 |
200.2000 |
0.9315 |
0.9413 |
33.59 |
|
Glucomannan hydrolysate |
0.6431 |
200.2000 |
0.9510 |
||
|
Glucomannan hydrolysate |
0.1232 |
200.2000 |
0.4000 |
0.3996 |
|
|
Glucomannan hydrolysate |
0.1225 |
200.2000 |
0.3992 |
L. rhamnosus and L. plantarum. The same happened in the control treatment with the administration of glucose. This is indicated by the growth of colonies in the fermentation medium with a change in the color of the indicator in the medium to yellow (Figure 2). This is following Gunkova (2021) that if a bacterial culture can utilize sugar during growth, the acid will be produced and the medium will change color. The resulting acid changes the blue bromothymol indicator from green to yellow and instead if bacteria cannot ferment, then the acid is not formed and the color of the medium remains green, blue, or brownish (Hanson, 2008). The resulting yellow color is a sign of the formation of acid during the fermentation process by bacteria. The resulting acids are short-chain fatty acids in the form of acetic, propionic, butyric, and lactic. Furthermore, Islam et al. (2020) suggests that the growth of lactic acid bacteria in media with carbohydrates or sugar goes along with the accumulation of organic acids and as a result of the formation of organic acids the pH of the medium decreases which results in a change in color which is initially Green will turn yellow.
Different result was obtained using Salmonella and E. coli grown on fermentation media with BCE. The result show that the pathogenic bacteria both Salmonella and E. coli cannot ferment sugar BCE as a carbon source for its growth. It is characterized by no yellow discoloration of the media (Figure 2). For comparison, pathogens are also grown on a medium using glucose. In this case, there is a yellow color change (Figure 2) which means, the pathogen is only able to grow in a glucose medium but not able to grow in a Medium with sugar BCE containing glucomannan. The results of this study indicate that BCE containing glucomannan can only be fermented by lactic acid bacteria but not by pathogenic bacteria. Based on these results, BCE sugar containing glucomannan qualifies as a prebiotic. The results of this study are supported by Connolly et al. (2010) who stated that glucomannan can stimulate the growth of LAB both bifidobacteria and lactobacillus, and suppress Escherichia coli and Clostridium perfringens using glucomannan utilized by the LAB as a carbon source for its growth and produce short-chain fatty acids (SCFA). Furthermore, an increase in acetic acid, propionic acid, and butyric acid was reported when Konjac glucomannan was added both in vitro and in vivo (Connolly et al., 2010).
Number of bacterial colonies
The number of lactic acid bacteria and pathogenic bacteria grown on different media can be seen in Table 3. The use of MRS + sugar BCE and MRS + glucose media as carbon sources are both able to provide growth for L. plantarum and L. rhamnosus during the incubation period as shown in (Figure 3). Its growth continues to increase from the incubation period of 0 hours to 48 hours. This might be due to L. plantarum and L. rhamnosus can use glucomannan-containing BCE as a carbon source for their cell growth. In contrary, E. coli and Salmonella bacteria did not grow on BCE- carbon media, but grow on glucose-media (Table 3). This happens because pathogenic bacteria cannot utilize complex sugars, both oligosaccharides, and polysaccharides, as a carbon source for their cell growth (Figure 4).
Table 3: Total bacterial population (Log CFU/ml).
|
Test bacteria |
Incubation period (hours) |
Treatment |
|
|
MRS + Glucose |
MRS + BCE sugar |
||
|
L. plantarum |
0 |
1.954 |
2.398 |
|
12 |
5.796 |
4.677 |
|
|
24 |
6.712 |
7.004 |
|
|
36 |
8.039 |
7.043 |
|
|
|
48 |
10.107 |
8.107 |
|
L. rhamnosus |
0 |
1.398 |
1.954 |
|
12 |
4.580 |
5.796 |
|
|
24 |
6.180 |
7.006 |
|
|
36 |
8.230 |
7.591 |
|
|
|
48 |
9.851 |
7.771 |
|
E. coli |
0 |
3.439 |
ND |
|
12 |
6.362 |
ND |
|
|
24 |
8.025 |
ND |
|
|
36 |
9.470 |
ND |
|
|
|
48 |
9.290 |
ND |
|
Salmonella thyp |
0 |
4.732 |
ND |
|
12 |
6.484 |
ND |
|
|
24 |
7.550 |
ND |
|
|
36 |
8.618 |
ND |
|
|
|
48 |
8,512 |
ND |
ND, Not detected.
Growth of lactic acid bacteria
The addition of BCE containing glucomannan had a positive influence on the increase in the number of L. plantarum cells. The same thing happens in the control media that are given MRS + glucose and also continue to experience an increase in the number of cells during the incubation period. The interesting thing in this study is that higher L. plantarum growth results were obtained in MRS + BCE sugar media (10.107 log cfu /ml) compared to those grown on MRS + Glucose media (8.107 log cfu /ml) (Table 3). This is thought to be because the addition of BCE containing glucomannan provides a better supply of nutrients as a source of carbon in the metabolic processes of cells. The incubation time of 18 and 24 hours is a stationary phase for the growth of L. plantarum, but with the availability of sufficient carbon sources, there is still an increase in metabolic processes that also increase the number of cells. Conversely, if the supply of nutrients is less, the metabolic activity will also decrease then the number of cells will be reduced and in the end will experience a lack of nutrients, the accumulation of toxic compounds produced, causing death for bacterial cells (Purwoko, 2007). Supported by Kailasapathy and Chin (2000) that the presence of carbohydrates proved to be able to increase the survivability of Lactobacillus and Bifidobacterium in-vitro.
Similarly, the growth of L. rhamnosus bacteria both on MRS + glucose media and on MRS + BCE sugar media also showed positive results. Growth continued from 0 hours to 48 hours and still experienced an increase in population (Table 3). Based on these results, it can be assumed that BCE media containing glucomannan can be a growing medium for L. rhamnosus even though higher results are obtained on growth with MRS + glucose media. The same result was reported by Daud et al. (2009) that L. rhamnosus bacteria were able to grow on the oligosaccharide media of the rumbia fruit and showed the best growth among other lactic acid bacteria. Furthermore, Li et al. (2015) and Khayrah et al. (2022) stated that the shorter the oligosaccharide chain, the easier it is for microbes to use it as a carbon source. The ability of the LAB to use oligosaccharides in addition to being affected by bacterial strains is also affected by the degree of polymerization (DP). A low degree of polymerization will be more easily metabolized by isolates of lactic acid bacteria (Maryati et al., 2016). In this study BCE sugar containing glucomannan has a relatively low DP of 2.54 (Table 1), so LAB growth as good as those grown on media with glucose sugar.
Growth of pathogenic bacteria
In Figure 4, it can be seen that pathogenic bacteria, both Salmonella and E. coli, are not able to grow on media with BCE sugar, but can grow on media with glucose. This happens because BCE media containing glucomannan cannot be used by pathogens as a source of carbon for their growth. This is in accordance with Fatiqin et al. (2019) that Salmonella is a gram-negative bacterium that is only able to ferment glucose but is not able to use lactose, sucrose and oligosaccharides as a source of carbon for its growth. A similar thing is stated by Supratin and Rahayyu (2016) that Salmonella sp. grows fast in a simple medium and rarely ferments lactose and sucrose. Similarly, E. coli was also unable to use BCE sugar as a source of nutrients in this study.
Bacteria can grow well in a medium if the media contains all the nutrients that are easy to use by bacteria, but in this study, pathogens were unable to use BCE sugar as a source of nutrients. This happens because BCE has a complex compound that contains glucomannan so it takes longer to break down into simple components to be easily absorbed. Glucomannan complex compounds are thought to cause pathogens to be unable to survive in the medium. The results of a similar study were reported by Zamilah et al. (2020) that E. coli and S. aureus bacteria are less able to grow in peanut media than in NA media because peanut media has more complex nutritional compounds so their growth is not optimal as in NA media. A similar point was stated by Alkhfaji (2018) that the complex content in the medium can cause the growth of bacteria not optimally because it takes longer to decompose simple components that can be absorbed by cells and used for cell synthesis.
CONCLUSIONS and Recommendations
Banana corm extract contains glucomannan by 33.59%, DP by 2.54 and rendement by 14.15%. BCE is only fermented by LAB but not by pathogens. In addition, BCE can be used as a source of carbon for LAB growth which is characterized by the growth of L. plantarum and L. rhamnosus which continue to experience an increase in the number of cells up to a 48-hour incubation period of 8.107 log cfu/ml and 7.771 log cfu/ml, respectively, while in pathogenic bacteria there is no growth during the incubation period so it can be concluded that BCE has the potential to be a prebiotic.
ACKNOWLEDGEMENT
We would like to acknowledge the Deputy of Strengthening Research and Development, Kemenristek BRIN for their financial support on this research activity through the Doctoral Dissertation Research scheme fiscal year 2021 with SK Number 1/E1/KP.PTNBH/2021.
Novelty Statement
The novelty of this study is banana corm has potential as a prebiotics which has never been reported before. The latest from this research is to find a method of extraction, identification and isolation of prebiotic compound in banana corm. Prebiotic compound obtained in this research was in the form of glucomannan. Banana corm containing glucomannan has been shown to increase the population of lactic acid bacteria so that it can become natural growth promoters, especially for broilers. Given the abundant availability of banana corm in nature and can be a new source of glucomannan, this research can continue to be developed.
AUTHOR’s CONTRIBUTION
NF: Analysis in the laboratory, analysis and interpretation of data, formulation of proposed strategies, manuscript writing, as well as finalization of edits and revisions necessary.
KGW: Provided support in the conceptualization of the research design, performed data analysis and strategy development, critical evaluation of research data and content, and proof reading the manuscript sourcing as well as checking for manuscript revisions necessary.
Sumiati: Provided material discussion on theory development and critical evaluation of research data and content.
SKS: Provided substantial contribution in organization of data.
Conflict of interest
The authors have declared no conflict of interest.
REFFERENCES
Afni FS, Purwaningsih S, Nurilmala M, Peranginangin (2017). Produksi alginate oligosaccarides (AOS) sebagai bahan prebiotik menggunakan enzim alginat liase. J. Pengol. Hasil Perikanan Indonesia, 20(1): 109-122. https://doi.org/10.17844/jphpi.v20i1.16498
Alkhfaji ZAA (2018). Bee collected pollen load (BCPL) as alternative culture media for bacterial and yeast growth. J. Pharm. Sci. Res., 10(4): 830–835.
Anggela SW, Wichienchot S, Harmayani E (2020). Oligo-glucomannan production from porang (Amorphophallus oncophyllus) by enzymatic hydrolysis using β-mannanase. Indonesian Food Nutr. Prog., 17(1). https://doi.org/10.22146/ifnp.57217
Anindita F, Bahri S, Hardi J (2016). Ekstraksi dan karakterisasi glukomanan dari tepung biji Salak (Salacca edulis Reinw.). Kovalen, 2(2): 1-10. https://doi.org/10.22487/j24775398.2016.v2.i2.6720
Aryanti N, Abidin KY (2015). Ekstraksi glukomanan dari porang lokal (Amorphophallus oncophyllus dan Amorphophallus muelleri Blume). Metana, 11(1): 21-30.
BPS (Badan Pusat Statistik) (2020). Statistik Tanaman Buah-Buahan dan Sayur-Sayuran Indonesia. Badan Pusat Statistik, Jakarta.
Cappuccino JG, Sherman N (2008). Microbiology: A laboratory manual, 8th ed. Pearson Benjamin Cummings, San Francisco, CA, USA
Chua M (2011). An investigation of the biologyand chemistry of the Chinese medical plant Amorphophallus konjac. Thesis. University of Wolverhampton.
Chua M, Chan K, Hocking TJ, Williams PA, Perry CJ, Baldwin TC (2012). Methodologies for the extraction and analysis of konjac glucomannan from corms of amorphophallus Konjac K. Koch. Carbohydrate Polymers, 87(3) 2202-2210. https://doi.org/10.1016/j.carbpol.2011.10.053
Connolly ML, Lovegrove JA, Tuohy KM (2010). Konjac glucomannan hydrolysate beneficially modulates bacterial composition and activity within the faecal microbiota. J. Funct. Foods, 2(3): 219-224. https://doi.org/10.1016/j.jff.2010.05.001
Daud M, Piliang WG, Wiryawan KG, Setiyono A (2009). Pengujian secara in vitro Oligosakarida dari Ekstrak Tepung Buah Rumbia (Metroxylon sago Rottb.) sebagai Sumber Prebiotik. Agripet, 9(2): 35-41. https://doi.org/10.17969/agripet.v9i2.627
Faridah A, Widjanarko SB., Sutrisno A, Susilo B (2012). Optimasi produksi tepung porang dari chip porang secara mekanis dengan metode permukaan respons. J. Teknik Industri, 13(2): 158–166. https://doi.org/10.22219/JTIUMM.Vol13.No2.158-166
Fatiqin A, Novita R, Apriani I (2019). Pengujian salmonella dengan menggunakan media ssa dan E. coli Menggunakan Media Emba Pada Bahan Pangan. Indobiosains, 1(1): 22–29. https://doi.org/10.31851/indobiosains.v1i1.2206
Gunkova (2021). Carbohydrate fermentation test of lactic acid starter cultures. IOP Conf. Series: Earth and Environmental Science. https://doi.org/10.1088/1755-1315/852/1/012035
Hanson A (2008). Oxidative-fermentative test protocol. Am. Soc. Microbiol.,
Harmayani E, Aprilia V, Marsono Y (2014). Characterization of glucomannan from Amorphophallus oncophyllus and its prebiotic activity in vivo. Carbohydrate Polymers, 112: 475–479. https://doi.org/10.1016/j.carbpol.2014.06.019
Haryati T (2011). Probiotik dan prebiotik sebagai pakan imbuhan non ruminansia. Wartazoa, 21(3): 125-132.
Islam R, Hossain MN, Alam MK, Uddin ME, Rony MH, Imran MAS, Alam MF (2020). Antibacterial activity of lactic acid bacteria and extraction of bacteriocin protein. Adv. Biosci. Biotechnol., 11(2): 49–59. https://doi.org/10.4236/abb.2020.112004
Kailasapathy K, Chin J (2000). Survival and therapeutic potential of probiotic organisms with reference to Lactobacillus acidophilus and Bifidobacterium spp. Immunol. Cell Biol., 78: 80–88. https://doi.org/10.1046/j.1440-1711.2000.00886.x
Khayrah U, Prangdimurti E, Nuraida L (2022). Karakteristik dan Evaluasi Prebiotik Tepung Biji Cempedak (Artocarpus champeden). J. Ilmu Pertanian Indonesia, 27(2): 248−254. https://doi.org/10.18343/jipi.27.2.248
Lam KL, Cheung PCK (2013). Non-digestible long chain beta-glucans as novel prebiotics. Bioact. Carbohyd. Diet. Fibre, 2(1): 45-64. https://doi.org/10.1016/j.bcdf.2013.09.001
Larasati YNE, Harmayani, Widada J (2017). Komposisi Bakteri Sekum Dan Performan Ayam Broiler Yang Diberi Ransum Dengan Suplementasi Glukomanan Porang (Amorphophallus onchophyllus). Thesis. Bioteknologi. Universitas Gadjah Mada. Yogyakarta
Li W, Zhang J, Yu C, Li Q, Dong F, Wang G, Guo Z (2015). Extraction, degree of polymerization determination and prebiotik effect evaluation of inulin from Jerusalem artichoke. Carbohyd. Polymers, 121: 315−319. https://doi.org/10.1016/j.carbpol.2014.12.055
Maryati Y, Nuraida L, Dewanti, Hariadi R (2016). Kajian bakteri asam laktat dalam menurunkan kolesterol secara in vitro dengan keberadaan oligosakarida. Agritech, 36: 196-205. https://doi.org/10.22146/agritech.12865
Murray PR, Baron EJ, Jorgensen JH, Landry ML, Pfaller MA (2007). Manual of clinical microbiology. 9th ed. ASM Press, Washington, D.C.
Musita N (2012). Kajian karakteristik gula cair fruktooligosakarida dari pisang batu. Prosiding SNSMAIP III. pp. 464-469.
Nufus BNG, Tresnani, Faturrahman (2016). Populasi bakteri normal dan bakteri kitinolitik pada saluran pencernaan lobster pasir (Panulirus homarus L.) yang diberi Kitosan. J. Biol. Trop., 16(1): 15-23. https://doi.org/10.29303/jbt.v16i1.215
Nuraida L, Mardiana NR, Faridah DN, Hana (2011). Metabolisme Prebiotik Oleh Kandidat Probiotik Isolat ASI Sebagai Dasar Pengembangan Produk Sinbiotik. J. Teknol. Dan Industri Pangan, 22 (2) : 156-163.
Purwoko T (2007). Fisiologi Mikroba, Bumi Aksara, Jakarta.
Puspaningrum DHD, Sumadewi NLU (2017). Ekstraksi dan Identifikasi Oligosakarida Ekstrak Tepung Rebung Bambu Tabah. (Gigantochloa nigrociliata Buse-Kurz) Sebagai Sumber Prebiotik. Sci. J. Food Technol., 4(2): 148–156.
Rahmawati (2019). Pemanfaatan bonggol pisang menjadi stick nugget untuk peningkatan gizi masyarakat desa soket laok tragah kabupaten bangkalan. J. Ilmiah Pengabdi, 5(1): 44-45. https://doi.org/10.21107/pangabdhi.v5i1.5165
Ricke SC, Lee SI, Kim SA, Park SH, Shi Z (2020). Prebiotics and the poultry gastrointestinal tract microbiome. Poult. Sci., 99: 670–677. https://doi.org/10.1016/j.psj.2019.12.018
Rusdi B, Yuliawati KM, Khairinisa MA (2021). Comparison on the prebiotic polysaccharides and oligosaccharides from plant studies in Indonesia and outside of Indonesia. J. Eng. Sci. Technol., 16(3): 2260–2272.
Saputro EA, Olim L, Endang M (2014). Pemurnian tepung glukomanan dari umbi porang (Amorphophallus muelleri Blume) Menggunakan Proses Ekstraksi/Leaching dengan Larutan Etanol. Simposium Nasional RAPI XII-2014 FT UMS
Saragih B (2013). Analisis Mutu Tepung Bonggol Pisang dari Berbagai Varietas dan Umur Panen yang Berbeda. J. TIBBS (Teknologi Industri Boga dan Busana) 9(1): 22-29.
Soetjipto HY, Martono, Yuniarti Z (2018). Isolasi dan Analisa Genistein Dari Tempe Busuk Menggunakan Metode Kromatografi Kolom. J. Bioteknol. Biosains Indonesia, 5(1): 88-97. https://doi.org/10.29122/jbbi.v5i1.2860
Subeki, Matsuura H, Takahashi K, Yamasaki M, Yamato O, Maede Y, Katakura K, Kobayashi S, Trimurningsih, Chairul,Yoshihara T (2005). Anti-babesial and anti-plasmodial compounds from Phyllanthus niruri. J. Nat. Prod. 68: 537–539. https://doi.org/10.1021/np0497245
Supriatin Y, Rahayyu M (2016). Modification of carry-blair transport media for storage Salmonella typhi. J. Teknol. Lab., 5(2): 72-73.
Sutton S (2011). Accuracy of plate counts. J. Valid. Technol., 17(3): 42-46.
Syahpura SK, Rani H, Zulfahmi (2015). Karakteristik Fruktooligosakarida (FOS) Hasil Isolasi Dari Kulit Pisang Sebagai Prebiotik Pada Ternak. J. Kelitbangan, 4(2): 124-132.
Waluyo Lud (2016). Mikrobiologi Umum (Ed 5). Malang: UMM Pres.
Wardani NE, Subaidah WA, Muliasari H (2021). Ekstraksi dan Penetapan Kadar Glukomanan dari Umbi Porang (Amorphophallus muelleri Blume) Menggunakan Metode DNS. J. Sains Kes, 3(3): 383-391. https://doi.org/10.25026/jsk.v3i3.574
Wardani RK, Handrianto P (2020). The effect of soaking porang tubers in acid solution on decreasing calcium oxalate levels. Ann. Biol., 36(2): 173-176.
Widjanarko S, Megawati J (2015). Analisis metode kalorimetri dan gravimetri pengukuran kadar glukomanan pada konjak (Amorphopallus Konjac). J. Pangan Agroind., 3(4): 1584-1588.
Yuliana R, Kusdiyantini E, Izzati M (2014). Potensi tepung umbi dahlia dan ekstrak inulin dahlia sebagai sumber karbon dalam produksi fruktooligosakarida (FOS) oleh Khamir Kluyveromyces marxianus DUCC-Y-003. Bioma, 16(1): 39-49. https://doi.org/10.14710/bioma.16.1.39-49
Zamilah M, Ruhimat U, Setiawan D (2020). Media alternatif kacang tanah untuk pertumbuhan bakteri. JoIMedLabS, 1(1): 57-65. https://doi.org/10.53699/joimedlabs.v1i1.11
To share on other social networks, click on any share button. What are these?

