

Preliminary Behavioral, Pathological and Transcriptome Studies of Tree Shrew: Evidence for a Complementary Small-Animal Alzheimer's Disease Model


Preliminary Behavioral, Pathological and Transcriptome Studies of Tree Shrew: Evidence for a Complementary Small-Animal Alzheimer's Disease Model
Yi-qiang Ouyang1, Zhen-xin Liang1, Shi-wen Huang2, Ying Zhang3, Shao-shi Luo1, Jin-ning Liang1, Jia-fu Li1, Yu He4 and Song-chao Guo1,*

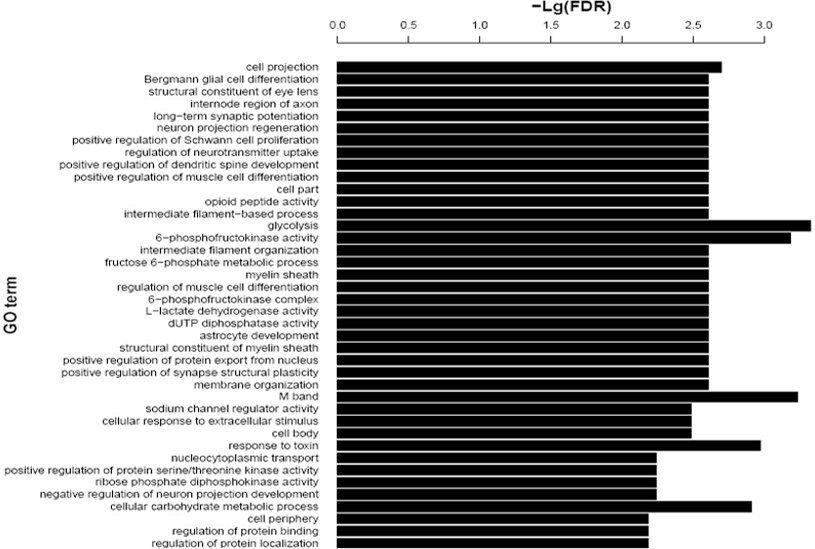
Distribution of differentially expressed hippocampal genes in tree shrew across different GO functional classes following AD induction. FDR (false discovery rate).
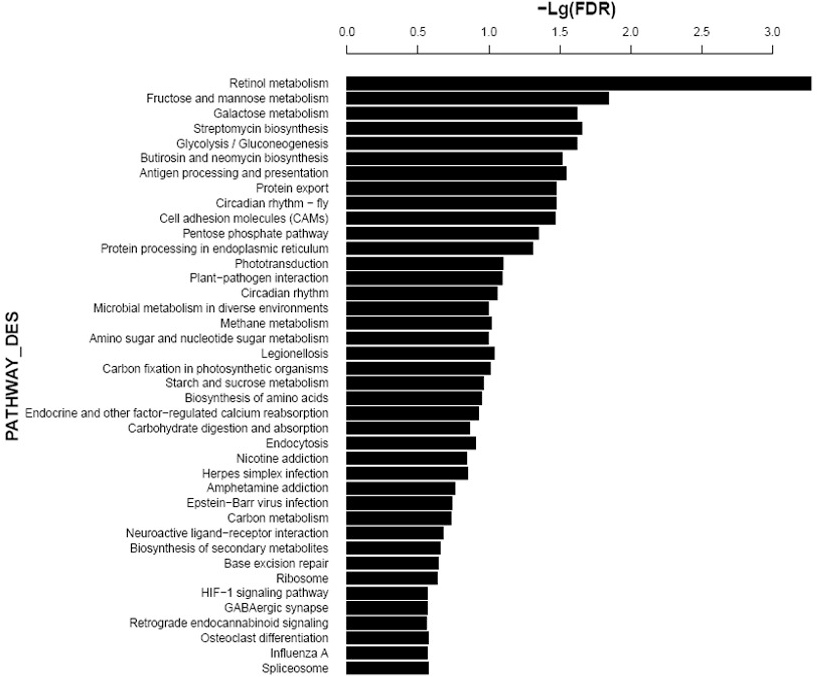
Distribution of differentially expressed hippocampal genes in tree shrew across different KEGG pathways following AD induction.


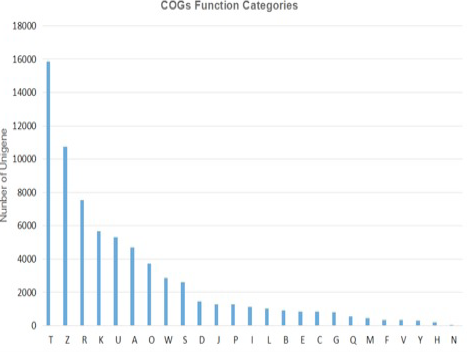
COG functional classification of the final UniGene sequence set generated from the tree shrew hippocampal transcriptome.UniGene classifies the COG functions, compares UniGenes and CDD library by rpstblastn, takes the five best results of E-value < 1e-5 to forecast the classification of COG functions, and map it to different classification of COG. 19305 counts of Unigene were annotated into 25 kinds of COG sorts. The COGs _categories figure indicated the COG sorts distribution of UniGene. T, signal transduction mechanisms: Cytoskeleton: General function prediction only: Transcription; U, Intracellular trafficking, secretion, and vesicular transport; A, RNA processing and modification; O, Posttranslational modification, protein turnover, chaperones; W, Extracellular structures: Function unknown: Cell cycle control, cell division, chromosome partitioning: Translation, ribosomal structure and biogenesis: Inorganic ion transport and metabolism; I, Lipid transport and metabolism: Replication, recombination and repair: Chromatin structure and dynamics; E, Amino acid transport and metabolism; C, Energy production and conversion; G: Carbohydrate transport and metabolism; Q, Secondary metabolites biosynthesis, transport and catabolism; M, Cell wall/membrane/envelope biogenesis; F, Nucleotide transport and metabolism; V, Defense mechanisms; Y, Nuclear structure; H, Coenzyme transport and metabolism; N: Cell motility.
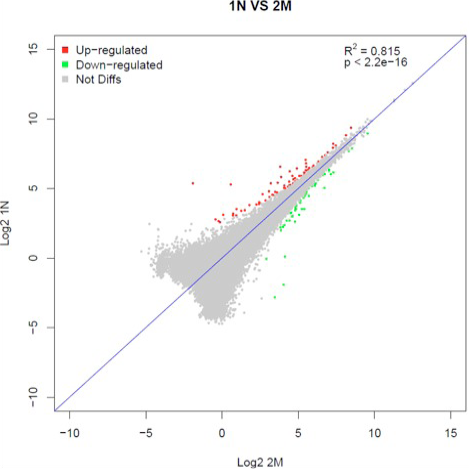
Differential expression of hippocampal genes in tree shrews treated with saline or treated with d-Gal, Aβ1-42 and Ibo to induce AD. The correlation degree of the two samples can be checked. If the correlation is low, it suggests problems in modeling or experiment. The red points are up-regulated differential genes; green points are down regulated differential genes.
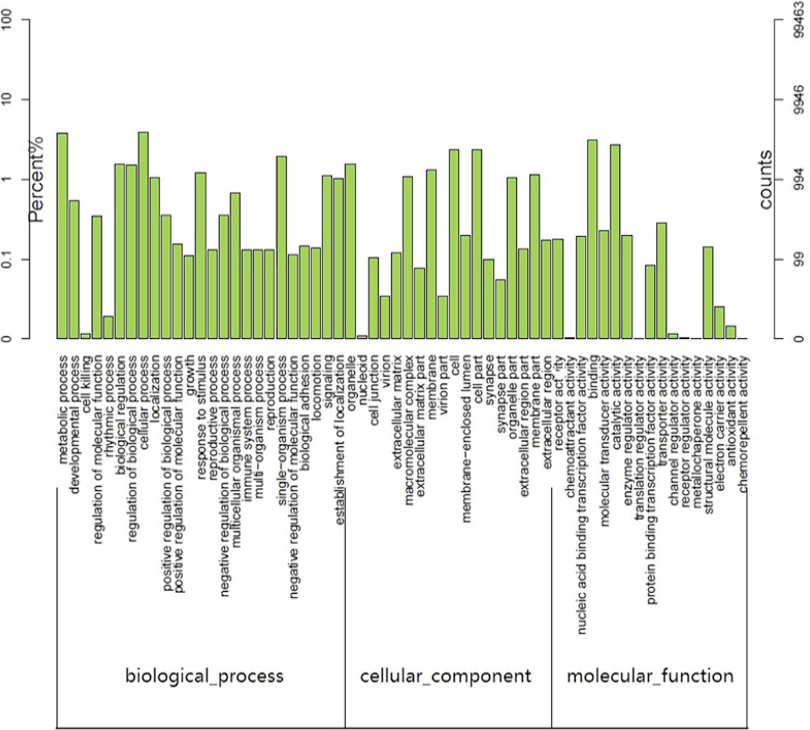
GO functional classification of the final UniGene sequence set generated from the tree shrew hippocampal transcriptome. These sequences were assigned to the three functional classes of molecular_function (12,676), biological_process (32,082) and cellular_component (18,950).


