Genetic Variability, Heritability, Genetic Advance and Association of Agronomic Traits of Early Flushing Tea (Camellia sinensis L) Clones at the Nursery Stage


Research Article
Genetic Variability, Heritability, Genetic Advance and Association of Agronomic Traits of Early Flushing Tea (Camellia sinensis L) Clones at the Nursery Stage
Fayaz Ahmad, Noorullah Khan*, Farrukh Siyar Hamid, Abdul Waheed, M. Abbas Khan, Imtiaz Ahmad, Shamsul Islam, Basharat Hussain Shah, Sohail Aslam and Qamar uz Zaman
Pakistan Agricultural Research Council, National Tea and High Value Crops Research Institute, Shinkiari-Mansehra, Pakistan.
Abstract | The present study was conducted at the tea nursery farm of PARC-National Tea and High Value Crops Research Institute, Shinkiari, Mansehra, Pakistan during the years 2014-16 to assess genetic variability, heritability and genetic advance as percent of mean for various growth attributing traits of fifteen early flushing tea (Camellia sinensis L) clones. The experiment was laid out in randomized complete block design (RCBD) with three replication and 100 plants per replication. Data were recorded on plant height (PH), number of branches per plant (NBP), number of leaves per plant (NLP), stem diameter (SD), main root length (MRL), root diameter (RD), number of lateral roots per plant (NLRP), dry shoot weight (DRW) and dry root weight (DRW). The highest plant height (78.66 cm) was produced by clone BP2-2, followed by Clones BP1-4, BP1-3, BP3-1 and BP2-5 with plant height of 70.46, 67.60, 67.20 and 66.36 cm respectively. Clone BP2-2 also produced highest number of leaves per plant (34.66), stem diameter (6.53 mm), root length (35.10 cm), root diameter (6.55 mm), number of lateral roots per plant (6.35), Dry shoot weight (17.56 g) and dry root weight (11.57 g). Number of branches per plant in the early flushing tea clones ranged from 1.33 (BP2-4) to 6.00 (BP6-1 ). The phenotypic coefficient of variation (PCV) was higher than genotypic coefficient of variation (GCV), but the difference between PCV and GCV was minimal for most of the traits revealing little influence of the environment in the expression of these traits. High PCV and GCV were observed for DRW (26.98 and 29.11%), NBP (25.36 and 28.63), PH (23.20 and 24.21), DSW (20.38 and 22.59) and NLRP (20.34 and 23.55 %) suggesting the presence of wide range of genetic variability in the genotypes for these traits. Heritability ranged from moderate (65.28 %) for SD to high (91.86 %) for PH whereas expected genetic advance was high (>20 %) for all the traits studied revealing the presence of additive genes in the trait and suggested reliable tea crop improvement through selection of the traits. Significant and positive correlation was observed among all the traits, indicating that these traits are genetically interlinked and which may facilitate indirect selection of one trait for the other trait that is genetically interlinked.
Received | September 05, 2018; Accepted | November 14, 2019; Published | June 12, 2021
*Correspondence | Noorullah Khan, PARC-National Tea and High Value Crops Research Institute, Shinkiari-Mansehra, Pakistan; Email: nooragro@yahoo.com
Citation | Ahmad, F., N. Khan, F.S. Hamid, A. Waheed, M.A. Khan, I. Ahmad, S. Islam, B.H. Shah, S. Aslam and Q. Zaman. 2021. Pakistan Journal of Agricultural Research, 34(3): 405-416.
DOI | https://dx.doi.org/10.17582/journal.pjar/2021/34.3.405.416
Keywords | Correlation, Crop improvement Early flushing tea clones, Genetic and phenotypic coefficient of variation, Growth attributing traits
Introduction
Tea (Camellia sinensis L.) is one of the important healthy beverages used globally and being cultivated in more than thirty countries in different tropical and subtropical zones of the World (Adnan et al., 2013) having above eighty two genetically distinct species (Sultana et al., 2008). Tea cultivation contributes manifolds in improving the economy and job opportunities status in various Asian and African countries due to its large scale cultivation, production, marketing and consumption (Ahmad et al., 2018).
The main objectives of tea breeding are to develop high yielding cultivars with acceptable quality. Clonal varieties are developed through selection of desired plants from the existing population source (Banerjee, 1992). Selection based on morphological, physiological and quality characteristics of tea clones has a good contribution in tea improvement (Squire, 1985). Variability among the tea seedling population regarding plant architecture, leaf size and geometry flushing behavior, resistance to diseases and drought, yield and quality of made tea are utilized in selection process for the development of desired tea clones for specific climatic conditions (Yao et al., 2007)
Shoot population, the fraction of these shoots that are actively growing, the rates of growth of these shoots and the mean weight of the harvested shoots are the four factors which determine the potential production and yield distribution in tea plantation throughout the year (Matthews and Stephens, 1998b). In cool climate where the tea remains dormant during winter, the early shoot sprouting/flushing behavior is a useful selection criterion as the early tea flushers are considered the quick growers (Toyao, 1965). Potential tea growing areas of Pakistan are situated in the Northern parts of Khyber Pakhtunkhwa and some parts of Kashmir having temperate climate where the tea remains dormant from November till Mid of March. Selection on the basis of early flushing behavior is a useful criteria for the development of high yielding tea clones for these areas.
Study of field performance along with the nursery production potentials of early flushing selected clones is necessary for the development of tea varieties for their mass propagation and also to depict their establishment and growth potentials in the field. In tea plant, the desired hereditary characteristics from the selected parental plant can easily be transmitted to the progeny by the propagation of internodal cuttings (Johnson, 1961). Tea clones show variation in their nursery performance as influenced by inherent capabilities as well as by nutritional, climatic and hormonal factors (Anon, 1989). Keeping in view the importance of tea crop, there is a need for improvement and to develop varieties suitable for agro-climatic conditions of the area. A systematic breeding programme involves several steps such as collection of clones/germplasm, estimation of genetic variability, induction of genetic variability, implementation of selection and development of improved genotypes to be released as commercial variety (Syukur and Rosidah, 2014). Therefore, a thorough knowledge regarding the amount of genetic variability existing for various characters is essential for initiating the crop improvement program. Improvement through selection in crop is pivoted and depends upon the genetic diversity within the crop species. Effective selection is only possible when the observed genetic variability in the population is adequate and heritable in nature. Thus genetic variability in a population of genetically diverse clones/germplasm is a pre-requisite for a successful breeding programme and the clones serve as a valuable source of base population and provide opportunity for wide variability. Genotypic correlation is an effective tool to determine the relationships among phenotypic traits in genetically diverse population for enhanced progress in crop improvement (Bello et al., 2006). For a successful plant breeding and crop improvement programme, information on the nature and magnitude of genetic variability, extent of transmission of the characters from parent to progeny is of huge importance. The variability available in a genetically diverse population can be separated into heritable and non-heritable component such as phenotypic and genotypic coefficients of variation, heritability and genetic advance on the basis of which selection can effectively be made. Heritability estimates of a character are important for plant breeders as it provides a measure of transmission of characters from parents to their progenies (Poehlman and Sleper, 1995; Syukur and Rosidah, 2014). However, heritability alone only indicates the phenotypic performance and fails to indicate the expected genetic gain in one cycle of selection. Therefore, high heritability alone is not sufficient to make efficient and effective selection in a segregating population, unless it is accompanied by substantial information by the amount of genetic advance (Rosmaina et al., 2016). Genetic advance indicates the degree of the genetic gain obtained in a character from one cycle of selection. Thus high heritability estimates combined with high genetic advance provide the most favorable condition to decide the criteria of selection (Syukur and Rosidah, 2014; Rosmaina et al., 2016). Keeping in view the importance of genetic variability the present study was undertaken with the objectives to assess the magnitude and nature of genetic variability, heritability and genetic advance among 15 clones of tea with respect to various growth attributing traits which could be utilized in crop improvement programme.
Materials and Methods
Selection of genotypes in the field
Twenty-five different early flushing tea genotypes were selected from heterogeneous population of tea garden at National teat and high value crops research Institute (NTHRI) Shinkiari Mansehra, Pakistan. This tea plants population was raised from mixture of tea seeds that were procured from China during 1986. As tea is highly cross pollinated in nature, the mixture of the seeds was produced by open crossing among different commercial tea varieties in China. The selection for the early flushing tea genotypes in the field was based on the earliness of sprouting of the dormant bud, plucking point density, shoot growth and other morphological characteristics such as leaves posing, leaf color and smoothness, erect and bushy type of plants, The selected early flushing genotypes were evaluated for nursery performance. On the basis of first year nursery performance 15 genotypes (BP1-1, BP1-3, BP1-4, BP2-1, BP2-2, BP2-3, BP2-4, BP2-5, BP3-1, BP6-1, BP9-2, AP8-2, AP8-3, AP8-5, CP1-3) were selected for further propagation and quality assessment of made tea. The genotypes were tagged /named according to the name of block and number of plot in each block, such as BP1-1, means plant selected in block B and plot 1. Similarly, AP8-2 and CP1-1 means block A, plot 8 selections 2 and block C, plot 1 selection 1.
The nursery of these selected genotypes was raised during September 2014 through planting of cuttings having single mother leaf which were taken from 6-8 month old grown shoots. The cuttings were inserted in black polythene tubes filled with suitable soil with pH value of 5.96 and were placed under high shade tunnels covered with green color nylon net (providing 80% partial shade) to protect the young cuttings from cold stress during winter and direct sunlight and heat in the hot summer season. Experiment was laid out in Randomized Complete Block Design (RCBD) with three replications by planting one hundred cuttings of each selected clone per replication. Recommended management practices were applied uniformly to each clone. The growth performance of two year old nursery plant of these selected genotypes was assessed during 2016 by recording data on plant height (PH cm), number of branches per plant (NBP), number of leaves per plant (NLP), stem diameter (SD mm), root length (RL cm), root diameter (RD mm), number of lateral roots per plant (NLRP), dry shoot weight (DSW g) and Dry root weight (DRW g).
Statistical analysis
Analysis of variance (ANOVA): The data recorded for each phenotypic trait were subjected to analysis of variance (ANOVA) using randomized complete block design to test the significance of genotypic means for different traits. The analysis of variance was performed using Statistical software statistica model 8.1 (McGraw-Hill, 2008) and significant means were compared using least significant differences (LSD) test at 5% probability levels.
Estimates of variance and coefficient of variation components: The genotypic variance (σg2) and phenotypic variance (σp2) were calculated according to the formula outlined by Syukur and Rosidah (2014) as follow.

Where;
M1= Error mean square, M2= genotypic mean square and r= number of replications.

Where;
(σg2)= genotypic variance, (σe2)= environmental variance and r= number of replications.
The genotypic coefficient of variation (GCV) and phenotypic coefficient of variation (PCV) were obtained according to the formula by Singh and Chaudhary (1985) as:
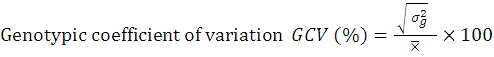
Where;
(σg2)= genotypic variance and X̅=grand mean of the trait.
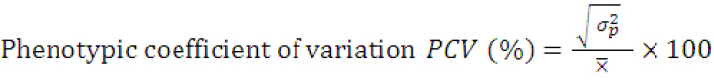
Where;
(σp2)= phenotypic variance and X̅= grand mean of the trait.
Estimation of heritability in broad sense (%): Broad sense heritability (h2) of all the traits was calculated according to the formula outlined by Carson et al. (2004) as:
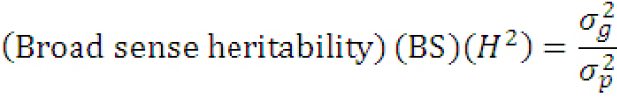
Where (σg2)= genotypic variance and (σp2)= phenotypic variance
Estimation of expected genetic advance (%): Expected genetic advance percentage of mean was calculated according to the procedure described by Shukla et al. (2006) as:

Where;
k = the selection differential (K = 1.75 at 10% selection intensity); σp= the phenotypic standard deviation of the character and H2 = broad sense heritability.
While the Genetic advance as percentage of the mean (GA %) was calculated as:
Where;
X̅= grand mean of the character.
Data were analyzed by analysis of variance techniques (ANOVA) and were subsequently followed by LSD test using software Statistix 8.1 (McGraw-Hill, 2008)
Results and Discussion
Analysis of variance
Table 1 shows the mean squares, F-values, P-Values, LSD and coefficient of variation (CV %). The analysis of variance indicated that genotype mean squares for all traits studied were highly significant (P<0.02 to <0.0001). It reflected the existing of large variability among tested tea clones and this variability can be further utilized in the tea clones improvement program. Traits that showed this genetic potential for further improvement in the tea clones included (1) aerial growth attributing traits (Plant height, number branches per plat, number of leaves per plant, stem diameter and dry shoot weight) and (2) root system architecture traits (root length, root diameter, number of lateral roots per plant and dry root weight).
Agronomic performance of the 15 tea clones
Different aerial growth attributing traits as influenced by the genetic architecture of different tea clones: Analysis of variance of the agronomic data revealed that statistically significant (P <0.02 to <0.0001) variation exists among the 15 tea clones for all the five agronomic and aerial growth attributing traits studied during this experiment (Table 1). Table 2 presents the mean values, LSD (Least Significant difference) and P values for each of the aerial growth attributing traits of the tea clones studied during this research. The data in Table 2 indicates that tea clone BP2-2 had the tallest plant height (PH) of 78.67 cm followed by clone BP1-4, BP3-1, BP1-3 and BP2-5 with PH of 70.47, 69.20, 68.60 and 68.03 cm which were at par with clone BP2-2 as against the shortest PH of 25.77 and 31.97 observed in BP2-4 and AP8-2. Number of branches per plant (NBP) was highest in clone BP6-1 (5.79) followed by clone BP2-2 (4.87) and BP3-1 (4.33) and lowest in BP2-4 (1.67). The highest number of leaves per plant (NLP) of 35.00 was recorded in BP2-2 followed by BP3-1with NLP of 32.67 and the lowest NLP (13.00) was recorded in BP2-4 (Table 2). The thickest stem diameter (SD) of 6.53 mm was recorded in clone BP2-2 closely followed by clone BP9-2 (6.15 mm) and the thinnest SD (3.05mm) was observed in clone BP2-4. Maximum dry shoot weight (DSW) was also produced by clone BP2-2 (17.89 g) and BP6-1 (17.02 g) and the minimum DSW (10.63 g) was produced by clone BP2-3 (Table 2). Tea Plants have complex system of aerial biomass exposition, and the performance of tea plant depend on plant architecture, leaf characteristics and vasculature arrangement (Poorter et al., 2009; Jyotirmaya et al., 2016); branching patterns (Oborny et al., 2012); stem diameter, and dry shoot weight are good indicators of plant growth performance (Traveset et al., 2008). Plant growth performance is the expression of an interaction between endogenous growth mechanisms and exogenous factors exerted by the environment (Stokes et al., 2009). These results are consistent with Ahmad et al. (2015, 2018) who reported significant differences in plant height, number branches per plant, number of leaves per plant, stem diameter and dry shoot weight of different tea germplasm at PARC-National and High Value Crops research Institute (P-NTHRI) Shinkiari Mansehra Pakistan. Similar variations in phenotypic traits of different genotypes in other crops have also been reported by other studies including
Table 1: Analysis of Variance (ANOVA) of all the nine phenotypic traits as affected by different genotypes/clones.
|
MS |
||||||||||
|
SOV |
df |
PH |
NLP |
NBP |
SD |
DSW |
NLRP |
MRL |
RD |
DRW |
|
Rep |
2 |
133.28 |
4.067 |
0.428 |
0.46 |
8.19 |
3.59 |
5.60 |
0.21 |
17.48 |
|
Treatments |
15 |
598.65 |
112.96 |
3.481 |
2.31 |
26.48 |
4.79 |
42.76 |
3.44 |
16.59 |
|
Error |
17 |
48.67 |
46.11 |
0.739 |
0.80 |
4.95 |
1.21 |
11.22 |
0.89 |
2.33 |
|
F-Value |
12.30 |
2.45 |
4.71 |
2.88 |
5.35 |
3.96 |
3.81 |
3.83 |
7.12 |
|
|
P value |
<0.0001 |
0.02 |
<0.001 |
<0.01 |
0.001 |
<0.001 |
<0.01 |
<0.01 |
<0.0001 |
|
|
LSD@alpha =0.05) |
11.67 |
11.36 |
1.44 |
1.49 |
3.72 |
1.84 |
5.60 |
1.59 |
2.55 |
|
|
CV (%) |
11.96 |
27.83 |
22.84 |
16.61 |
16.92 |
20.50 |
12.25 |
17.84 |
18.89 |
|
(MS: Mean Square, S.O.V.: Source of variation, df: Degree of Freedom); PH: plant height; NLP: number of leaves per plant; NBP: number of branches per plant; SD: stem diameter; DSW: dry shoot weight; NLRP: number of lateral roots per plant; MRL: main root length; RD: root diameter and DRW: root dry weight per plant.
Table 2: Different aerial growth attributing traits as influenced by the genetic architecture of different tea genotypes.
|
Early flushing Tea clone |
PH ( cm) |
NBP |
NLP |
SD (mm) |
DSW (g) |
|
BP1-1 |
53.17 cd |
4.00 bcd |
26.67 abcd |
6.16 ab |
12.53 cde |
|
BP1-3 |
68.60 ab |
4.33 bc |
25.33 abcd |
5.96 abc |
13.13 cde |
|
BP1-4 |
70.47 ab |
4.33 bc |
25.33 abcd |
5.21 abcd |
13.47 bcde |
|
BP2-1 |
60.35 bcd |
3.03 cdef |
22.67 bcde |
5.66 abcd |
11.78 de |
|
BP2-2 |
78.67 a |
4.87 ab |
35.00 a |
6.53 a |
17.89 a |
|
BP2-3 |
49.70 d |
4.30 bc |
25.00 abcd |
4.43 de |
10.63 e |
|
BP2-4 |
25.77 e |
1.67 f |
13.00 e |
3.05 e |
11.71 de |
|
BP2-5 |
68.03 ab |
3.67 bcde |
27.67 abc |
5.02 bcd |
14.50 abcd |
|
BP3-1 |
69.20 ab |
4.33 ab |
32.67 ab |
5.91 abcd |
14.43 abcd |
|
BP6-1 |
59.20 bcd |
5.97 a |
20.33 cde |
5.77 abcd |
17.02 ab |
|
BP9-2 |
61.53 bc |
2.67 def |
25.00 abcd |
6.15 ab |
12.70 cde |
|
AP8-2 |
31.97 e |
2.33 ef |
15.33 de |
4.47 cde |
16.22 abc |
|
AP8-3 |
60.27 bcd |
4.00 bcd |
28.00 abc |
5.48 abcd |
11.61 de |
|
AP8-5 |
54.833 cd |
3.00 cdef |
16.00 de |
5.48 abcd |
14.14 bcde |
|
CP1-3 |
63.567 bc |
3.93 bcd |
28.00 abc |
5.53 abcd |
12.53 cde |
|
LSD value (5 %) |
11.667 |
1.437 |
11.358 |
1.4971 |
3.721 |
|
P values |
<0.0001 |
<0.001 |
=0.02 |
<0.01 |
<0.001 |
PH: plant height (cm); NBP: number of branches per plant; NLP: number of leaves per plant; SD: stem diameter (mm) and DSW: dry shoot weight (g); The data were statistically highly significant at P<0.0001for PH, P<0.001 for NBP, P<0.001 for SDW and moderately significant for NLP (P,0.02) and SD (P<0.01) Table 2. Means with different alphabetic letters indicate statistically significant differences according to Least Significant Differences (LSD) test (P< 0.05).
Baraskar et al. (2014) in sixty one genotypes of Glycine max (L.); Ogunniyan and Olakojo (2015) in 15 elite maize genotypes and Jeberson et al. (2015) in 24 genotypes of lentils and have reported that such variation in phenotypic traits is due to the genetic variation in different genotypes and could be used for estimating genetic, environmental and phenotypic variances (σ2g, σ2e and σ2p), genotypic and phenotypic coefficient of variances (GCV and PCV) and ultimately for estimating broad sense heritability (H2) and genetic advance (GA).
Different root system architectural parameters and root dry mass as influenced by genetic variation of different tea genotypes: Analysis of variance of the agronomic data revealed that statistically significant (P <0.01 to <0.0001) variation exists among the 15 tea clones for all the four root system architectural traits studied during this research (Table 1). Table 3 presents the mean values, LSD (Least Significant difference) and P values for each of the root architectural traits of the tea clones studied during this research. The data in Table 3 indicates that tea clone BP2-2 had the longest main root length (MRL) of 35.10 cm, the thickest root diameter (RD) of 11.57 mm, the highest number of lateral roots per plant (NLRP) of 7.67 and highest dry root weight per plant (DRW) of 11.57 grams followed by clones AP8-5 and BP9-2 with MRL of 31.33 and 30.33, clone AP8-3 with RD of 11.40 mm, clone BP1-4 with NLRP of 6.83 per plant and clone AP8-3 with DRW of 11.40 grams per plant which were statistically at par with clone BP2-2 as against the shortest MRL of 22.0 cm, thinnest RD of 2.72 mm, the minimum NLRP of 3.0 and minimum DRW of 2.72 grams per plant recorded in clone BP2-4 (Table 3).
Table 3: Different root system architectural parameters and root dry weight as influenced by genetic variation of different tea Clones.
|
Early flushing Tea genotypes |
MRL(cm) |
RD |
NLRP |
DRW ( g) |
|
BP1-1 |
28.67 bcd |
7.93 cdef |
4.50 efgh |
7.93 cdef |
|
BP1-3 |
23.67 cdef |
10.21abc |
6.50 abcd |
10.21 abc |
|
BP1-4 |
28.67 bcd |
9.35 abcde |
6.83 ab |
9.35 abcde |
|
BP2-1 |
23.33 def |
5.24 gh |
4.67 defgh |
5.24 gh |
|
BP2-2 |
35.10 a |
11.57 a |
7.67 a |
11.57 a |
|
BP2-3 |
23.00 ef |
6.02 fg |
5.67 bcdef |
6.02 fg |
|
BP2-4 |
22.00 f |
2.72 h |
3.00 h |
2.72 h |
|
BP2-5 |
27.68 bcde |
7.48 defg |
6.30 abcde |
7.48 defg |
|
BP3-1 |
22.05 f |
9.59 abcd |
6.57 abc |
9.59 abcd |
|
BP6-1 |
29.10 bc |
7.38 defg |
5.00 bcdefg |
7.38 defg |
|
BP9-2 |
30.33 ab |
7.20 defg |
5.57 bcdef |
9.00 bcde |
|
AP8-2 |
28.33 bcde |
9.00 bcde |
3.67 gh |
7.20 defg |
|
AP8-3 |
29.00 bc |
11.40 ab |
5.33 bcdefg |
11.40 ab |
|
AP8-5 |
31.33 ab |
7.01 efg |
4.33 fgh |
7.01 efg |
|
CP1-3 |
28.00 bcde |
9.09 abcde |
4.87 cdefg |
9.09 abcde |
|
LSD value (5%) |
5.602 |
2.553 |
1.839 |
2.526 |
|
P values |
<0.01 |
<0.01 |
<0.001 |
<0.0001 |
MRL= main root length (cm), RD= root diameter (mm), NLRP= number of lateral roots per plant, , DRW= dry root weight (g); The data were statistically significant at P<0.01for MRL and RD, P<0.001 for NLRP and P<0.0001 for DRW Table 3. Means with different alphabetic letters indicate statistically significant differences according to Least Significant Differences (LSD) test (P< 0.05).
Plant root systems performs various essential functions such as support of a plant body, uptake of water and nutrition, storage of nitrogen components and carbohydrates, biosynthesis of hormones (Khan et al., 2012; Khan et al., 2018). Therefore, proper growth and functions of roots are vital to the maintenance of vigorous growth of plants and to increase yield and improve the quality in tea crop (Masataka, 1994). Root thickness/ root diameter is an important factor that influences the root system architecture of the plant. Therefore, it plays vital role in functioning the root system and anchoring and supporting the plant into the soil (Khan et al., 2018). Variation in root thickness is influenced by inherent capabilities of tea clones as well as by nutritional, climatic and hormonal factors (Anon, 1989). Number of later roots per plant is a good indicator of plant growth and morphology of root system architecture (RSA) and its physiological study may provide more consistent prediction of seedlings potential and their better establishment in the open field (Khan et al., 2018). The difference in lateral roots number in different tea clones may be due to the genetic variation in the endogenous auxin production capacity of the tea clones. These results are supported by Ahmad et al. (2015) who reported significant variation in MRL, RD, NLRP and RDW among different tea germplasm at nursery stage. Khan et al. (2012) also reported significant variation in MRL, NLRP and DRW among different genotypes of recombinant inbreed lines (RIL) population of tomato and contributed it to the genetic variation in the RIL population. George and Sherrington (1984) also found significant variation in the rooting ability of different tea clones and attributed it to genetic variations in the levels of endogenous auxin production in the tea clones. Li et al. (2015) observed significant genetic variation among 103 maize genotypes with medium to high heritability and significant correlation for root traits. They concluded that total root length and total root surface area are the major contributors to root system variation and can be used as favorable selection criteria at seedling stage for crop improvement. Kumar et al. (2012) characterized differences in morphological root traits at the seedling stage in 74 maize inbred lines and quantified the phenotypic and genotypic coefficient of variation, heritability, and interrelationships between these traits.
Genetic correlations among tested traits: To investigate the genetic interaction among different growth parameters, Pearson’s correlation analysis was performed among all pairs of growth-attributing traits of seedlings. The analysis revealed statistically weak to highly significant (r2 = 0.36–0.78 and p vales 0.02 to < 0.0001) and positive correlations among all the aerial growth attributing traits and root system architectural
Table 4: Genetic correlations among different growth attributing traits.
|
PH |
NLP |
NBP |
SD |
DSW |
MRL |
NLRP |
RD |
DRW |
|
|
PH |
1 |
||||||||
|
NLP |
0.59 *** |
1 |
|||||||
|
NBP |
0.48 ** |
0.65**** |
1 |
||||||
|
SD |
0.57*** |
0.48** |
0.45** |
1 |
|||||
|
DSW |
0.56*** |
0.49 ** |
0.33 * |
0.57*** |
1 |
||||
|
MRL |
0.34* |
0.11 NS |
0.12 NS |
0.15 NS |
0.36* |
1 |
|||
|
NLRP |
0.78**** |
0.54*** |
0.49*** |
0.53*** |
0.66 *** |
0.15 NS |
1 |
||
|
RD |
0.51*** |
0.38* |
0.28 NS |
0.57*** |
0.55*** |
0.23NS |
0.55 *** |
1 |
|
|
DRW |
0.59*** |
0.56*** |
0.37 * |
0.44** |
0.77**** |
0.36* |
0.54*** |
0.61*** |
1 |
****The correlation is significant at P<0.00001; ***: The correlation is significant at P<0.0001; **: The correlation is significant at P<0.001 and *: The correlation is significant at P<0.01; PH: plant height (cm); NBP: number of branches per plant; NLP: number of leaves per plant; SD: stem diameter (mm) and DSW: dry shoot weight (g); MRL: main root length (cm); RD: root diameter (mm); NLRP: number of lateral roots per plant; DRW: dry root weight (g).
Table 5: Genetic, environmental, phenotypic variances, genetic and phenotypic coefficient of variation, Genetic heritability and genetic advance for phenotypic traits.
|
Traits |
𝜎2g |
𝜎2e |
𝜎2p |
GCV % |
PCV % |
H2 (%) |
GA |
GA % |
|
PH |
183.33 |
16.22 |
199.55 |
23.20 |
24.21 |
91.86 |
27.59 |
53.26 |
|
NLP |
22.28 |
15.37 |
37.65 |
19.35 |
25.15 |
59.18 |
9.31 |
38.79 |
|
NBP |
0.91 |
0.25 |
1.16 |
25.36 |
28.63 |
78.77 |
2.63 |
76.94 |
|
SD |
0.50 |
0.27 |
0.77 |
13.12 |
16.27 |
65.28 |
1.29 |
23.95 |
|
DSW |
7.18 |
1.65 |
8.83 |
20.38 |
22.59 |
81.31 |
5.02 |
38.33 |
|
NLRP |
1.19 |
0.40 |
1.59 |
20.34 |
23.55 |
74.75 |
1.81 |
51.72 |
|
MRL |
10.51 |
3.74 |
14.25 |
11.86 |
13.81 |
73.76 |
7.20 |
26.35 |
|
RD |
0.85 |
0.29 |
1.15 |
17.34 |
20.15 |
73.89 |
1.67 |
31.67 |
|
DRW |
4.75 |
0.78 |
5.53 |
26.98 |
29.11 |
85.96 |
4.23 |
53.55 |
𝜎2g: genetic variance; 𝜎2e: environmental variance; 2p: phenotypic variance; GCV %: Genetic coefficient of variation; PCV %: Phenotypic coefficient of variation; H2 (%): Broad sense heritability (%) and GA %: genetic advance %.
traits except main root length (MRL) which was weakly correlated with only plant height (PH) and root dry weight (RDW) with r2 =0.34, 0.37 and P=0.02 (Table 4). The highest positive correlations of r2=0.78, 0.77 and P<.00001 were observed between PH and number of lateral root per plant (NLRP) and between dry root weight (DRW) and dry shoot weight (DSW) respectively. While the minimum significant correlation of r2 =0.33, 0.34, 0.36 and 0.37 was observed between number of branches per plant (NBP) and DSW, MRL and PH, MRL and DRW and NBP DRW respectively. On the other hand, no correlation was observed between root traits MRL and NLRP and among MRL and seedling aerial traits such as NBP, NLP and SD (Table 4). In addition to the NLRP the other two root system architectural (RSA) traits (RD and DRW) were strongly correlated with most of the aerial growth attributing traits of the seedlings of tea clones. These positive correlations among RAS traits and aerial growth attributing traits indicate that root and shoot traits genetically interlinked with each other. These results are in agreement with those reported by Khan et al. (2012) in a RIL population of tomato who observed significant and positive correlation among lateral root number, root fresh weight, root dry weight and root diameter with seedling shoot fresh weight, shoot dry weight, plant height, and stem diameter during their experiment. They concluded that the correlation between RSA and seedlings growth may be due to the important role of RSA in providing nutrients, water, and physical support to the plants. Khan et al. (2018) also reported strong and positive correlation between NLRP, root fresh mass and root callus diameter and above ground seedling growth parameter in their experiment on kiwi seedlings. They concluded that increase in aerial part of kiwi seedlings is due to the formation of strong root system and suggested that NLRP and total root size of seedlings are one of the best predictors for assessing quality nursery seedlings. Davis and Jacobs (2005) also reported correlation between greater root size and higher number of first-order lateral roots and improved field performance of transplanted seedlings. Genotypic association had been used as an effective tool to ascertain the relationships among agronomic traits in genetically diverse population for rapid selection and enhanced progress in crop improvement (Bello et al., 2006). Ogunniyan and Olakojo (2015) reported that understanding of character association in crops is important for effective and rapid selection in crop improvement.
Estimates of genetic, environmental and phenotypic variances and coefficients of variation: The estimates of genotypic variances (σ2g), environmental variance (σ2e), phenotypic variances (σ2P), and genotypic coefficient of variation (GCV) and phenotypic coefficient of variation (PCV) are presented in Table 5. Genetic variance values ranged from 0.50 for stem diameter (SD) to 183.33 for plant height (PH). Similarly the environmental and phenotypic variance values ranged from 0.27 and 0.77 to 16.22 and 299.55 for SD to PH. While the genotypic coefficient of variation values range from 11.86 for main root length (MRL) to 25.36 for number of branches per plant (NBP). Similarly, the phenotypic coefficient of variation values ranged from 13.81 for MRL to 28.63 for NBP (Table 5). The data indicated that the variations among the genotypes were mostly due to genetics components rather than environmental effect, as revealed by higher genetic variances compared to the environmental variance for all the character studied. This indicates that these traits were controlled by few genes and are less influenced by the environment and simple in nature of their inheritance. Contrarily the genetic variance (σ2g), was relatively small than the phenotypic variance (σ2P) for all the traits studied. However, the difference between σ2g and σ2P was minimal indicating high contribution of genotypic factor for phenotypic expression of such characters (Yadeta et al., 2011) and this may be due to the fact that the experiment was carried out under controlled condition under green net shade. These results are in agreement with Sanguinet et al. (2007) who reported small variation between genetic and phenotypic variances for plant height, Primary root length, total root dry weight, shoot dry weight in durum wheat germplasm, Ogunniyan and Olakojo (2015) for plant height and number of leaves per plant in elite inbreed lines of maize and Rosmaina et al. (2016) for plant height, stem length and stem diameter in among local challis genotypes. According to Rosmaina et al. (2016) and Besufikad (2018) GCV and PCV values greater than 20% are consider as high and values between 10 to 20% as medium and less than 10% are considered to be low. Thus in the present study high GCV values were recorded for PH, dry shot weight (DSW), number of lateral roots per plant (NLRP) and dry root weight (DRW) and medium values were recorded for the rest of the traits studied. While high PCV values were recorded for most of the traits studied except SD and MRL which for which medium PCV values were recorded (Table 5). High GCV and PCV vales exhibit the existence of substantial genetic and phenotypic variability for such characters and selection may be may be effectively made on the basis of these characters. (Rosmaina et al., 2016). Such medium to high GCV and PCV values have been reported by Besufikad (2018) for different phenotypic traits in soybean (Glycine Max L) varieties.
Genotypic coefficient of variance provides information on the genetic variability present in quantitative characters in base population, but it is not possible from only the genotypic coefficient of variance to determine the amount of the variation that was heritable. The estimates of heritability together with GCV and GA, may be good predictors of the amount of advance to be expected from selection (Murtadha et al., 2004). Thus, the heritable portion of the variation could be more useful and will help in heritability estimates.
Estimates of Broad Sense Heritability and Genetic Advance: The estimates of broad sense heritability (H2 %) and genetic advance (GA %) are presented in Table 5. The estimates of broad sense heritability % ranged from 59.18 for number of leaves per plant (NLP) to 91.86 % for plant height (PH) Table 5. Rosmaina et al. (2016) reported that heritability values greater than 80% are regarded very high, values from 60–79% moderately high, values from 40–59% medium and heritability values less than 40% are considered low.
Accordingly, the estimate of broad sense heritability (H2) of NLP was medium category (59.18 %); the estimates of broad sense heritability of NBP, SD, NLRP, and MRL (65.28 to 78.77 %) were moderately high, while the estimates of broad sense heritability of PH, DSW and DRW were very high (81.31 to 91.86 %). The growth attributing traits having high heritability revealed relatively small influence of the environmental factors to the phenotype and selection for such characters could easily be made due to high additive effect (Sharma et al., 2010). Such high estimates of broad sense heritability have also been reported for plant height and stem diameter in chilli genotypes (Pujar et al., 2017), high heritability for plant height and medium for stem diameter in chilli pepper genotypes (Rosmaina et al., 2016). However, these results are in partial agreement with Idrissi et al. (2015) who reported moderately high heritability for number of lateral roots per plant (NLRP), main root length (MRL), root diameter (RD), stem diameter (SD), dry root weight (DRW) and dry shoot weight (DSH) in a lentil (Lens culinaris Medik.) recombinant inbred line population and Riaz et al. (2013) who reported very high heritability for PH, DSW, but also very high heritability for MRL, and LRN and moderately high heritability for DRW in cotton (Gossypium hirsutum L.) genotypes which are in partial agreement with our results.
However, heritability alone cannot provide complete information of the amount of genetic improvement that would result from selection of individual genotype. As the values for heritability and genetic advances showed an independent trend for most of the quantitative traits studied during this study revealed the fact that high heritability and large genetic advance could not be expected always which was also reported by (Najeeb et al., 2009; Ali et al., 2012). As genetic advance explains the magnitude of the expected genetic gain obtained in a character from one cycle of selection, therefore, Ogunniyan and Olakojo (2015) recommended that consideration of heritability in association with the genetic advance is more useful in plant breeding and would facilitate the effective prediction of elite genotype selection outcome.
Genetic advance as percent of the mean (GA %) in this study ranged from 23.95 for stem diameter (SD) to 76.94% for number of branches per plant (NBP), Table 5. As reported by Abebe et al. (2017) reported that genetic advance as percent of mean (GAM) is classified as low (<10%), moderate (10-20%) and high (>20%). According to this classification, in the present research all the quantitative traits studied during this study had high GA% i.e. greater than 20 % (Table 5). This indicated the role of additive gene action for these traits. Traits such as PH (53.26), NBP (76.94), DSW (38.33), NLRP (51.72) and DRW (53.55 GA %) also had high broad sense heritability (H2). Traits with high heritability accompanied by high genetic advance could be explained by additive gene action and provide the most suitable condition for reliable crop improvement through selection of such traits (Iqbal et al., 2018). These results are in agreement with Bello et al. (2015) who reported high GA% and high and moderate heritability for all the traits studied in Okra. Rosmaina et al. (2016) also reported high heritability along with high genetic advance as percent of the mean for plant height, stem length; stem diameter; leaf length; leaf width; plant canopy width, days to flowering, fruit length; fruit diameter, single fruit weight, number of fruit per plant, fruit weight per plant among chili pepper genotypes.
Conclusion
Based on the findings in this study, it is concluded that all the nine characters i.e. plant height, number of leaves per plant, number of branches per plant, stem diameter, dry shoot weight, number of lateral roots per plant main root length, root diameter and root dry weight traits could be used as good criteria for selection in tea crop improvement and breeding program because these characters had high genotypic coefficient of variation, heritability estimate and genetic advance as percent of the mean. The correlation analysis revealed that most of these traits are genetically interlinked which may facilitate indirect selection of one trait for the other trait that is genetically interlinked.
Novelty Statement
To the best of our knowledge this kind of research and analysis has been carried out for the first time in higher plants, particularly in tea (Camellia sinensis L) not only in Pakistan but also in the world. The research presents novel ideas about different tea germplasm which will add new parameters to future research and breeding program in tea crop and will improve breeding efficiency in tea crop.
Authors Contribution
FA, NK, FSH, AW: Conceived and designed the experiment (15%).
FA, NK, MAK, IA and SI: Collected and analyzed the data and wrote the paper (25 %).
BHS, SA and QuZ: Provided technical assistance at every stage of the experiment (15%).
NK and FA: Re-rote the paper and incorporated all the analysis and suggestions suggested by the reviewers in the revised version of the manuscript (40%).
All the other authors critically reviewed and revised the article (15%).
Conflict of interest
The authors have declared no conflict of interest.
References
Abebe, T., S. Alamerew and L. Tulu. 2017. Genetic variability, heritability and genetic advance for yield and its related traits in rainfed lowland rice (Oryza sativa L.) genotypes at Fogera and Pawe, Ethiopia. Adv. Crop Sci. Tech., 5(272): 1-8. https://doi.org/10.4172/2329-8863.1000272
Adnan, M., A. Ahmed, N. Khalid, I. Hayat and I. Ahmed. 2013. Chemical composition and sensory evaluation of tea (camellia sinensis) commercialized in Pakistan. Pak. J. Bot. 45(3): 901-907.
Ali, A., S. Khan and M.A. Asad. 2012. Drought tolerance in wheat: genetic variation and heritability for growth and ion relations. Asian J. P. Sci. 1: 420–422. https://doi.org/10.3923/ajps.2002.420.422
Ahmad, F., F.S Hamid, A. Waheed, Q. Zaman, S. Aslam,, B.H. Shah, S. Islam., S. Sarwar and I. Ali. 2015. Growth performance of tea (Camellaia sinensis L.) cultivars at nursery stage. J. Agric. Res. 53(3): 365-374.
Ahmad, F., N. Khan, F.S. Hamid, Q. Zaman, S. Islam, M.A. Khan and S. Sarwar. 2018. Early pruning and potash fertilizer improve the recovery and growth of deeply pruned tea (Camellia sinensis L). Pakistan J. Agric. Res., 31(2): 151-157. https://doi.org/10.17582/journal.pjar/2018/31.2.151.157
Anon. 1989. Collection of the improved tea varieties in China. Tea Res. Inst., Chin. Acad. Agric. Sci. Shanghai Sci. Tech. Publ., China. pp. 73-47.
Banerjee. 1992. Selection and breeding of tea In: Tea cultivation to consumption, chapman and hall, London, pp. 54. https://doi.org/10.1007/978-94-011-2326-6_3
Baraskar, V.V., V.H. Kachhadia, J.H. Vachhanl, H.R. Barad, M.B. Patel and M.S. Darwankar. 2014.Genetic variability, heritability and genetic advance in soybean [Glycine max L. Merrill], Electron. J. Plant Breed. 5: 802-806.
Bello, D., A.A. Sajo, D. Chubado and J.J. Jellason. 2006. Variability and correlation studies in okra (Abelmoschus esculentus (L.) Moench). J. Sustainable Dev. Agric. Environ. 2(1): 120-126.
Bello, O.B., D. Aminu, B.A. Gambo, A.H. Azeez, M. Lawal, J.O. Agbolade, A. Iliyasu and U.A. Abdulhamid. 2015. Genetic diversity, heritability and genetic advance in okra [Abelmoschus esculentus (L.) Moench] Bang. J. Pl. Breed. Genet., 28(2): 25-38. https://doi.org/10.3329/bjpbg.v28i2.29960
Besufikad, E.G. 2018. Genetic variability, heritability and expected genetic advance as indices for selection in soybean [Glycine max (L.) Merrill] Varieties. Am. J. Life Sci. 6(4): 52-56. https://doi.org/10.11648/j.ajls.20180604.11
Carson, M.L., C.W. Stuber and M.L. Senior. 2004. Identification and mapping of quantitative trait loci conditioning resistance to southern leaf blight of maize caused by Cochliobolus herterostrophus race O. Phytopathology, 94: 862-867. https://doi.org/10.1094/PHYTO.2004.94.8.862
Davis, A.D. and D.F. Jacobs. 2005. Quantifying root system quality of nursery seedlings and relationship to outplanting performance. New For. 30: 295–311. https://doi.org/10.1007/s11056-005-7480-y
George, E.F. and P.O. Sherrington. 1984. Plant propagation by tissue culture. Hand book and directory of commercial laboratories. Exegetic Ltd., London.
Idrissi, O., C.H. Houasli, S.M. Udupa, E.D. Keyser, P. Van Damme and J. De Riek. 2015a. Genetic variability for root and shoot traits in a lentil (Lens culinaris Medik.) recombinant inbred line population and their association with drought tolerance. Euphytica. 204: 693–709. https://doi.org/10.1007/s10681-015-1373-8
Iqbal, T., I. Hussain, N. Ahmad, M. Nauman, M. Ali, S. Saeed, M. Zia and F. Ali. 2018. Genetic variability, correlation and cluster analysis in elite lines of rice. J. Sci. Agric. 3(2): 85- 91. https://doi.org/10.25081/jsa.2018.v2.900
Jeberson, M.S., K.S. Shashidhar and K. Iyanar. 2015. Genetic variability, heritability, expected genetic advance and correlation studies of some economical characteristics in lentil. Trends Bio. 8(5): 1344-1347.
Johnson, R.J. 1961. Note book for tea planters. 4th ed. R.J. Johnson and Co. Colombo (eds.), Srilanka. pp.135.
and Enhancing crop yield by optimizing plant developmental features. https://doi.org/10.1242/dev.134072
Khan, N., R.H. Kazmi, L.A.J. Willems, A.W. van Heusden, W. Ligterink and H.W.M. Hilhort. 2012. Exploring the natural variation for seedling traits and their link with seed dimensions in tomato. PLoS One. 7(8): e43991.
Khan, N., F.F. Hamid, M.A. Khan, S. Ahmad, S. Sumreen, I. Ahmed, F. Ahmad, S. Islam and B.H. Shah. 2018. Critical values of alternative organic amendments on kiwi seedling growth, Soil Sci. Plant Nutr., 64: 774-781.
Kumar, B., A.H. Abdel-Ghani, J. Reyes-Matamoros, F. Hochholdinger and T. Lübberstedt. 2012. Genotypic variation for root architecture traits in seedlings of maize (Zea mays L.) inbred lines. Plant Breed. 131: 465–478. https://doi.org/10.1111/j.1439-0523.2012.01980.x
Li, R., Y. Zeng, J. Xu, Q. Wang, F. Wu, M. Cao, M.H. Lan, Y. Liu and Y. Lu. 2015. Genetic variation for maize root architecture in response to drought stress at the seedling stage. Breed. Sci. 65: 298–307. https://doi.org/10.1270/jsbbs.65.298
Masataka., Y. 1994. Root system formation in clonal tea plants. JARQ. 28: 26-35.
Matthews, R.B. and W. Stephens. 1998b. A simulation model describing seasonal yield variation and potential production of tea. 1. Shoot development and extension. Exp. Agric. 34: 369-389. https://doi.org/10.1017/S0014479798004098
McGraw-Hill, C. 2008. Statistix 8.1. Analytical software, tallahassee. Maurice/Thomas text, Florida, USA.
Murtadha, S., O.J. Ariyo and O.B. Kehinde. 2004. Character association of seed yield and its components in okra [Abelmoschus esculentus (L.) Moench]. Ogun. J. Agric. Sci. 3(1): 222-233.
Najeeb S., A.G. Rather, G.A. Parray, F.A. Sheikh and S.M. Razvi. 2009. Studies on genetic variability, genotypic correlation and path coefficient analysis in maize under the high altitude temperate conditions of Kashmir, Maize Genet. Cooperation Newsl. 2009: 83–46.
Oborny, B., C. Mony and T. Herben. 2012. From virtual plants to real communities: a review of modelling clonal growth. Ecol. Model. 234: 3–19. https://doi.org/10.1016/j.ecolmodel.2012.03.010
Ogunniyan D.J. and S.A. Olakojo. 2015. Genetic variation, heritability, genetic advance and agronomic character association of yellow elite inbred lines of maize (Zea mays L.). Niger. J. Genet. 28(2): 24–28. https://doi.org/10.1016/j.nigjg.2015.06.005
Poehlman, J.M. and D.A. Sleper. 1995. Field Crops. Iowa State University Press, United States of America.
Poorter, H., U. Niinemets, L. Poorter, I.J. Wright, R. Villar. 2009. Causes and consequences of variation in leaf mass per area (LMA): a meta-analysis. New Phytol. 182: 565–588. https://doi.org/10.1111/j.1469-8137.2009.02830.x
Pujar, U.U., T. Shantappa, R.C. Jagadeesha, V.D. Gasti and N. Sandhyrani. 2017. Genetic variability, heritability, correlation and path analysis in chilli (Capsicum annuum L.). Int. J. Pure Appl. Biosci. 5: 579-586. https://doi.org/10.18782/2320-7051.5878
Riaz, M., M. Naveed, J. Farooq, A. Farooq, A. Mahmood, C.M. Rafiq, M. Nadeem and A. Sadiq. 2013. AMMI Analysis for stability, adaptability and GE interaction studies in cotton (Gossypium hirsutum L.). JAPS., 23(3): 865-871.
Rosmaina, H.F. Syafrudin, T.H. Hasrol, F. Yanti, K.H. Juliyanti and K.F. Zulfahmi. 2016. Estimation of variability, heritability and genetic advance among local chili pepper genotypes cultivated in peat lands, Bulg. J. Agric. Sci. 22: 431–436.
Sanguineti, M.C., S. Li, M. Maccaferri, S. Corneti, F. Rotondo, T. Chiari and R. Tuberosa. 2007. Genetic dissection of seminal root architecture in elite durum wheat germplasm. Ann. Appl. Biol. 151: 291–305. https://doi.org/10.1111/j.1744-7348.2007.00198.x
Shukla, S., A. Bhargava, A. Chatterjee, J. Srivastava, N. Singh and S.P. Singh. 2006. Mineral profile and variability in vegetable amaranth (Amaranthus tricolor). Plant Foods Hum. Nutr. 61: 23–28. https://doi.org/10.1007/s11130-006-0004-x
Singh, R.K. and B.D. Chaudhary. 1985. Biometrical methods in quantitative genetic analysis. Kalyani Publ. New Delhi India.
Sultana, T., G. Stecher, R. Mayer, L. Trojer, M.N. Qureshi, G. Abel, M. Popp and G.K. Bonn. 2008. Quality assessment and quantitative analysis of flavonoids from tea samples of different origins by HPLC-DAD-ESI-MS. J. Agric. Food Chem. 56 (10): 3444-3453. https://doi.org/10.1021/jf703625r
Sharma, V.K., C.S. Semwal and S.P. Uniyal. 2010. Genetic variability and character association analysis in bell pepper (Capsicum annuum L.). J. Hortic. For. 2: 058-065.
Squire, G.R. 1985. Ten years of tea physiology. Tea, 6: 43-48.
Stokes, A., C. Atger, A.G. Bengough, T. Fourcaud and R.C. Sidle. 2009. Desirable plant root traits for protecting natural and engineered slopes against landslides. Plant Soil. 324(1–2):1–30. https://doi.org/10.1007/s11104-009-0159-y
Syukur, M. and S. Rosidah. 2014. Estimation of genetic parameter for quantitative characters of pepper (Capsicum annuum L.). J. Trop. Crop Sci., 1: 4–8. https://doi.org/10.5979/cha.1964.22_1
Toyao, T. 1965. Correlation and genetical analysis of several characteristics at the stage of individual selection of tea plant. Part-II. Study of tea. 29(1):8.
Traveset A., E. Moragues and F. Valladares. 2008. Spreading of the invasive Carpobrotus aff. acinaciformis in Mediterranean ecosystems: the advantage of performing in different light environments. Appl. Vegetation Sci. 11: 45–54. https://doi.org/10.1111/j.1654-109X.2008.tb00203.x
Yadeta, B., D. Belew, W. Gebreselassie and F. Marame. 2011. Variability, heritability and genetic advance in hot pepper (C.annuum L.) genotypes in West Shoa Ethiopia. Am. -Eurasian J. Agric. Environ. Sci., 10: 587–592.
Yao, M.Z., L. Chen, X.C. Wang, L.P. Zhao and Y.J. Yang. 2007. Genetic diversity and relationship of clonal tea cultivars in China revealed by ISSR markers. Acta Agron. Sinica, 33(4): 598–604 (in Chinese).
To share on other social networks, click on any share button. What are these?