
Factors Influencing Output of Rice Produced and Choice of Marketing Outlets Among Smallholder Farming Households, Abuja, Nigeria


Research Article
Factors Influencing Output of Rice Produced and Choice of Marketing Outlets Among Smallholder Farming Households, Abuja, Nigeria
Luka Anthony*, Olugbenga Omotayo Alabi, Elizabeth Samuel Ebukiba and Vandi Gamba
Department of Agricultural Economics, University of Abuja, PMB 117, Gwagwalada-Abuja, Federal Capital Territory, Nigeria.
Abstract | Factors influencing the output of rice produced and choice of marketing outlets among small-holder rural farming households are the main focus to improve rice production and increase the income of the farmers. Primary data were used for this study. Data were obtained using a well-designed well-structured questionnaire. The questionnaires were administered to two hundred and seven (207) small-holder rural rice farming households. Multi-stage sampling technique was adopted. Data were analyzed using Multinomial Logit Model, Gini-Coefficient, Double-Log Regression Model, (Cobb-Douglas) and Principal Component Analysis. The results of the Multinomial Logit regression model show that among the significant factors that influence the choice of rice market outlets were: sex of the household head (P<0.10), educational level (P<0.10), access to credit facilities (P<0.05), extension services (P<0.01), price information (P<0.05), market information (P<0.01) and, marketing experience ((P<0.05). The value of Gini- Coefficient calculated was 0.91429. The observed inequality in income distribution among small-holder rural rice farmers was a reflection of inefficiency in the market structure for rice. The results of Double-Log Regression model revealed that quantity of rice output harvested was positively and significantly influenced by farm size (P<0.05), the quantity of seed planted (P<0.01), the volume of chemical applied (P<0.05), labour input (P<0.01), and contract farming (P<0.05). Quantity of fertilizer and expected price of output was negative and significant at (P<0.01), and (P<0.05) probability levels respectively. The coefficient of the multiple determinations (R2) in the production model was 0.51. This signifies that the explanatory variables included in the model accounted for about 51% variations in the quantity of rice output harvested in the study area. Smallholder rice farmers were faced with the following challenges in rice production and market outlet choice which include: Fire outbreak, thieves, cattle herdsmen attack, flood occurrence, transportation problem, poor storage facility, inadequate capital, lack of land/ tractor, poor price, high cost of chemical, inadequate fertilizer, lack of improved seed, inadequate extension officers, and lack of credit facilities. This study recommends that new innovations and technology that targets increased productivity should be promoted, provision of adequate extension officers is needed, input market supply for provision of seeds, fertilizers and storage facilities should be made accessible to farmers, provision of rice processing equipment should be made available, contract farming and marketing should be encouraged for increased rice production and market out choice for profit maximization among rice farmers to eradicate poverty and improve their welfare.
Received | October 20, 2020; Accepted | December 10, 2020; Published | March 02, 2021
*Correspondence | Luka Anthony, Department of Agricultural Economics, University of Abuja, PMB 117, Gwagwalada-Abuja, Federal Capital Territory, Nigeria; Email: [email protected]
Citation | Anthony, L., O.O. Alabi, E.S. Ebukiba and V. Gamba. 2021. Factors influencing output of rice produced and choice of marketing outlets among smallholder farming households, Abuja, Nigeria. Sarhad Journal of Agriculture, 37(1): 262-277.
DOI | http://dx.doi.org/10.17582/journal.sja/2021/37.1.262.277
Keywords | Production, Rice, Marketing Choice, Smallholder, Farming households
Introduction
Agriculture in Nigeria is mostly dominated by small-holder and subsistence farmers that are engaged primarily in the production of the required bulk of food for the entire Country. Small-holder farmers are majorly considered and referred to as farmers that have landholdings of less than 10 hectares. These categories of people consist of about 80% of Nigeria’s farming population which takes up the responsibilities for 80% – 90% of food production in the Country, and they are the poorest groups of people in Nigeria (Mgbenka and Mbah, 2016). Therefore, any programme which involves poverty reducing strategies which lays more emphases on agriculture is more likely to be effective than any other sectors with regards to poverty alleviation. Poverty reduction strategies that focus on agriculture directly raise farmers’ incomes by an additional increase in marketable surplus and indirectly generating employment as agriculture is labour-intensive.
Rice (Oryza sativa L) is considered as the third most important staple food in Nigeria in ranking order, maize first followed by wheat. Rice provides ample opportunity for an increase in income, poverty eradication, alleviation and improvement of livelihood among rice producers if value chain and market participation are increased why because local and regional consumption of rice products is anticipated to expand with a rate of increase in population. Based on a report by Price Waterhouse Coopers (PWC, 2017), Nigeria produces 3.7 million tonnes annually. This accounts for a shortfall as 6.4million tonnes of rice are consumed, which explains why Nigeria is the third largest rice importer in the world. According to FAO (2018), Nigeria remained forecast to drive SSA sub-regions rice production in 2019. The FAO forecast that Nigeria will harvest 7.2 million tonnes (4.3 million tonnes, milled bases) in 2018, up 3 percent year-on-year. The Nigeria targets for 2019 rice production output stood at 7.2 million metric tonnes (FAO, 2018). Nigerian rice is grown in about 11 States, with small-holder farmers accounting for 80% of the Country’s annual harvest. These States are; Ebonyi, Kaduna, Niger, Kano, Kaduna, Kebbi, Cross-River, Enugu, Taraba, Borno, Benue (PWC, 2017). Nigeria has all it takes and the potential with suitable agro-ecologies (upland, rain-fed lowland, irrigated lowland, deep water and mangrove swamp) to attain the level self-sufficiency in rice production in the Country (Oikeh et al., 2008; Ugalahi et al., 2016).
A Market is any setting that allows buyers and sellers to exchange any type of goods and services (Heyne et al., 2014). Markets provide a link between the local and global economy and help in facilitating economic efficiency through promoting the exchange of goods and services (FAO, 2009). Rice marketing encompasses all the activities in moving rice from the point of production to where it is needed by final consumers (Bassey et al., 2013). Asogwa and Okwoche (2012) argued that marketing covers all business functions, including production and production decision such that decisions on a variety of crops to grow and sale are marketing decisions. Small holder farmers can be defined as those farmers who own small based plots of land on which they grow at a subsistence level different types of food crops and one or two cash crops depending solemnly on family labour to perform farm operations. It is also often used interchangeably with small scale farmers, ‘resource poor farmers and sometimes peasant farmers (Alene et al., 2008). According to Barret (2008), small holder farmers has to accumulate private asset, access infrastructural facilities and services as the prerequisites conditions to escape from small scale production to produce a marketable surplus.
Farmers’ choice of market outlets and channels is a very important aspect of market participation decision. There are different market channels which include: the informal and formal market channels that provide different price levels and services for sales of produce, which could determine farmers’ choices of the different outlets for marketing their produce (USAID, 2010). Informal markets embrace non-official market transactions between farmers and also from farmers directly to consumers, such as intermediary (brokers), other farmers, friends and relatives or neighbours. In formal markets (traders, wholesalers and Cooperatives) have clear methods of measurements and determining grades, quality control, standards, and safety guidelines for proper regulations. Most of the small-holder farmers are facing difficulties to penetrate and enter the formal markets because of high transactional costs, high risks, missing markets, and on collective operations (Jari and Fraser, 2009). According to Barret (2008), there exists a quite number of potentials for small-holder farmers to be market oriented to derive a livelihood from agriculture. Increase in agricultural markets participation is a key determinant of lifting small-holder rural farming households out of poverty (Heltberg and Tarp, 2002; Balagtas and Coulibaly, 2007). Similarly, the choice of market outlets by small-holder farmers is also playing an important role in increasing incomes of rural households (USAID, 2010). Smallholder farming households that are involved in the rural agricultural sector are the logical focus for enhancing food security and poverty alleviation policies. These policies are for boosting agricultural production and to increase the rates of market participation and market outlet and channel choice as key instruments for improving income and the living standards of rural households. Khadem (2008) pointed out that the way agriculture can boost economic development is by generating sufficient level of market surplus, which plays a crucial part in improving rural capital on the one hand, and on the other help in eradicating rural poverty and regional imbalance.
The agricultural reforms that altered and shifted the production and marketing decisions to small-holder farmers led to the emergence of a large number of rice value chain actors, traders, small scale rice millers, whole-sellers, retailers and large scale private sector rice mills (Barret, 2008). The farmers in the rice anchor borrowers’ schemes program in Nigeria are therefore at liberty to produce and sell their rice at any marketing outlets of their choice. The rationale behind any producer is to sale his product at an outlet with an expected price that maximizes profit, or from a coexistence of marketing outlets, and they choose an outlet which maximizes their expected utility that is more convenience (Alene et al., 2008). Rice is highly demanded in Nigeria, and there is an inadequate supply. It has led to massive importation to meet the shortfall in demand; this has made Nigeria the largest rice importer in Africa (Daramola, 2005). Though Nigeria is also the largest producer of rice in the continent, because of her population, she is also the largest consumer of rice in Africa. The successive government regimes had the desire to reverse this trend which has led to the implementation of various policies concerning rice production and importation in the Country which involves the imposition of tariffs on rice importation and provision of various subsidies to encourage local producers as found in Olorunsanya and Ugbong (2014). Other agricultural programmes to stem the trend were also put in place; which include, the (ARP) Abakaliki Rice Project and the (PIR) Presidential Initiative on Rice. Amidst these laudable government policies and different sets of agricultural programmes, the demand-supply gap for rice and rice products in Nigeria is on the increase, and it widens progressively.
Problems associated with the production and marketing of rice in Nigeria include the constraints which are inherent in Nigeria’s agricultural sector which comprises of low crop yield per hectare of an individual farmer, low income, inadequate infrastructural facilities for increased production poor marketing activities coordination, inadequate storage facilities, and low level of production capacity to satisfy the food demand and fibre that are needed by the populace in Nigerians (Olorunsanya and Ugbong, 2014). Small-holder farmers’ decisions on the quantity of rice output to sell in a particular market outlet are determined and influenced by access to market information, prices of farm produce, and distance to the market location (Omiti et al., 2009). Non-guaranteed access to good markets by farmers for their farm product and acquiring farm inputs is also another major constraint challenging the small-holders farming households (Gyau et al., 2006). Small-holder farmers lack adequate means to overcome the costs to enter the market, such as assets, access to information (Barrett, 2008; Uchezuba et al., 2009). High transactional costs are major constraints involving in marketing by small-holder farmers in developing countries, specifically in Nigeria. No empirical evidence about why producers choose specific market channels and outlets and how transaction costs influence market channel choices. Although several studies have been conducted on production and marketing of rice and other crops in Nigeria, most of the studies focused on the efficiency of farmers in terms of resources use, structure, conduct and performance of the market (Odok, 2000; Ohen et al., 2013). However, it is not yet clear which of the marketing outlets offered better prices for the farmers’ farm produce output. A profit maximizing producer is expected to use a market outlet that will maximize profits and further improve their family welfare. The inadequacy of information concerning factors influencing households rice output and their choices of market outlets is the basic backbone of this study. The study attempt to fill these knowledge gaps. Hence, the purpose of this study is to analyze the factors influencing rice production and choice of marketing outlets among small-holder rural farming households in Federal Capital Territory, Nigeria.
Research questions
This research work provided answers to the following research questions;
- What are the factors influencing the choice of market outlets for rice in the Federal Capital Territory?
- What are the structural intensity and the concentration of participants in the market among small-holder rice farmers?
- What are the factors influencing the total output of rice harvested?
- What are the constraints of rice production and choice of marketing outlets?
Objectives of the study
The broad objective was to examined factors influencing the output of rice produced and choice of marketing outlets among small-holder rural farming households, Abuja Nigeria. The specific goals were to:
- evaluate the factors influencing the choice of market outlet for rice output,
- determine the structural intensity and concentration of market participation among small-holder rice farmers,
- evaluate the factors influencing the total output of rice harvested, and
- identify the constraints of rice production and choice of marketing outlets in the study area.
Hypotheses of the study
The following null hypotheses guided the study;
- H0: socioeconomic factors, marketing variables, and production assets do not have a significant influence on the choice of marketing outlet among small-holder rice farmers
- H0: There is no significant relationship between socioeconomic factors, marketing variables, and production assets and the total output of rice harvested
Materials and Methods
The study area
This study was conducted in FC T, Nigeria. FCT was created and carved out in 1976 from the Kaduna, Niger, Kwara and Plateau States. FCT has a boundary with Kaduna State to North and Kogi State to the South. It is also bounded to the East and West by Nasarawa and Niger States respectively. There are six Area Councils in FCT, namely: Abaji, Bwari, Gwagwalada, Kuje, Kwali and Abuja Municipal Area Councils. Abuja is located within Latitudes 700 20” North of Equator and Longitudes 600 45” and 700 39”. It lies on 416m above sea level, and the city has a tropical climate in winter there is much less rainfall than in summer. The average annual temperature is 26.1 0c. In a year, the average rainfall is 1331 mm and average humidity of 34%. Abuja has a total land area of about 8,000 sq Kilometers with a total population of 776,298 people as at the 2006 census (NPC, 2006). It sustains legumes such as (groundnut and cowpea); grains (maize, sorghum, millet and rice); seeds and nuts (melon seeds and benniseed); fruits and vegetable. Beside crop production, the rural communities also rear livestock such as sheep, goat, cattle and poultry birds at subsistence and likewise commercial level. The main vegetation of the study area is Guinea-savannah (Dawan, 2000).
Sampling technique and sample size
A sampling of the area involved a purposive selection of FCT, due to the concentration of rice farming in the area, and proximity of the area to the base of the researcher. A sampling of the respondents was done using a Multi-stage sampling technique. The first stage, two (2) area councils were selected using simple random sampling technique, the six (6) area councils were written on a piece of paper placed in a box, the papers were well-shuffled, out of the six (6), two (2) area councils were picked and selected. The area chosen councils were: Kuje and Kwali. The second stage, a simple random sampling technique, was used to select three (3) from ten (10) wards from each area council. The third stage, a simple random and proportionate sampling technique, was used. The simple random sample was accomplished using a Table of random numbers. The probability proportionates to the sample size sampling technique as used by Cochran (1977) was adopted. A total sample frame of 5,400 farmers was available, and a total sample size of 207 respondents as calculated from Equation 1 and shown in Table 1 were selected for interview. The required sample size (207) was determined as used by Cochran (1977), Mugenda and Mugenda (2003) is shown below:

Where;
n= Sample Size; p=0.16; q=0.84; Z=1.96 (α=0.05); e= 0.05 Allowable Error.
Table 1: Sampling matrix, sample size and sample frame of the rice farmers.
|
Area councils |
Wards |
No. of rice farmers proportion |
Sample size |
|
|
Kuje |
Kuje Central |
1200 |
0.22 |
45 |
|
Kujekwa |
800 |
0.15 |
31 |
|
|
Yanche |
1000 |
0.18 |
38 |
|
|
Kwali |
Ashara |
900 |
0.17 |
35 |
|
Kilankwa |
900 |
0.17 |
35 |
|
|
Kwali Ward |
600 |
0.11 |
23 |
|
|
Total |
5400 |
1.00 |
207 |
|
Source: Author (2019).
Method of data collection
Primary data were used. Data were collected with the use of questionnaires. The designed questionnaire was pre-tested on selected few farmers in the study area to evaluate the appropriateness of the research design, clarity of purpose, and relevance of the questions to the targeted respondents. The appropriate modifications were made on the pre-tested questionnaire in order to ensure relevant information are captured which is related to the study objectives. The questionnaire was validated, and the appropriate reliability test was carried out. Five (5) enumerators were employed and trained based on the content of the questionnaire and the methods of interviewing process. In each of the Area Councils, two (2) Agricultural Extension Agents who are conversant with the geographic location and socioeconomic characteristics of the people were also recruited, trained and mobilized as enumerators. Thereafter, Primary data were collected through the distribution of structured questionnaire by a team of trained enumerators to 207 sampled small-holder rice farming households in the area.
Method of data analysis
Data collected from the field were collated, edited, coded, and cleaned to ensure consistency, uniformity, and accuracy. Data were entered into computer software for analysis. Both SPSS version 20 and STATA version 12 computer application programs were used to process the data. Descriptive statistics and Inferential statistics or econometric analysis were used for analyzing the collected data from the field. The following analytical tools were used to achieve the stated objectives of the study (i) multinomial logit model; (ii) gini-coefficient; (iii) double-log regression model; (cobb-douglas regression model); (iv) principal component analysis; (v) correlation matrix; (vi) t-test analysis; (vii) Z- test analysis.
Multinomial Logit model
The Multinomial Logit model is stated thus:
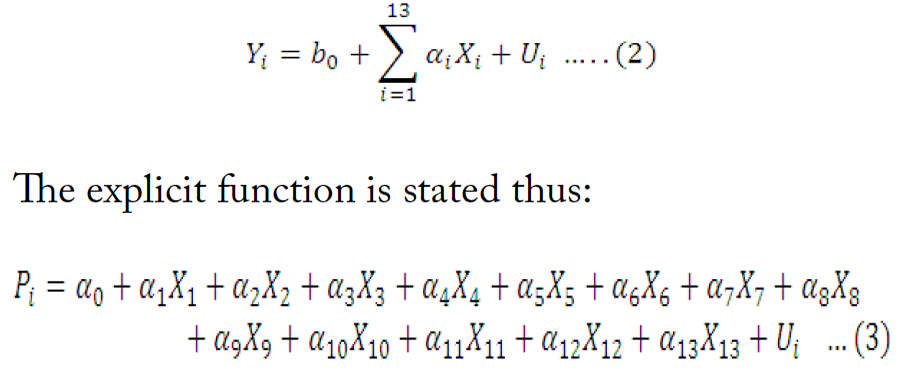
Where,
α0= Constant Term; α1- α13= Regression Coefficients; Yi= Choice (0, None; 1, Farm Gate; 2, Local Market; 3, Urban Market); X1 = Age of Household Head (Years); X2 = Gender Dummy (1, Male; 0, Female); X3 = Educational Level (Number of Years Spent in School); X4= Household Income (Naira); X5 = Price of Output (Naira); X6 = Farm Size (Hectares); X7 = Access to Credit Dummy (1, Yes;0, Otherwise); X8 = Extension Services Dummy (Number of Extension Contacts per Month); X9 = Price Information Dummy (1 Yes;0; Otherwise); X10= Rice Output (Kg); X11=Market Information Dummy (1, Yes, 0, 0therwise); X12 = Market Cooperative Organization Dummy (1, Yes; 0, Otherwise); X13= Marketing Experience (Years); Ui = Error Term; This was used to achieve specific objective (i)
Gini coefficient
The Gini- Coefficient is stated thus:
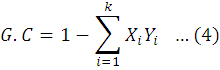
Where,
G.C= Gini-Coefficient (Units); Xi = Proportions of Rice Sellers in the ith Class of Smallholder Farmers, (Kg); Yi = Cumulative Proportion of Rice Sellers in the ith Class of Smallholder Farmers. (Kg); ∑= Summation Sign; k= Observed values; Gini Coefficient (GC) Varies from Zero (0) to 1.

Where;
0 = Implies Perfect Equality in the Distribution; 1= Represent Perfect Inequality in the distribution.
This was used to achieve a specific objective (ii)
Double log regression model (Cobb-Douglas regression model)
The implicit model stated thus;
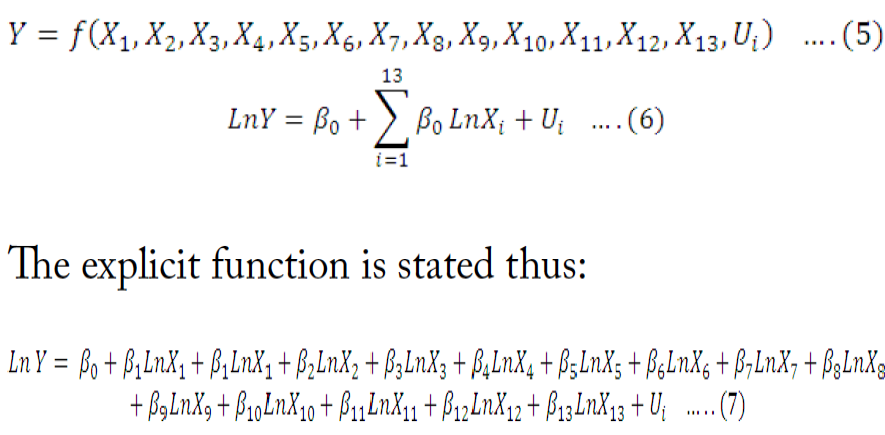
Where;
Yi= Output of Rice (Kg); X1= Age of Farmer (Years); X2 = Farm Size (Hectares); X3 = Quantity of Seed (Kg); X4= Volume of Chemical (Litres); X5= Labour input (Man-days); X6 = Extension Contact (Number of Contact per Month); X7= Quantity of Fertilizer input (Kg); X8= Level of Education (Number of Years Spent in School); X9= Non-Farm Income (Naira); X10= Farming Experience (Years); X11= Expected Price of Rice Output (Naira); X12= Market Information Dummy (1, Yes; 0, Otherwise); X13= Contract Farming Dummy (1, Yes; 0, Otherwise); b1- b13 = Regression Coefficients; b0= Constant Term; Ui= Error Term. This was used to achieve a specific objective (iii)
Principal component analysis
Constraints faced by small-holder rice farming households were subjected to Principal Component Analysis or Factor Analysis. The Principal Component Analysis is stated thus:
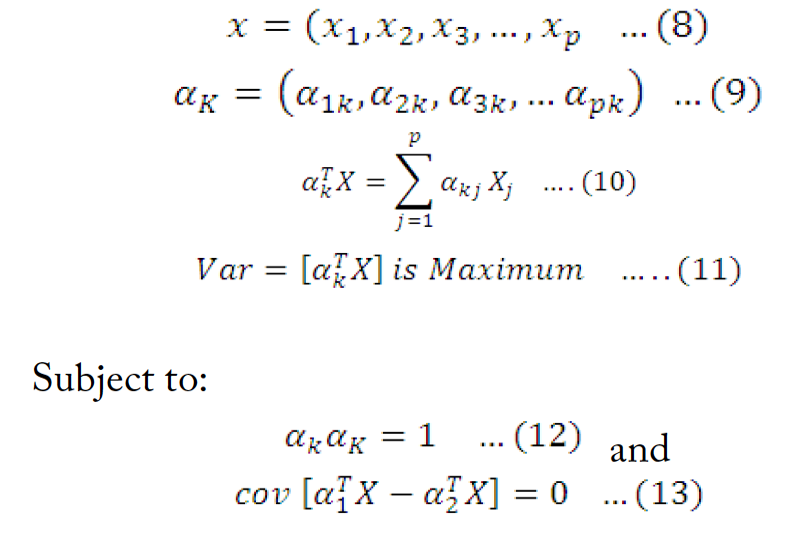
The variance of each of the principal components are:
Where;
X= Vector of p Random Variables; αk= Vector p Components; λk= Eigen Value; T= Transpose; S= Covariance Matrix.
This was used to achieve a specific objective (iv).
Test of hypothesis
t-test: The t-Test was used to test for the significant relationship between economic factors and a total output of rice harvested as inherent in the double-log regression model.
Where;
t= Calculated t- Value; X̅= mean of quantity of paddy rice sold (Kg); µ0= mean of total quantity of paddy rice harvested (Kg); S= standard deviation between the quantity of paddy rice produced and quantity sold (Kg); n= Number of Respondents (Units).
Z- Test
The Z- Test Statistics was used to test for the significant relationship between economic factors and the choice of marketing outlets among small-holder rice farmers as inherent in the Multinomial Logit Model. Z- Test is stated thus:
Where;
Zc= Calculated Z-Value (Units); X̅1= Mean of Rice Output Sold (Kg) X̅2= Mean of Rice Output Harvested (Kg); n1 = Number of Households Respondents that Sold Rice (Units); n2=Number of Households Respondents that do not Sell Rice (Units). S12, S12 = Variance between Households Respondents that Sold and do not sale Rice (Units).
Table 2: Descriptions and measurements of explanatory variables included in multinomial logit model and apriori expectations.
|
Variable code |
Variable |
Measurement of variables |
Expected signs |
|
Dependable variable |
|||
|
Yi |
Household choice of (None,1; Farm gate,1; Local market,2; Urban market, 3); Rice marketing outlets |
||
|
Independent variable |
|||
|
X1 |
Age of household head |
In Years (Continuous) |
+ |
|
X2 |
Sex |
(1, Male; 0, Female) |
+/- |
|
X3 |
Educational level |
Years (Continuous) |
+ |
|
X4 |
Household income |
In Naira (Continuous) |
+ |
|
X5 |
Expected price of output |
In Naira (Continuous) |
+ |
|
X6 |
Farm size |
In Hectares (Continuous) |
+ |
|
X7 |
Access to credit |
(1, Yes; 0, Otherwise) |
+ |
|
X8 |
Extension services |
Number of contact per month (Continuous) |
+ |
|
X9 |
Price information |
Dummy (1, Yes; 0, Otherwise) |
+ |
|
X10 |
Quantity harvested (Rice output) |
(Kg)(Continuous) |
+ |
|
X11 |
Market information |
(1, Yes; 0, otherwise) |
+/- |
|
X12 |
Marketing cooperative organization |
(1, yes; 0, Otherwise) |
+/- |
|
X13 |
Marketing experience |
In years (Continuous) |
+ |
Source: Author (2019).
Table 3: Descriptions and measurements of explanatory variables included in double-log model and apriori expectations.
|
Dependent variables output of rice |
Parameters |
Variables Y |
Expected signs (Apriori) expectations) |
|
Age (Years) |
β1 |
X1 |
± |
|
Farm size (Hectares) |
Β2 |
X2 |
± |
|
Quantity of seed (Kg) |
β3 |
X3 |
± |
|
Volume of chemical (Litres) |
β4 |
X4 |
± |
|
Labour (Man-days) |
β5 |
X5 |
+ |
|
Extension contact |
β6 |
X6 |
+ |
|
Quantity of fertilizer input (Kg) |
β7 |
X7 |
± |
|
Level of education (Years) |
β8 |
X8 |
+ |
|
Non-farm income (Naira) |
β9 |
X9 |
+ |
|
Farming experience (Years) |
β10 |
X10 |
+ |
|
Expected price of rice output (Naira)/Kg |
β11 |
X11 |
+ |
|
Market information(1,Yes; 0, Otherwise) |
β12 |
X12 |
+ |
|
Contract farming(1, Yes; 0, Otherwise) |
β13 |
X13 |
+ |
Source: Author (2019).
Results and Discussion
Factors influencing smallholder rural rice farmers’ choice of marketing
Table 4 gives a summary of the results of the Multinomial Logit model and the estimated marginal effects of the variables in the model. The Prob Chi-square value 0.000 showed that Log-Likelihood ratio statistics of -2218.6673 was highly significant (P<0.01). This model suggests that it had a strong explanatory power. The Pseudo R2 was 0.2605, implying that the explanatory variables included in the model explained about 26% of the variations, in the choice of the market outlets by the small-holder rice farming households. The coefficients of the estimates indicated the direction of the effect of the explanatory variables on the dependent variables. To determine the magnitude of the change on the choice of the available market outlets with respects to a unit change in independent variables, the marginal effects were estimated from Multinomial Logit model, this measure the unit change in probability of choice being made associated with a unit change in explanatory variables Gujaratti and Sageetha (2007). The variables that were included in the model were age of the household head, sex of the farmer, years of education, farm size, access to credit, extension service, price information, a quantity of output harvested, market cooperative organization, and marketing experience.
Age of the household head influences the sale of rice but not significant at farm gate market, the local market and urban market respectively. A unit increase in the age of the household head was associated with the probability of small-holder farmer to sell at farm gate and local market, and urban market. The marginal effect of the age of the household head was 0.024 at the farm gate. This implies that a unit increase by one year in the age of the farmer results in 2.4% probability of selling rice at farm gate, likewise 2.9%, and 2.1% likelihood 2 of selling at local and urban markets respectively. Sex of the household head had a significant influence on the choice of the local market. Male headed household had a lower probability of selling at farm gate market by 61% probability and more likely to sell at the local market by 94% at (P<0.01) probability level, and also less likely to sell at urban market by 65% probability. Male headed household takes more risk; thus, they are capable of searching for distant markets which are more competitive for value addition. This finding is in agreement with Benard (2015), who founded that female household’s head mostly don’t go to distant market places that are far away from home. This finding is also in consonance with findings of Morrison et al. (2007). They found that female farmers are mostly faced with gender specific problems that are timely; this serves as a burden that limits them from accessing the best market for their output.
The educational level of the small holder rural rice farming households head negatively and significantly influences (P<0.10) the choice of local and urban markets, respectively. The marginal effect of the level of education of the household head signifies a unit increase in the level of education of the small-holder farmers, and they are less likely to sell their rice at local and urban markets by 22 % and 16% probability levels respectively. This result is in agreement with the report of Agbola et al. (2010) who reported that farmers who had a higher level of education could have better skills in marketing, especially the formal marketing systems in urban areas. Therefore, an increase in the level of education, exposes a farmer to be profit-oriented and struggle to lower the transactional costs of marketing. The results are also in agreement with Alabi et al. (2016) who reported that it is more likely for the more educated farmers to work off the farm which will enhance their level of productivity that will make them choose a profitable market outlet. Farm size influenced the choice of market outlet negatively for the local market and was significant at (P<0.10). A unit increase in the farm size (ha) results in the likeliness of the small-holder rice farmers to sell at the local market. The marginal effect of farm size at the local market was 0.239. This signifies that a unit increase in the farm size results in the choice of sale at the local market by 24% probability. Farm size is assumed to be proxy to productivity scale. The larger the land size, the larger the production scale and vice versa. This is consistent with Boughton et al. (2007) who posited that private household assets owned by the farmers, determine the level of quantity of output produced and could have a strong association with market entry opportunities by small-holder farmers, it will also help farmers in overcoming entry barriers and thus market access increases.
Table 4: Marginal effects and parameter estimates from multinomial logit on the choice of marketing outlets among smallholder farming households.
|
Variable |
Farm gate local market urban market |
|||||||||||
|
|
Coeff |
δy / δx |
Z |
P>|z| |
Coeff |
δy / δx |
z |
P>|z| |
Coeff |
δy / δx |
z |
P>|z| |
|
Age H Head |
0.0350 |
0.0244 |
1.43 |
0.152 |
0.0025 |
0.0290 |
0.09 |
0.929 |
0.0161 |
.02146 |
0.75 |
0.453 |
|
Sex |
0.0469 |
0.6199 |
0.08 |
0.940 |
-1.6900 |
0.935 *** |
-1.81 |
0.071 |
-0.9631 |
.65311 |
-1.47 |
0.140 |
|
Edu Level |
0.0050 |
0.2084 |
0.02 |
0.981 |
-0.4097 |
0.216 *** |
-1.89 |
0.058 |
-0.1933 |
.1638 *** |
-1.18 |
0.238 |
|
HH Income |
-3.47e-06 |
4.07e-0 |
-0.85 |
0.395 |
-4.41e-06 |
3.89e-1 |
-1.13 |
0.258 |
-4.57e-0 |
3.15e-0 |
-1.45 |
0.147 |
|
Expected Price |
-0.00006 |
0.0001 |
-1.09 |
0.276 |
0.0000 |
0.000 |
0.90 |
0.367 |
-0.00002 |
.00005 |
-0.43 |
0.665 |
|
Farm Size |
0.0859 |
0.116 |
0.74 |
0.460 |
-0.4147 |
0.239 *** |
-1.73 |
0.084 |
0.1104 |
.09167 |
1.20 |
0.228 |
|
Access Credit |
0.0692 |
0.8197 |
0.08 |
0.933 |
1.6141 |
0.805 ** |
2.01 |
0.045 |
0.0921 |
.67195 |
0.14 |
0.891 |
|
Extension Contact |
0.1412 |
0.3157 ** |
2.11 |
0.035 |
-0.3074 |
0.108* |
-2.84 |
0.004 |
0.0748 |
.06051 |
1.24 |
0.216 |
|
Price Infor |
-0.1654 |
1.1131 |
-0.15 |
0.882 |
3.3379 |
1.4475 ** |
2.31 |
0.021 |
-0.7282 |
1.0252 |
-0.71 |
0.478 |
|
Quantity Harvested |
0.0001 |
0.0001* |
1.56 |
0.120 |
0.0001 |
0.00007 |
1.35 |
0.177 |
0.0001 |
.0006 *** |
1.68 |
0.093 |
|
Market Infor |
-0.9161 |
-1.1266 |
-0.81 |
0.416 |
-4.0990 |
1.4591* |
-2.81 |
0.005 |
1.1877 |
1.0608 |
1.12 |
0.263 |
|
Market Org |
-0.5210 |
-0.7747 |
-0.67 |
0.501 |
0.0330 |
0.7529 |
0.04 |
0.965 |
-0.3198 |
.59063 |
-0.54 |
0.588 |
|
Market Exp |
-0.1180 |
-0.065 *** |
-1.81 |
0.070 |
0.1045 |
0.0657 |
1.59 |
0.112 |
-0.1250 |
.0546 ** |
-2.29 |
0.022 |
|
Constant |
-1.6666 |
-1.5554 |
-1.07 |
0.284 |
2.8350 |
1.9772 |
1.43 |
0.152 |
0.3282 |
1.415 |
0.23 |
0.817 |
|
Number Observation= 207 |
||||||||||||
|
LR chi2 (52) 154.07 |
||||||||||||
|
Prob > chi2 0.0000 |
||||||||||||
|
Pseudo R2 0.2605 |
||||||||||||
|
Log-Likelihood -218.66473 |
||||||||||||
Source: Field Survey (2019); * Significant at 1% ;** Significant at 5%; *** significant at 10% probability levels.
Access to credit was significant and positively (P<0.05) influence the small-holder rice farming households’ decision to sell their rice produce at the local market. The marginal effect of the local market was 0.805. This implies that a unit increase in the access to credit by 1 Naira results in the small-holder rural rice farming household’s choice of selling their rice produce at the local market by 80% probability. This could be because the more farmers have access to credit the more ability of the farmer to purchase production inputs which will result in high yield production and marketable surplus. Extension contact positively and significantly influences the choice of farm gate (P<0.05), and the local market (P<0.01). The marginal effect of the sales at the farm gate is 0.3157 and at local market 0.108. This implies that a unit increase in the access to extension contact by one day within a month will results in the rise in choice of rice sales at farm gate and local market by 32% and 10.8 % respectively. Price information was significant (P<0.05) and positively influence the probability of farmer to likely sell their rice produce at the local market. Price information informs the farmer on the prevailing pricing condition. Market information was significant (P<0.01) and negatively influenced the probability of the small-holder rice farmers of the likelihood to sell at the local market. Marketing experience was negatively and significantly (P<0.10) influence the small-holder households rice farmers’ choice of farm gate market outlet, and also positively and significantly (P0.05) influence the choice of urban market outlet. The marginal effects of the marketing experience of farm gate market (-0.0651), local market (0.0657), and urban market (0.0546) imply that a unit increase in marketing experience by one year results in the decrease in the farmers’ choice to sell at the farm gate market by the probability of 6.5%, and increase in the choice of local and urban markets of 6.6% and 5.5% probability levels respectively. This result is consistent with findings of Montshwe (2006), who reported that the farm gate sales reduces farmers’ revenue because the prices are relatively low at the farm gate. Those who are willing to take risk will transport their farm produce to distant places while those that are risk-averse will always end up selling their rice at farm gate market.
Income status of the rural rice farming household heads from the sales of rice
Table 5 revealed that (45.7%) of the sampled respondents earned less than 100,000 Naira from the sales of rice, while 17.3% earned an income of 201-300 thousand Naira per one cropping season. The household that has a higher income from rice sales is considered as wealthy it has a significant positive effect on the small-holder farmers’ decision to participate in rice marketing. This result is consistent with the findings of Akidi et al. (2018) who opined that wealthy farmers have the ability to break market entry barriers; therefore small-holder farming households must reach a minimum income or above the threshold to be able to participate in the rice market.
Table 5: Distributions of income among sampled respondents according to rice sales.
|
Income (N) (000) |
Frequency |
Percentage |
|
<100 |
96 |
45.7 |
|
101-200 |
33 |
15.9 |
|
201-300 |
36 |
17.3 |
|
301-400 |
12 |
5.8 |
|
401-400 |
7 |
3.4 |
|
401-500 |
5 |
2.4 |
|
501-600 |
19 |
9.1 |
|
Mean of income |
238,496 |
|
|
Total |
207 |
100 |
Source: Field Survey (2019).
Structural intensity and concentration of market participation among smallholder rural rice farming households
Table 6 showed the Gini-coefficient computation for the small-holder rural rice-farming households. The Gini-coefficient value calculated is 0.91429. The value lies between 0 and 1. The Gini-coefficient revealed the relative measure of the income distribution. Zero (0) value indicates perfect equality of income, whereas the value one (1) indicates perfect inequality in income, the value of G.C greater than 0.35 is high signifying that there is inequality in the distribution of sales income from the rice output as reported by (Bakare, 2012). The calculated value of Gini-coefficient of 0.914 for the sample of this study showed more inequality in income distribution among the small-holder rice farmers, and this result is in line with the report of Muhammad et al. (2018). This result is also in agreement with the findings of Abah et al. (2015) and Lorenzo (2005) that both reported more inequality in the income distribution of small-holder. The observed inequality in income distributions among small-holder rice farmers is a reflection of inefficiency in the rice market structure.
Table 6: Results of the gini coefficient for rice sales income among smallholder rice farmers in the study area.
|
Range of income (000) Naira |
No of sellers |
Proportion of sellers (X) |
Cumulative proportion |
Cumulative frequency |
Total sales (N) |
Proportion of sales (Y) |
Cumulative proportion |
(XY) |
|
1-100 |
67 |
0.37 |
0.37 |
67 |
1568200 |
0.052 |
0.052 |
0.00192 |
|
101-200 |
33 |
0.18 |
0.55 |
100 |
1928000 |
0.064 |
0.116 |
0.00115 |
|
201-300 |
36 |
0.20 |
0.75 |
136 |
3769500 |
0.125 |
0.241 |
0.025 |
|
301-400 |
12 |
0.07 |
0.82 |
148 |
1712500 |
0.057 |
0.298 |
0.00399 |
|
401-500 |
7 |
0.04 |
0.86 |
155 |
1850000 |
0.061 |
0.359 |
0.00244 |
|
501-600 |
5 |
0.03 |
0.89 |
160 |
2202500 |
0.073 |
0.432 |
0.00219 |
|
>601 |
19 |
0.09 |
0.98 |
179 |
17202500 |
0.569 |
1.001 |
0.05121 |
|
Total |
179 |
1.00 |
30233200 |
1.001 |
0.08571 |
Note: Gini coefficient =1- XY= 1-0.08571=0.91429. Source: Field Survey (2019).
Table 7: Factor influencing quantity of rice output harvested in the study area (Double log functional model).
|
Explanatory variables |
Coefficients |
Standard error |
t |
P>|t| |
|
Age of household head |
-0.0485043 |
1680485 |
-0.29 |
0.773 |
|
Farm size |
0.3054555 |
0.1271881 |
2.40** |
0.017 |
|
Quantity of seed |
0.3446229 |
0.1126842 |
3.06* |
0.003 |
|
Volume of chemical |
0.1545468 |
0.0768134 |
2.01** |
0.046 |
|
Labor input |
0.4166499 |
0.0803019 |
5.19* |
0.000 |
|
Extension contact |
0.0804443 |
0.0708153 |
1.14 |
0.257 |
|
Quantity of fertilizer |
-0.0551429 |
0.0282554 |
-1.95** |
0.052 |
|
Educational level |
0.0508358 |
0.0503535 |
1.01 |
0.314 |
|
Non-farm income |
0.0786851 |
0.1314179 |
0.60 |
0.550 |
|
Farming experience |
-0.0500378 |
0.1296184 |
-0.39 |
0.700 |
|
Expected price of output Market information contract farming |
-0.0704064 0.0567 0.0912 |
0.0209051 0.114361 0.003491 |
-3.37* 0.49 26.12** |
0.001 0.06 0.003 |
|
Constant |
2.07231 |
0 .3398073 |
6.10* |
0.000 |
|
R2 |
0.5114 |
|||
|
Adjusted R2 |
0.4838 |
|||
|
F-Value |
18.55* |
Source: Field Survey (2019); *Significant at 1%; ** Significant at 5%; *** significant at 10% probability levels.
Factors influencing quantity of rice output harvested in the study area (Double log functional production model)
The main objective of defining a functional production model was to determine the quantity of rice output harvested. Table 7 showed the results of the Double-log multiple regressions as the lead equation. The coefficients that are positive and significant include: farm size (P<0.05), a quantity of seed (P<0.01), the volume of chemical (P<0.05), and labour input (P<0.10). This indicates that a unit increase in farm size will result in 30.55% increase in the output of rice. Also, 1% increase in the quantity of seed, the volume of chemical and labour input as a result of more usage of these inputs will result in 34.46%, 15.45%, and 41.66% increase in the quantity of output of rice harvested respectively in the study area. Extension contact coefficient is positive but not significantly influencing the output of rice harvested. This finding is consistent with Usman and Fatima (2014), who indicated that an increase in these inputs would lead to an increase in the total output harvested. The implications of positive and significant coefficients of labour and non-farm income are that the more access to non-farm income by a farmer, there is the tendency for the farmer to be able to pay for hired labour and also expand his farm size which will result in an increase in production and this will tend to increase their profit levels.
More so, the quantity of fertilizer is negatively and significantly (P<0.05) influence the total output of harvest by the small-holder rice farming households. The coefficients of fertilizer (-0.050) indicated that a unit increase in the quantity of fertilizer applied to rice farm would result in a decrease in the quantity of rice output harvested by 5.5%. Furthermore, farming experience and expected price of rice output negatively influence the total quantity of rice output harvested. The coefficients of farming experience and the expected price of output harvested were (-0.05) and (-0.070). This implies that a unit (1N) increase in the expected price of output harvested in a given market results in a 7% decrease in the quantity of rice output harvested at 1% probability level. This result contradicts Nwaobiala and Adesope (2013), who indicated that increases in farming experience lead to a corresponding increase in the output of upland rice. Market information had a positive and non-significant influence on the quantity of rice harvested. The coefficient of market information was (0.0567). This signifies that a unit increase in access to market information results in the non-significant increase in the quantity of rice output harvested. This finding is in line with results of Jagwe (2011), who revealed the source of information remains critical for crop production and market participation. Market information empowers farmers on the prevailing market prices, market opportunities, and market demand. Contract farming was also a significant factor (P<0.01) influencing the quantity of rice output harvested by small-holder farming households. The coefficient of contract farming (0.0912) implies that a unit increase in the access to contract farming results in a 9.12% increase in the quantity of rice output harvested. The coefficient of the multiple determinations (R2) was 0.511. This signifies that the explanatory variables included in the model accounted for about 51% variations in the quantity of rice output harvested in the study area. The F-value 18.55 was highly significant at 1% probability level indicating the goodness of fit. This is in line with the findings of (Ayedun and Adeniyi, 2019).
Constraints faced by smallholder rice farming households regarding decisions for market participation
Table 8 shows the results of the rotated varimax principal component analysis to determine the major constraints militating against the decision of the small-holder farmer’s participation decision in rice marketing. About 17 variables were subjected to principal component analysis (PCA). Five (5) factors were extracted based on the Kaiser Meyer Olkin (KMO) and Bartletts Test of Sphericity computed by SPSS version 20, based on the index which ranges from 0 to 1 the sample is therefore considered suitable for PCA if this index is greater or equal to 0.5. Also, the Bartletts test of Sphericity should be significant at (P<0.05). The results of the analysis show that the data used was adequate for PCA. In deciding the components retained in the model, the components with an eigenvalue greater than one which represents the amount of variance that is accounted for by some given components, a measure of explained variance of greater than one was retained. The first five components have Eigen-values greater than one. The first five components accounted for about 51.5% of the total variability; the PCA transformed the 17-dimensional variable of the information in the original variables. This is consistent with results of Otufale et al. (2018), and Oose (2016) who transformed 17 dimensional factors into a 2 dimensional variable and 8 dimensional behavioural intervention variable was transformed into a 4 dimensional variable using PCA respectively. The rotation method forms the factor pattern matrix, which contains the loadings of every variable on the retained factors; five variables were retained in the analysis. Only variable with factor loadings of approximately 0.5 and above 5% variance was considered in naming the factors. Variables with factor loadings of less than 0.50 were not considered.
Table 8: Result of the varimax rotated components matrix/ factors militating against rice marketing decision among smallholder rural rice farming households in Abuja, Nigeria.
|
Factor variables |
FAC1 |
FAC2 |
FAC3 |
FAC4 |
FAC5 |
|
Lack of improved seed |
-0.079 |
0.369 |
0.522 |
-0.006 |
-0.113 |
|
Transportation problem |
0.267 |
0.455 |
0.028 |
0.128 |
0.050 |
|
Poor storage facility |
0.077 |
0.669 |
0.073 |
0.016 |
-0.037 |
|
Inadequate capital |
-0.330 |
0.639 |
0.104 |
-0.091 |
0.212 |
|
Fire out break |
0.629 |
-0.045 |
-0.091 |
0.244 |
0.188 |
|
Insects outbreak |
0.038 |
-0.084 |
-0.036 |
0.045 |
0.816 |
|
Poor price |
0.199 |
0.132 |
0.479 |
0.019 |
0.302 |
|
Cattle herdsmen |
0.718 |
0.033 |
0.025 |
-0.188 |
-0.021 |
|
High cost of chemical |
-0.116 |
0.065 |
0.762 |
0.023 |
0.233 |
|
Thieves |
0.775 |
-0.045 |
-0.015 |
-0.035 |
0.058 |
|
Erosion problem |
0.148 |
0.182 |
0.127 |
0.799 |
-0.006 |
|
Lack of land/ tractor |
-0.220 |
0.587 |
-0.093 |
0.157 |
0.004 |
|
Inadequate extension officers |
-0.115 |
0.057 |
0.048 |
0.746 |
0.244 |
|
Inadequate fertilizer |
0.022 |
-0.186 |
0.701 |
0.209 |
-0.109 |
|
No good roads |
0.183 |
0.438 |
0.313 |
0.330 |
0.050 |
|
Flood problem |
0.472 |
0.000 |
0.105 |
0.322 |
-0.159 |
|
No provision of credit |
0.023 |
0.170 |
0.187 |
0.133 |
0.624 |
|
Variance |
12.350 |
10.995 |
10.431 |
9.513 |
8.233 |
|
Cumulative variance |
12.350 |
23.345 |
33.775 |
43.288 |
51.521 |
Source: Field Survey (2019). Extraction Method: Principal component analysis; Rotation Method: Varimax with Kaiser Normalization.
After rotation, the first factor accounted for 12.350% of the variance, the second factor accounted for 10.995% of the variance, the third factor accounted for 10.431% of the variance, the fourth factor accounted for 9.513% of the variance. The fifth factor accounted for 8.233% of the variance in the 17 components or variables in the model. The loadings under factor 1, shows the constraint variables militating against the rice marketing decisions among small-holder farming households, this includes: fire outbreak (0.629), thieves (0.775), cattle herdsmen attack (0.718), and flood problem (0.472). Fire outbreak consumed farmers crop as a result of bush burning, according to the farmers, Fulani herdsmen used to destroy their rice farm even before the harvest, this indicates that farmers are not sure of the safety of their produce thereby discouraged from producing a marketable surplus that will enable them to participate in the rice market, flooding was another major problem, this could wash away farm produce thereby, leaving the farmer with or no yield at all. Variables that loaded under factor 2 include: transportation problem (0.455), poor storage facility (0.669) inadequate capital (0.639), and lack of land/Tractor (0.587). transportation of rice seed to farm and harvested crop from farm gate to market was a constraint to the rice farmers in the study area. This is in line with results of Aboki and Yuguda (2013) who discovered that the high cost of transportation was as a result of the bad nature of roads. The variables that loaded under factor 3 include: lack of improved seed (0.522), poor price (0.479), high cost of chemical (0.799), and inadequate fertilizer (0.701). This result agreed with findings of Akidi et al. (2018) who observed that lack of input, financial constraint, poor storage facilities, poor price, and lack of implement were the major constraints to production and marketing among farmers. The poor market price could be due to lack of capital or poor quality of the product produced. Variables that loaded under factor 4 include: erosion problem (0.799), inadequate extension officers (0.746). This result is in agreement with findings of Amusa (2010) who discovered that inadequate agricultural extension services as a major constraint among small-holder farming households in Ekiti State, Nigeria. The loadings under factor 5 include insect outbreak (0.816), and no Provision of credit (0.624). The results are in consonance with findings of Bashir et al. (2018) who reported that inadequate funds and disease outbreak are the most very severe constraints encountered by farmers.
The scree plot is another method used for factor extraction of factors to be retained. This one is a subjective method which requires the researchers’ judgements. According to this criterion, the significant factors are shown like a cliff, having a big slope while trivial factors are disposed at the cliff (Figure 1).
Hypotheses tested
The null hypothesis that states that socioeconomic factors, marketing variables, and production assets have no significant influence on the choice of marketing outlets among small-holder rice farmers was tested. The Multinomial Logit (MNL) result shows that age of the small-holder farming households head, sex of the small-holder farming households head, years of education, farm size, expected price, access to credit facilities, extension contact, price information, a quantity of output harvested, market information, and marketing experience were the significant factors influencing market outlet choice. Therefore, based on these findings, the null hypothesis was rejected, and the alternative hypothesis was accepted.
The null hypothesis that states there is no significant relationship between socioeconomic factors, marketing variables, and production assets and the total output of rice harvested was tested. The Double Log regression model revealed that the coefficients of farm size, a quantity of seed, the volume of chemical, labour input, a quantity of fertilizer, expected price, market information, and contract farming were significant factors influencing the output of rice harvested. Therefore, the alternative hypothesis was accepted, while the null hypothesis was rejected.
Conclusions and Recommendations
Based on the research findings, the following conclusion was made: The significant factors that influence the choice of market outlets were: sex of the household head, educational level of the sampled respondents, access to credit, extension services, price information, and market information. The level of inequality of income distribution is high among small-holder rice farming households. Quantity of rice output harvested was significantly influenced by farm size, labour input, a quantity of seed planted, and contract farming. Smallholder rice farming households were faced with the following challenges in rice production and market participation: Fire outbreak, thieves, cattle herdsmen attack and flood, transportation problem, poor storage facility, inadequate capital, lack of land/ tractor, means of transportation of rice seed to farm and harvested crop from farm gate to house and market; poor price, high cost of chemical, inadequate fertilizer, lack of improved seed, inadequate extension officers, and lack of credit facilities. Therefore, the study recommends that: New innovations and technologies that target increased agricultural productivity should be promoted. Also, the government should consider advances in knowledge through training in farm production and farm business management for increased productivity, and market participation through provision of adequate extension officers to train farmers on modern agricultural production. Input supply market development is highly recommended to ensure improved seeds and inorganic fertilizers are more accessible and affordable to small-holder household’s rice farmers. Improving access to market information through appropriate sources could lower the transaction costs associated with searching for trading partners, contract farming and marketing should be encouraged, which will enhance market participation. Policies geared towards enabling farmers to access and utilize telecommunication technologies for trade purposes should be supported. Therefore, the locations of market and commodity price information should be broadcasted over the radio or made available through mobile phones. An example of such is e-wallet in Nigeria, Trade Net, in Ghana. Trade Net allows farmers to sign-up for SMS (short message service) this initiative should be taken to rural farming households. Access to markets by the provision of better rural road infrastructure could be a vital policy intervention. Improving rural road infrastructure would also lead to more traders penetrating the rural areas, and this will increase competition and could benefit small-holder farmers through better prices and enabling them to take advantage of profitable market outlets. Addition non-farm income from other sources will help reduce inequality among small-holder rural farming households, Policies and interventions which support small-holders’ asset building and wealth creation should be encouraged. Policies to improve access to assets will enhance small-holders’ productivity and capacity to produce surpluses that will result in better participation in the market by the rice farmers and profitable market outlets choice. Such policies could involve designing appropriate property right regimes that enable small-holders to acquire, own and transfer production assets such as farmland, seeds, livestock, fertilizers, equipments and technology. Increasing rice production will have a positive impact on rice marketed surplus and market participation in Nigeria. Therefore, government policies that are directed towards increasing rice production need to be sustained and improved. Farmers need to be introduced to improved rice varieties and better production technologies, and they need to get access to credit facilities in order to be able to afford costly technologies. Collective actions through organizations are also a critical factor in enabling farmers’ access to rice production assets. However, there is a need for policies and programs that support inclusiveness so that small-holder farmers will be involved in more profitable marketing outlets. This can be done through supporting the development and strengthening of functional, effective and sustainable farmer production and marketing groups, which could reduce transaction costs, improve collective action, and rural household welfare. Moreover, providing institutional support from different stakeholders from the agricultural sector (like NGOs and government organizations) could have a positive impact and improve market participation among small-holder farmers in rural areas. This can be achieved via public-private partnerships.
Novelty Statement
Determining the factors influencing output of rice produce and the choice of marketing outlets among smallholder farming households and the use of Gini coefficient, multinomial logit and principal components contributed and added more knowledge to the research article and the academia.
Author’s Contribution
All authors jointly contributed in designing the research article, data collection, data analyses, interpretation of results and writing of research manuscript.
Conflict of interest
The authors have declared no conflict of interest.
References
Abah, D.A., G.A. Abu and P.I. Ater. 2015. Analysis of the structure and conduct of paddy rice marketing in Benue State, Nigeria. Am. J. Market. Res., 1(2): 70-78.
Aboki, E. and R. Yuguda. 2013. Determinants of profitability in cowpea production in takum local Government Area of Taraba State, Nigeria. J. Agric. Sci., 4(1): 33-37. https://doi.org/10.1080/09766898.2013.11884699
Agbogo, E.A., A.B. Udouso and E.N. Tiku. 2013. Analysis of factors affecting rice consumption in cross River State, Nigeria. J. Agric. Vet. Sci., 4(2): 34-40.
Agbola, P.O., T. Adenaike and D.A. Babalola. 2010. Determinants of farmer’s access to output markets and the effects on income. A case study of ikenne local government area, Nigeria. J. Life Phys. Sci., 3(2): 33-39.
Akidi, I.L., K.W. Stephen and M. Basil. 2018. Determinants of smallholder indigenous chicken farmers’ market participation decisions and value of sales in Gulu District. J. Dev. Agric. Econ., 10(8): 271-278. https://doi.org/10.5897/JDAE2018.0941
Alabi, O.O., A.F. Lawal and A.O. Oladele. 2016. Assessment of an electronic wallet system and determinants of cassava farmers’ participation in off-farm activities in Abuja, Nigeria. J. Agric. Sci., 61(4): 399-410. https://doi.org/10.2298/JAS1604399A
Alene, A.D., V.M. Manyong, G. Omanya, H.D. Mignouma, M. Bokanga and G. Odhiambo. 2008. Smallholder market participation under transactions costs: Maize supply and fertilizer demand in Kenya. J. Food Policy, 33: 318–328. https://doi.org/10.1016/j.foodpol.2007.12.001
Amusa, T.A., 2010. Contribution of women to household farming decisions among cocoa-based agroforestry households in Ekiti State, Nigeria. Unpublished MSc Disertation, Department of Agric. Economics, University of Nigeria, Nsuka.
Asogwa, B.C. and V.A. Okoche. 2012. Marketing of agricultural produce among rural farm households in Nigeria; The Case of Sorghum Marketing in Benue State. Int. J. Bus. Soc. Sci., 3(13): 269-277.
Ayedun, B. and A. Adeniyi. 2019. Efficiency in rice production in nigeria acta scientific. Nutr. Health, 3(7): 86-94. https://doi.org/10.31080/ASNH.2019.03.0406
Bakare, A.S., 2012. Measuring the income inequality in Nigeria: The lorenz curve and gini coefficient approach. Am. J. Agric. Sci., 2(1): 47-52. https://doi.org/10.5923/j.economics.20120201.06
Balagtas, J.V. and J.Y. Coulibaly. 2007. Dairy market participation with endogenous livestock ownership: Evidence from cote d’Ivoire. Pap. Present. Am. Agric. Econ. Assoc. Ann. Meet., Portland, OR, July 29-August 1, 2007
Barrett, C.B., 2008. Displaced distortions: Financial market failures and seemingly inefficient resource allocation in low-income rural communities. In: Bulte, E., Ruben, R. (Eds.), development economics between markets and institutions: Incentives for growth, food security and sustainable use of the environment. Wageningen Academic Publishers.
Barrett, C.B., 2008. Displaced distortions: Financial market failures and seemingly inefficient resource allocation in low-income rural communities. In: Bulte, E., Ruben, R. (Eds.), development economics between markets and institutions: incentives for growth, food security and sustainable use of the environment. Wageningen Academic Publishers.
Bashir, M.B., A.A. Ndaghu, S.H.G. Nakwe, A.W. Abdulazeez and R.T. Samuel. 2018. Adoption of cowpea production technologies among farmers in Taraba State, Nigeria. IORS J. Agric. Vet. Ser. (IOSR-JAVS) 11(3): 37-46.
Bassey, E.N., U.E. Okon and O.W. Ibok. 2013. Intermarket performance and pricing efficiency of imported rice marketing in South-South Nigeria. Case Akwa-Ibom State Traders. Sci. Educ. Center North Am., 1(2): 53-63. https://doi.org/10.12735/as.v1i2p53
Benard, O.A., 2015. Determinants of smallholder farmers market participation. A case study of rice marketing in ahero irrigation scheme MSc Agric. Appl. Econ. Egerton University. pp. 45.
Boughton, D., D. Mather, C.B. Barret, R. Benfica, D. Abdula, D. Tschirley and B. Cunguara. 2007. Market participation by rural households in a low-income country: An asset-based approach applied to mozambique. J. Faith Econ., 50: 64–101.
Cochran, W.G. 1977. Sampling techniques. 3rd Edition, John Willey & Sons, New York.
Daramola, D. 2005. The contribution of individual and group social networks to knowledge diffusion among farmers in Semi-arid Kenya. Conf. Int. Agric. Res. Dev. Stuttgart-Hohenheim, Germany pp. 1-10.
Dawan, P.D. 2000. Brief history of the creation of Federal Capital Territory (FCT). In: Geography of Abuja Federal Capital Territory, Dawan, P.D. (Ed.). Famous/Asanlu Publishers, Minna, Niger State, Nigeria, pp. 1-8.
Edoka, M.H., S.O. Adejoh and M.K. Ibrahim. 2009. The role of women in rice production in Idah local government area of Kogi State, Nigeria. Proc. 43rd Annu. Conf. Agric. Soc. Nigeria, October 19-23, 2009, Abuja, pp. 648.
Food and Agriculture Organization (FAO), 2018. Rice market monitor, April 2018, Volume XX1-Issue No.1
Food and Agriculture Organization FAO, 2009. The state of food and agriculture available at http://www.fao.org/es/ESC/en/15/70/highlight 71.html
Gujarati, D.N. and N. Sageetha. 2007. Basics econometrics (4th edition). Tata Mac Graw-Hill Publishing company limited, New Delhi
Gyau, A., M. Mbugua and J. Oduol. 2006. Determinants of participation and intensity of participation in collective action: Evidence from smallholder avocado farmers in Kenya. J. Chain Netw. Sci., 16: 147–156. https://doi.org/10.3920/JCNS2015.0011
Heltberg, R. and F. Tarp. 2002. Agricultural supply response and poverty in mozambique. Food Policy, 27(1): 103-124. https://doi.org/10.1016/S0306-9192(02)00006-4
Heyne, P., P.J. Boettke and D.L. Prychitko. 2014. The economic way of thinking (13th ed.). Pearson series. pp. 130–132.
Jagwe, J.N., 2011. Impact of transaction costs on the participation of small-holder farmers and intermediaries in the banana markets of burundi, democratic republic of congo and rwanda. A PhD thesis (Agricultural Economics) submitted to the University of Pretoria.
Jari, B. and C.G. Fraser. 2009. An analysis of institutional and technical factors influencing agricultural marketing amongst smallholder farmers in the Kat River Valley, Eastern Cape, South Africa. Afr. J. Agric. Res., 4(11): 1129-1137.
Khadem, N.U., 2008. Marketed surplus magnitude of a backward regional economy: A cross-sectional study. IUP J. Agric. Econ., 2: 48-63.
Lorenzo, G.B., 2005. Charting income inequality: The lorenz curve. Accessed on 17/10/2019 from http://www.fao.org/docs/up/easypol/charting_inequality_009en.pdf
Mgbenka, R.N. and E.N. Mbah. 2016. A review of smallholder farming in Nigeria: Need for transformation. Int. J. Agric. Ext. Rural Dev. Stud., 3(2): pp. 43–54. http://www.eajournals.org/wpcontent/uploads/A-Review-of-Smallholder-Farming-In-Nigeria.pdf
Montshwe, B.D., 2006. Factors affecting participation in mainstream cattle markets by small-scale cattle farmers in South Africa. MSc. thesis, University of Free State, Bloemfontein.
Morrison, A., Raju, D. and Sinba, N., 2007. Gender equality, poverty and economic growth. The World Bank, Policy Research. Working Paper 4349. https://doi.org/10.1596/1813-9450-4349
Mugenda, O.M. and Mugenda, A.G. 2003. Research methods: Quantitative and qualitative approaches. Acts Press, Nairobi, Kenya
Muhammad, A.I., A. Azhar, U. Raza, I.A. Umar, S. Ali and A. Shoaib. 2018. Effect of non-farm income on poverty and income inequality from Punjab Province Pakistan. Sarhad J. Agric., 34(2): 233-239. https://doi.org/10.17582/journal.sja/2018/34.2.233.239
Nwaojiala, C.U. and O.M. Adesope. 2013. Economic analysis of small holder rice production system in Ebonyi State South East, Nigeria. Russ. J. Agric. Socio Econ. Sci., 23(11): 3-10. https://doi.org/10.18551/rjoas.2013-11.01
NPC, 2006. Population and Housing Census Enumerators Manual. Federal Republic of Nigeria, National Population Commission, Nigeria, pp. 1-16.
Odok, G.N., 2000. The structure, conduct and performance of cocoa in Ikom, Cross River state Nigeria. Unpublished M.Sc thesis, University of Calabar, Nigeria. pp. 55-70.
Ohen, S.B., E.A. Etuk and J.A. Onoja. 2013. Analysis of market participation by rice farmers in Southern Nigeria. J. Econ. Sustainable Dev. 4(7): 2222-2855.
Oikeh, S.O., F.E. Nwilene, T.A. Agunbiade, O. Oladimeji, O. Ajayi, S. Mande, H. Tsunematsu and H. Samejima. 2008. Growing upland rice: A production handbook; Africa rice center: Cotonou, Benin, pp. 3.
Olorunsanya, E.O. and U.U. Josephine. 2014. Rice marketing as a means of poverty alleviation in Niger State, Nigeria. Eniola Oluwatoyin Agric. Trop. Subtropica, 47(4): 137-141. https://doi.org/10.2478/ats-2014-0019
Omiti, J.M., D.J. Otieno, T.O. Nyanamba and E. McCullough. 2009. Factors influencing the intensity of market participation by smallholder farmers; A case study of rural and peri-urban areas of Kenya. Afr. J. Agric. Resour. Econ., 3(71): 57–82.
Oose, M.O., 2016. Acceptability of short message services for agricultural information dissemination among artisanal fishers in coastal areas of South-West, Nigeria. PhD thesis, Agric. Ext. Rural Dev. Fed. Univ. Agric. Abeokuta. pp. 327.
Otufale, G.A. and M.O. Oose. 2018. Effect of climate change on rice production in ogun state, Nigeria. Application of principal components analysis. Nigerian J. Agric. Dev. Econ. 8(2): 5-9.
Price Waterhouse Cooper, 2017. Boosting rice production in nigeria through mechanization. A report published by PWC.
Uchezuba, I.D., E. Moshabele and D. Digopo. 2009. Logistical estimation of the probability of mainstream market participation among small-scale livestock farmers: A case study of the Northern Cape province. Agrekon, 48(2):171-183.
Ugalahi, B.U., S.O. Adeoye and M.U. Agbonlahor. 2016. Irrigation potentials and rice self-sufficiency in Nigeria: Review. Afr. J. Agric. Res., 11(5): 298-309. https://doi.org/10.5897/AJAR2015.10284
Usman, S.M. and K.M. Fatima. 2014. Profitability analysis of cowpea production in rural areas of Zaria local government area of Kaduna state, Nigeria. Int. J. Develop. Sustain., 3: 1919-1926.
USAID, 2010. Staple foods value chain analysis country report Tanzania. Available at http://www.competeafrica.org/Files/Tanzania_Staple_Foods_Value_Chain_Analysis_ Study [Accessed 15 January 2013].
To share on other social networks, click on any share button. What are these?


