
Factors Affecting Smallholder Farmers Participations in Cluster Crop Production: Evidence from Selected Districts of West Shewa Zone, Oromia National Regional State, Ethiopia


Research Article
Factors Affecting Smallholder Farmers Participations in Cluster Crop Production: Evidence from Selected Districts of West Shewa Zone, Oromia National Regional State, Ethiopia
Chala Hailu Hussen1* and Fikiru Temesgen Geleta2
1Department of Agricultural Economics, School of Agricultural Economics and Extension, College of Agriculture and Veterinary Science, Ambo University, Ambo, Ethiopia. P.O. Box 19; 2Department of Agribusiness and Value Chain Management, School of Agricultural Economics and Extension, College of Agriculture and Veterinary Science, Ambo University, Ambo, Ethiopia. P.O. Box 19.
Abstract | The modern conception of agribusiness development clusters emerged in the 1960s around traditional export commodities such as coffee, cotton and cocoa. Thus, this study was initiated to describe socio-economic factors of cluster crop producers, challenges of cluster crop production, and examine factors affecting smallholder farmers’ participation decision in cluster crop production. By employing two-stage sampling techniques, data was collected from 160 farm households of selected Western Shewa zone districts, namely Ejersa-Lafo, and Bako-Tibe. Data was emanated from primary sources, which administrated by semi-structured questionnaire using personnel interview. On top of this, the focus group discussion was carried out on particular topics to supplement primary data source discussions. Both descriptive statistics and a probit regression model was employed for analysis. The descriptive statistics revealed that 127 sampled farmers participated in cluster crop production, while the remaining 33 were not. On the other hand, the result of probit model regression had shown that household-related factors such as being a male, economic dependency ratio, farmer experience, marketable surplus supply, and seed multiplication objectives were positively affecting the probability of participation decision while wealth variable like owning a large number of livestock was negatively affecting participation decision. Further, institutional service factors like the acquisition of awareness and frequency of extension contact positively affecting participation decision; however, obtaining training had a negative effect. Generally, farm household’s internal factors and external factors affecting cluster crop production. Therefore, intensive support for program implementation can be expected from the government by augmentation of stakeholder coordination to aspire to agribusiness growth.
Received | December 03, 2020; Accepted | March 21, 2021; Published | June 24, 2021
*Correspondence | Chala Hailu Hussen, Department of Agricultural Economics, School of Agricultural Economics and Extension, College of Agriculture and Veterinary Science, Ambo University, Ambo, Ethiopia. P.O. Box 19; Email: Caalaa2012@gmail.com
Citation | Hussen, C.H. and F.T. Geleta. 2021. Factors affecting smallholder farmers participations’ in cluster crop production: Evidence from selected districts of West Shewa Zone, Oromia National Regional State, Ethiopia. Sarhad Journal of Agriculture, 37(3): 818-829.
DOI | https://dx.doi.org/10.17582/journal.sja/2021/37.3.818.829
Keywords | Cluster production, Farm households, Participation, Probit model, Study areas
Introduction
The modern conception of agribusiness development clusters emerged in the 1960s around traditional export commodities such as coffee, cotton and cocoa, but the emphasis has shifted over time to non-traditional agricultural exports and horticulture crops such as fruits, berries, vegetables and cut flowers. This is because agriculture is the greatest potential for sustainable growth in many developing countries. And apparently, it is the sector where poverty is most widespread and found in its worst forms. Still cycle of stagnant growth in agriculture is related to low-risk aversion ability and low investment of small-scale farmers and the rural communities in general (ITC, 2006a). As small farmers move into commercial production, they tend to specialize in higher-value crops, and incomes grow as the requirement for inputs increases (Anderson and Reynolds, 2009).
In the Ethiopian economy context, agriculture is the backbone, and the sector determines all other sectors’ growth. On average, crop production makes up 60 percent of the sector’s outputs, whereas livestock accounts for 27 percent and others contribute 13 percent of the total agricultural value-added. The sector is dominated by small-scale farmers who practice rain-fed mixed farming by employing traditional technology, adopting a low input and low output production system (CSA, 2016).
Tough initiation was taken under GTP II (Growth Transformation Programme) to move forward from the conventional farming system. The anchor initiative introduces Agricultural Commercialization Clusters (ACC) to integrate the systematic solutions in the main pillars of the Transformation Agenda within specific high-potential geographies and strategic commodities. Accordingly, in the Oromia region, there are nine clusters across 114 woreda’s and ten commodities: namely, maize, tef, bread wheat, durum wheat, malt barley, horticulture, haricot bean, beef, dairy, and apiculture. These nine zones are West Shewa, Horro Guduru Wellega, Arsi, Bale, and East Shewa. However, major emphasis was given to five clusters of zones and on particular commodities: maize, tef, durum wheat, bread wheat and malt barley based on location and commodities advantageous to the national economy. The program was aimed to generate annual revenues of 59, 81, 221, 16, and 127 million USD from the sale of maize, malt barley, bread wheat, durum wheat, and tef by 2020, respectively (ATA, 2017). Furthermore, it is vital to create a linkage of these commodities to industrial raw material and pooling farm resource prior to increasing yield. Therefore, many endeavors are undertaken to orchestrate cluster production in realizing the objectives that paves the farm economy’s change from subsistence to more commercial oriented nature.
Statement of the problem
A recent report marked by several authors suggested that the potential role of agribusiness investment clusters, and special economic zones (SEZs), which stimulates growth in farmer incomes, foster sustainable increases in crop yields, support market chain expansion, and contribute to other development goals (Zhang and Wu, 2009; Reardon et al., 2009; Gálvez and Nogales, 2010; World Bank, 2012). However, the evidence base for evaluating agribusiness based initiatives’ potential to contribute to sustainable, pro-poor, smallholder-oriented economic growth remains limited.
The agricultural cluster provides enormous benefits from a smallholder farmer perspective. As Porter (1998) described, “a cluster offers advantages in efficiency, effectiveness and flexibility through linking companies and institutions into a robust organizational form. However, the lack of economies of scale is commonly cited as a barrier to agricultural development in many developing countries (Holtzman et al., 1997). Individual small-scale farmers’ lack of economies of scale because of not cluster participants’ though it lowers input costs (Reardon et al., 2009). In addition, the cluster creates linkages through producers’ organizations to increase farmers’ bargaining power, information sharing and further reduce transaction costs between farmers and buyers (Roy and Thorat, 2008).
Despite these facts, promoting cluster farming in developing countries is not easy, and it is likely to be quite a challenge. The existing literature showed that clusters in developing countries, particularly in the agricultural sector, are usually more dominated by smaller-scale firms that are organized in a more informal manner, have weaker linkages among actors, face more difficulties in achieving a critical mass of firms and have been specialized in lower-value niches, although they are now increasingly entering higher-value markets and an indication of support requirement (Segaert et al., 2004; FAO, 2010).
However, clusters in industrialized economies appear mainly on the higher end of the market. This is a changing reality, at least in the agricultural sector. For example, exports of high-value products (horticulture, livestock, cut flowers and organic products) now make up almost half of all developing country exports, far more than the 21% for traditional tropical commodities such as coffee, cacao, tea or cotton (World Bank, 2007). Authors such as Dadan et al. (2015) tried to investigate in West Java province of Indonesia about the agro-cluster effect on rural poverty. They described that cluster farming meant to increase employment opportunity and specialization of output. While, some authors identified that farm diversification was a requirement for increasing farm production and mitigating risk related to farm business (Alphonse et al., 2017). On the other hand, farm specialization enables farmers to concentrate their management skills, capital resources, and specialized knowledge on producing a small number of commodities. Thus, it allows farmers to pursue those commodities they have the greatest relative advantage or the least relative disadvantage given the physical and biological factors and economic forces that limit their enterprise possibilities (Castle et al., 1987).
Generally, existing literature across the world described the importance, constraints and roles of cluster farming and, particularly in Ethiopia; still, there is no documented research conducted on cluster crop production exceptional annual report documented by ATA (Ethiopian Agricultural Transformation Agency). Thus, in Ethiopia, the program is at the pioneering stage, so it is important to look at the participation decision that helps determine the strategy’s continual implementation. Therefore, this study aimed to estimate factors affecting smallholder farmers’ decision to participate in cluster farming and identify existing cluster crop production challenges.
Materials and Methods
Description
The study was conducted in the Bako-Tibe and Ejersa Lafo districts of West Shewa zone, Oromia National Regional State, Ethiopia (see Figure 1). Bako-Tibe and Ejersa Lafo districts are located at a distance of 251 and 65 kilometers (km) from Addis Ababa and 125 and 47 Km away from the zonal capital Ambo. Bako district comprises 28 rural kebeles where clustered crop production is conducting in all kebeles on 750 hectares of land, and 1500 farm households participated. The mean annual rainfall and a temperature range between 1200-1300 mm and 13.2oC-27.8oC, respectively. Mixed farming is commonly practised, and major crops grown are maize, teff, sorghum, Niger seed, haricot bean, wheat, barley, horticultural crops (BWAO, 2020).
While Ejersa Lafo has 17 rural kebeles and three semi-urban kebeles, the district land use types showed 70.19% arable land, 18.5 % grazing land, 9.4% forest land and 1.9% others. The mean average temperature of the area was 19.670c, and the minimum and maximum temperature 5.40c and 26.410c, respectively. The mean annual rainfall is between 750-1170 mm. The major crops produced are teff, wheat, barley, maize and sorghum, chickpea, horticultural crops, vegetables, root crops, pulses, and oilseeds (ELAO, 2020) (see Figure 1).
Methods of sampling techniques and sample size
Cluster farming is a new practice endorsed by the Ethiopian Agricultural Transformation Agency (ATA). Hence, West Shewa is one of the zones which practice cluster farming. The zone has 22 districts and among these 10 districts practising cluster farming on selected commodities of teff, wheat, maize, barley, bean, and chickpea. The first stage clustered districts were selected for being it covers a large economic scale of production in the cluster. These are Ejersa Lafo, and Bako-Tibe districts. Next stage, 7 sampled kebeles will be selected from those who adopted cluster farming using simple random sampling 4 from Ejersa Lafo and 3 from Bako-Tibe districts. At the third stage, sample households were selected using probability proportional to sample size (PPS) that totaled 160 households (see Table 1), and the sample size was determined using the Yamane formula (Yamane, 1967). Where n= sample size, N is the population from the two districts, and e is the margin of error that is 7.7%.
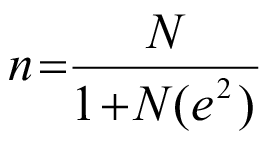 ...(1)
Table 1: Summary of the sampled Kebeles.
|
District |
Kebele |
Total No. of HH's |
%age |
Sample size using PPS |
|
Ejersa Lafo |
Chalalaka Robe |
600 |
0.04 |
24 |
|
Bite E/Lafto |
550 |
0.04 |
21 |
|
|
Jemjemi L/Batu |
500 |
0.04 |
21 |
|
|
Ficha Godeti |
850 |
0.04 |
34 |
|
|
Total |
1950 |
100 |
||
|
Bako Tibbe |
Dambi Dima |
350 |
0.04 |
14 |
|
Dambi Gobu |
500 |
0.04 |
20 |
|
|
Gajo |
650 |
0.04 |
26 |
|
|
Total |
1500 |
60 |
||
|
Total |
|
160 |
||
Source: District Agricultural Office Annual Report document (2020). Hint: ‘Kebele’ is the lowest administrative level in the governing system of Ethiopia.
Data types, sources and collection tools
In this study, both primary and focus group discussion tools were used for data collection. To secure primary data, a semi-structured questionnaire was used and administrated by personnel interview. The questionnaire was designed to capture household socio-economic and demographic characteristics, institutional factors, and other household-related factors. Typically, the questionnaire format comprises both qualitative and quantitative questions. Before data collection, the questionnaire was tested. This led to a further revision of the questionnaire to make sure that important factors addressed well. On top of this, enumerators had trained on the study’s objectives, the questionnaire’s content, and approach to handling the respondents. Furthermore, a focus group discussion was used to supplement information collected from respondents through an interview. Secondary information was gathered on the number of farm households participated on cluster farm, land size, types of crops grown, and others from Bako-Tibe and Ejersa Lefo District Agricultural Offices to write up the methodology part this study.
Method of data analysis
Descriptive and inferential statistics analysis: In this study, descriptive statistics were used to describe the socio-economic, socio-demographic, and relevant characteristics of sample households using mean, standard deviation, percentages, minimum, and maximum. Correspondingly, inferential statistics were also employed to compare the proportion and mean of the difference between cluster farmer participants and non-participants in terms of the dummy and continuous variables using the chi-2 test and t-test. The result was presented using the table, pie chart and graph.
Econometric model: The probit regression model is employed to estimate factors affecting smallholder farmers’ decision to participate in cluster crop production. It was explained by socio-economic/demographic, physical variables, and institutional variables. This model is appropriate when the dependent variable is qualitative and dichotomous, which is the case in this study. Let Yi be the dichotomous variable that assigned the value ‘1’ if the particular farmer participated in cluster crop production; otherwise, it assigned the value ‘0’ for not decide to participate. The model is based on utility theory highlighting that the household maximizes output compared to the input cost, which depends on the utility derived from it. Then the Probit model is described as follows:
Yi*=X′iβ+εi, εi~[0, 1], (2)
Yi=1, if y*i>0, otherwise Yi=0, (3)
Where; Yi* is a latent variable representing farmers’ decisions to participate in cluster farming, Xi is a vector of explanatory variables, βa vector of parameters associated with explanatory variables, εi is the independently and normally distributed error term assumed to be normal as εi~[0, 1]. Following Green (2003), the probability (pi) of farmers’ participation in cluster crop production and expressed as:
pi=Prob [yi=1 | Xi]=Φ(X′iβ) ...(4)
Where; Φ represents the cumulative distribution of standard normal random. The marginal effect estimation was employed to measure the expected change in probabilities of farmers’ in cluster farming participation resulting from a unit change in the explanatory variables at the average mean effect and expressed as follows:
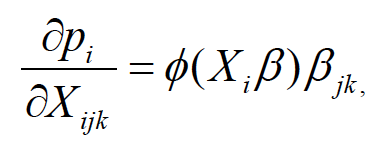 ...(5)
Where; Φ represents the probability density function of a standard normal variable.
Results and Discussion
Proportion of sampled households
The data was collected from the Ejersa Lafo and Bako-Tibe districts of the West Shewa zone, where 160 sampled households were interviewed. In these districts, cluster farming was implemented six years ago since 2014. The data had revealed 79.37% (n=127) households participated in cluster crop production while the remaining 20.63 %( n=33) households were not (see Table 2).
Table 2: Sampled households participated in cluster crop production.
|
HH Who Participated in Cluster Production |
Frequency |
Percent (%) |
|
Yes |
127 |
79.37 |
|
No |
33 |
20.63 |
|
Total |
160 |
100 |
Source: Own computation from filed survey data (2020).
Percentages of households by clustered crop
The study areas’ agro-ecology is suitable to produce cereal crops, mainly teff, wheat, barley, maize, and other legumes. Since the practice of cluster production is a recent phenomenon, farmers gradually introduce few crops. 56.44% of farmers were cluster maize producers in all sample districts, while 29.04% were cluster teff producers. On the other hand, about 9.9% and 4.62% were cluster producers of chickpea and wheat, respectively. This depicts that the orientation of farmers dominated in maize and teff production is practical because of permissible agroecology and availability of inputs by farmers’ cooperative (see Figure 2).
Land size covered by clustered crops
Most farmers allocated land for cluster production at less than one hectare. This is related to the input requirement at full package application felt difficulty as land size increases. The below figure showed that, on average, households allocated 0.6 hectares for teff production, while check pea production covered an average of 0.5 hectares. However, maize and wheat shared almost similar average hectares of land, which was less than 0.4 hectares at the mean. In general, the tendency of farmers’ allocation for chickpea increases to the equivalent level of teff production, indicating the signal for relative higher market demand for the two products (see Figure 3).
Current challenges of cluster crop production in the study areas
The typical cluster practised in the study area is inclusive of both location and commodity cluster. Under similar agroecology augmented with similar crop production, cluster production is advantageous. Ejersa Lafo and Bako-Tibe districts are geographically located in the Oromia region’s central part to get better market opportunities due to their proximity to the capital Addis Ababa. However, during data collection, smallholder farmers were requested through the question format about challenges related to cluster crop production and further supplemented by focus group discussion to raise inefficiencies of available opportunities.
For instance, the lack of output market to agro-processing enterprises is the major problems of smallholder farmers, where 88.75 %( N=142) were indicated. This is apparent that, in the West Shewa zone, almost no food-processing industries available, which have fortune potential to use agricultural raw materials. Next, 70.75% (N=115) indicated a shortage of Knapsack equipment for chemical application at the household level. Most farm households borrow from few households or rent in use from others. On the hand, 67% (N=109) of households confirmed the problem of interest arises while choosing crop and access to necessary basic inputs. Here cluster production requires homogenous crop production; however, farm household’s decision may be heterogeneous in deciding what to produce. Finally, similar households mentioned the insufficiency of training and market extension services to make the program more suitable and linking to potential agro-processing industries (See Table 3).
Table 3: Challenges of cluster crop production in the study areas.
|
Characteristics |
Frequency |
Percent (%) |
|
Lack of market linkage to agro-processing industries |
142 |
88.75 |
|
Shortage of Knapsack for chemical application |
115 |
70.75 |
|
Availability of interest of conflict in crop choice, and access to basic inputs |
109 |
67.00 |
|
In sufficient training in sustaining cluster production |
95 |
59.38 |
|
Inadequate extension services on market development |
90 |
56.25 |
|
Inadequate and timely provision of fertilizer and improved seed |
54 |
33.75 |
|
Limitation of land size |
39 |
24.38 |
|
unsuitable topography |
20 |
12.50 |
Source: Own computation from filed survey data (2020).
Descriptive
Table 4 illustrate the mean and proportion difference between cluster farming participants’ and non-participant’s in terms of continuous and dummy variables. Accordingly, we found a few characteristics that seemingly significant difference. There was a mean age difference at a t-value of -2.524 indicated that the mean age for participants was 42 years and for non-participants’ 38 years and significant at 5% probability level. This is justified in Table 4 above, that the majority of cluster participants’ were aged between 41-50 years. Farmers within this range age are matured to accumulate productive assets that enabling them to adopt a new model of the crop production system. Similarly, farmers experience in cluster crop production (t-value=-5.117) also mean differences approximately an average of 3 years for participants’ and 1 year for non-participants and significant at 1% probability level. This entails the more experience they had, the more farmers motivated to participate in cluster farming. On the other hand, the one year experience from the non participants shows there may be drop out of the program because of other factors not captured in this study.
There was also a mean difference interms of the frequency of extension contact where cluster farmers participants were visited on average 4 days in a month, and the non-participants’ were visited 2 days in a month (t-value=-4.884). This implies that agricultural extension workers doubled their visit days to cluster producers to provide maximum supervision services to implement the strategy as the government is interested in his policy to increase food production.
On the other hand, farmers were asked what objectives they were initiated to produce in the cluster. They phrased that surplus marketing /or commercial orientation and seed multiplication objectives are pivotal objectives. Though there was no mean proportion difference between cluster producers and non-producers for surplus marketing, we obtained how surplus marketing objective is significantly important in the decision to participate in cluster production in the probit model estimation of this study. However, consistently the variable seed multiplication objective has a mean proportion difference between cluster participants and non-participants at a 5% probability level. The chi-2 value in Table 4 showed that (χ2=21.291), the score means for participants was 0.950, while for the non-participants’ it was 0.742. This indicates, farmers have a high tendency for seed multiplication under the program of cluster production.
Access to training on cluster production was also an important variable used for comparison between the sample households. Accordingly, the (χ2=11.904) value showed that the mean proportion difference between participants and non-participants was 0.879 and 0.500, respectively, and significant at the 1% probability level. This implies that those who obtained training on cluster production through extension workers strengthen their decision to engage in cluster production while the non-participants reduced to half because of not access to training.
Table 4: Mean and proportion comparison for cluster participants’ and non-participants.
|
Variables (N=160) |
Participants (n=127) |
Non participants (n=33) |
t-value |
Total mean |
Min |
Max |
||
|
Continuous |
Mean |
Std. Dev. |
Mean |
Std.Dev. |
||||
|
Age of the Respondent in years |
43.200 |
0.906 |
38.360 |
1.405 |
-2.524** |
42.206 |
25 |
72 |
|
Family size of the respondent in number |
6.480 |
0.245 |
6.515 |
0.585 |
0.061 |
6.487 |
1 |
19 |
|
Economic Dependency Ratio |
0.293 |
0.021 |
0.308 |
0.041 |
0.321 |
0.296 |
0 |
0.83 |
|
Total cultivated Land Area in hectare |
1.648 |
0.111 |
1.454 |
0.366 |
-0.677 |
1.608 |
0 |
10 |
|
Number of Livestock in TLU |
4.522 |
0.270 |
4.896 |
0.557 |
0.622 |
4.559 |
0.026 |
18.19 |
|
Number of Oxen Owned in number |
1.232 |
0.060 |
1.045 |
0.098 |
-1.457 |
1.194 |
0 |
4 |
|
Farmer Experience in cluster farming in number of years |
2.551 |
0.136 |
1.151 |
0.098 |
-5.117*** |
2.262 |
0 |
6 |
|
Frequency of extension contacts in a month |
3.882 |
0.180 |
2.061 |
0.249 |
-4.844*** |
3.506 |
1 |
8 |
|
Dummy |
|
χ2-value |
|
|||||
|
Sex of the respondent (1=male;0=female) |
0.790 |
0.408 |
0.823 |
0.392 |
0.042 |
0.794 |
0 |
1 |
|
Educational status of the respondent (1=literate; 0= illiterate) |
0.777 |
0.427 |
0.732 |
0.448 |
10.891 |
0.760 |
0 |
1 |
|
Objectives for Marketable supply (1=Yes; 0=No) |
0.813 |
0.933 |
0.782 |
0.415 |
0.214 |
0.793 |
0 |
1 |
|
Objectives for Seed multiplication (1=Yes; 0=No) |
0.950 |
0.221 |
0.742 |
0.439 |
21.291** |
0.791 |
0 |
1 |
|
Obtain training on clustered production (1=Yes;0=No) |
0.879 |
0.237 |
0.500 |
0.507 |
11.904*** |
0.794 |
0 |
1 |
|
Access credit services to buy inputs (1=Yes;0=No) |
0.800 |
0.447 |
0.795 |
0.406 |
0.073 |
0.790 |
0 |
1 |
|
Engaged in off farm activities (1=Yes;0=No) |
0.781 |
0.420 |
0.796 |
0.404 |
0.076 |
0.774 |
0 |
1 |
|
Access to market information (1=Yes; 0=No) |
0.831 |
0.376 |
0.583 |
0.504 |
3.763** |
0.794 |
0 |
1 |
|
Obtain awarness on cluster farming (1=Yes; 0=No) |
0.888 |
0.333 |
0.670 |
0.577 |
1.627** |
0.780 |
0 |
1 |
Source: Own computation from filed survey data (2020).Hint: *, **, ***, indicates 10%, 5%, and1% significant level.
Finally, the sort of information that farmers accessed regarded to cluster production and marketing output is detrimental factors that contribute to farmers’ decision in cluster farming. Here, obtaining information about cluster production formally or informally means proportion differences between participants’ and non-participants’ and significant at 5% probability level. The (χ2=1,627) value showed that the mean proportion for participants was 0.888, while the non-participants’ was 0.670. Moreover, access to market information was also an important factor that bears mean proportion differences. The χ2=3.763 indicates that the mean proportion of participants and non-participants was 0.810 and 0.583, respectively. Access to market information has a high proportion to affect the decision to participate in cluster production.
Result of econometric models
Here below, fourteen explanatory variables were incorporated in probit model regression to estimate their explanatory effect on the dependent variable called ‘decision to participate in cluster crop production’. In the process of estimation, we conducted a test of goodness-of-fit, heteroscedasticity, and multicollinearity. Accordingly, the model’s goodness-of-fit was checked after post estimation command of estat gof and found p-value is insignificant. It justifies that the variables were fitted to the probit model revealed by Prob>chi2 =0.000. Test of heteroscedasticity was manipulated by running the model using robust standard error. The multicollinearity issue was checked through VIF of explanatory variables and obtained mean of 1.54 and showed less collinearity among the independent variables. After testing the hypothesis, the probit regression coefficient was estimated and then conducts post estimation at average margin effect using STATA command ‘margins’. Then we found nine significant explanatory variables that affect smallholder farmers’ decision to participate in cluster crop production (See Table 5).
Determinants of participation decision to cluster crop production
Sex of the household head (SEXHH): A household with a male head positively increases the likelihood of participating in cluster crop production on average by 12.3% and significant at a 10% probability level. Possibly, cluster crop production requires more social network, deal with a neighbouring farmer, and debate to argue mere interest of conflict arise among participant’s on what to produce, how to produce, and to whom to produce questions. Further, relatively male-headed households were fortunate to access farm production information on agricultural technologies and enable them to apply it. This study’s finding is similar to Alphonse et al. (2017), where male participants are more likely to participate in crop intensification program than their counterparts females in Rwanda. In addition, (Dadan et al., 2017) also argued being a male is positively influencing cooperative production than females in agro-cluster in west Javan farmers of Indonesia. In fact, agricultural production is a laborious activity demanding physical strength in which females may not fit enough in few activities of agriculture operations.
Marketable surplus supply objective (MSSO): As a farm manager or a farm owner unit, the farm operation’s purpose is to generate maximum profit under the given technology. This can be effective through producing market-orientated agricultural commodities. Thus, a dummy decision change in the objective of marketable surplus supply from 0 to 1 positively increases the likelihood of participating in cluster production on average by 14.9% and significant at 1% probability level. The positive sign of the marginal effect supported the hypothesis made in this study. This indicates that motivational factors behind producing teff/wheat/chickpea/or maize using cluster are the relatively high price the commodities have in the market, which might increase the tendency to produce a marketable surplus.
Seed multiplication objective (SMO): This is a dummy variable that can affect farmers’ decision to participate in cluster production. Accordingly, a dummy decision change in farmer’s objective of seed multiplication from 0 to 1 increase the likelihood of decision to participate in cluster production on average by 26.8% and significant at 1% probability level. The sign of the marginal effect is consistent with the hypothesis made in this study. This implies that farm households are oriented to private seed development to alleviate personal seed requirements or sell it on the market. Currently, smallholder farmers are suffering from access to adequate improved seed through a formal system because of the high demand for seed relative to available supply. This might be related to less involvement of private sector investment in seed multiplication and would initiate farmers as an objective to produce it. The finding in this study is consistent with Hagos et al. (2017), which argued that cooperative seed production participation is increasing in Ethiopia’s Tigray region through the provision of demonstrative training.
Economic dependence ratio (EDR): This is the ratio of family members who are economically dependent on the given active labour household members. A unit increase in the ratio of economic dependence in the family member would increase the likelihood of participating in cluster production on average by 24.4% and significant at 5% probability level. This is an unexpected sign against the negative hypothesis made in this study. Anyhow, this arises as positive indicates that there may be potential assets such as land that augmented with an active labour force in the family member and fortunate to use the resource aiming the resilience of economic shocks of the household.
Awareness of cluster production (AwCP): Farmers were asked whether they obtain awareness of the benefits of cluster crop production or not. Farmers mentioned the potential accessible to aware of cluster production during the meeting and social participation, either informally or formally. They mentioned that the development agent delivered the primary awareness and supplemented by visiting farm field demonstration at the Arsi zone where cluster producer farmers were long engaged. In this analysis, obtaining awareness on cluster crop production increases the likelihood of decision to participate in cluster crop production on average by 17.7% and significant at 10% probability level. Awareness builds up the psychological frame of farmers’ decision to maximize the utility from a given program that widens the available opportunities to boost household farm economy.
Number of livestock owned in TLU (LVSTOCK): Livestock is one household’s economic endowments that stake the basic requirement of farm household’s needs. The expected sign for this variable was positive, but the model result showed a negative sign. Accordingly, a unit increase in livestock number in TLU decreases the likelihood of a household’s participation in cluster crop production on average by 1.9% and significant at a 5% probability level. Here the effect is slightly very small nevertheless, those households who own relatively more livestock in TLU may allocate land for animal fodder development, which might reduce land allocation for crop production. The result is consistent with farmer’s program participation in soil and water conservation practices in which (Amsalu and Graff, 2007; Tizale, 2007; Damena, 2012) argued the negative influence of livestock ownership in program participation. That means rational farm household’s may trade-off his/her choice between land allocation for fodder development and crop production.
Experience in cluster production (ExCPr): This program has launched in the study areas since 2014, and farm households have invariant time to participate in the program. Thus, a year increase in cluster crop production experience increases the likelihood of participating in cluster production on average by 17.9% and significant at 1% probability level. The marginal effect sign for this variable is consistent with the hypothesis made. Hence, experience provides a learning environment to expand the size of clustered land and diversifying crop to be clustered. Moreover, the government’s social bondage and maximum supervision motivate farmers to move from conventional farming system to practice cluster production. This result is similar to Lioutas et al. (2010) argued that farmers’ knowledge, experience and real needs are pivotal drivers to design and implement any agricultural program. Furthermore, Salihu et al. (2020), in the study of watermelon production in the Sokoto state of Nigeria, argued that farm experience has positively affected farm households’ participation.
Acquire training on cluster production (ATCPr): The Ethiopia government currently advocating cluster crop production by smallholder farmers. Agricultural Transformation Agency (ATA), a government institution, took responsibility for following up the program and provided training in 400 districts for selected model farmers. Hence, those farmers who nominated for this program had acquired basic training on how to conduct cluster crop production. In this research, a dummy change in acquiring training on cluster crop production from 0 to 1 decrease the likelihood of participating in cluster production on average by 10.7% and significant at 1% probability level. Here the sign of the variable is against the hypothesis made. The possible reason why training reduces the participation effect is that it may be awareness obtained by development agents contributes more to the participation, or the content of the training may not be unique to that of awareness. We checked that the value of the correlation coefficient between acquire training and awareness is negative (-0.197), which may offset the positive tendency of training on cluster crop production.
Frequency of extension contact (FEXCON): This is the long year service rendered by government bodies through the Ministry of Agriculture that counted over five decades in Ethiopia to improve farm livelihood. Hence, a unit increase in extension contact frequency increases the likelihood of participation in cluster crop production on average by 4.9% and significant at a 1% probability level. This implies that the full facet of services delivered by development agents encourages farmers’ participation in new production techniques through demonstrative exercise on-farm trial fields. This finding is collaborated by Prince et al.,2013 argued that a farmer who has access to agricultural extension service is about 14 times more likely to participate in an agricultural project, the case of the Agricultural Value Chain Mentorship Project in the Northern Region of Ghana (see Table 5).
Table 5: Coefficient and marginal effect result of probit model regression.
|
Variables |
Coef |
Robust Std.Err. |
Delta method |
||
|
Z |
P>|Z| |
dy/dx |
|||
|
AGEHH |
0.019 |
0.032 |
0.63 |
0.528 |
0.002 |
|
SEXHH* |
0.969 |
0.566 |
1.74 |
0.082* |
0.123 |
|
EDUCA |
0.156 |
0.242 |
0.66 |
0.509 |
0.019 |
|
MSSO* |
1.178 |
0.372 |
3.41 |
0.001*** |
0.149 |
|
SMO* |
2.116 |
0.597 |
3.72 |
0.000*** |
0.268 |
|
FMSIZE |
0.114 |
0.077 |
1.45 |
0.147 |
0.014 |
|
EDR |
1.923 |
0.935 |
2.31 |
0.021** |
0.244 |
|
LANDSI |
-0.080 |
0.103 |
-0.79 |
0.430 |
-0.01 |
|
AwCP* |
1.401 |
0.492 |
3.01 |
0.003*** |
0.177 |
|
LVSTOCK |
-0.152 |
0.077 |
-1.97 |
0.049** |
-0.019 |
|
OXEN |
-0.233 |
0.418 |
-0.56 |
0.575 |
-0.029 |
|
ExCPr |
1.412 |
0.289 |
5.33 |
0.000*** |
0.179 |
|
ATCPr* |
-0.843 |
0.351 |
-2.68 |
0.007*** |
-0.107 |
|
FEXCON |
0.394 |
0.128 |
3.45 |
0.001*** |
0.049 |
|
_cons |
-5.631 |
1.975 |
|
|
|
|
Number of obs = 160 |
|
||||
|
Wald chi2(14) = 51.16 |
|||||
|
Prob>chi2 = 0.000 |
|||||
|
Pseudo R2 = 0.5523 |
|||||
|
Log pseudo likelihood= -36.460 |
|||||
(*) dy/dx is for discrete change of dummy variable from 0 to 1.
Source: Own computation from field survey (2020). Hint: *** (1%), ** (5%),*(10%) significant level.
Conclusions and Recommendations
In the study areas, cereal crops such as teff, maize, chickpea, and wheat are the primal crops to be clustered for production. The majority of sampled households choose maize crop for cluster production, followed by teff. However, interms of land size allocation, teff was ranked first and succeeded by chickpea. From its inception, cluster production aimed to link production to a potential market in which farmers obtain fair market price advantages. Though linking smallholder farmers to potential market is not yet strengthened, further investment in the program is expected from the government. Therefore, we found confidential development of cluster crop production framed with available policy and calls for identifying implementation gaps. This study embarks some clue that opens further investigation in the efficiency of the program implementation and upholds the existing policy
Based on the findings obtained in this study, the following recommendations are forwarded.
- Being a male household positively affecting cluster production participation. Here to encourage the program at the large scale of farming communities, capacitating male households is important interms of confidential to disseminate the knowledge and the practice among the non-participant farm households. Nevertheless, in the long run, the gender issue of cluster production program will be accessed through target agricultural policy.
- Education is also an important factor as it opens to look ample opportunities which expected to boost agricultural livelihood. Therefore, in order to modernize the smallholder farming system, farmers should attend basic education at their nearest school, and the government should raise the scale of its access and success level.
- Wealth resource factors like livestock own are significant to apprehend the decision to upgrade production techniques. Since livestock is the potential source of family income, the existing livestock development package should be encouraged as an alternative means of filling family food security demand and generating substantial income from the sector.
- The economic dependency ratio is also a significant factor that anchors farm households’ decision to participate in cluster production. Thus, a high economic dependency ratio leads to deterioration of resource efficiency; therefore, it is better to target reducing economic dependency in farm family members by developing skill and providing productive assets to economically vulnerable households.
- Farm households’ objectives, seed multiplication, and marketable surplus supply are favouring cluster production. Therefore, agricultural experts and agricultural cooperative should stand with these twins role of cluster production by providing technical advice and outcome supervisions.
- Finally, farmer experience, training, extension services, and distance to the nearest market are important variables. Here, households should access complementary services that increase production and marketing efficiencies through infrastructure and institutional services improvements. In order to transit from the existing level, government investment in training farmers and infrastructure development will force through existing agricultural development strategies by applying the principles of ‘learning by doing’.
Acknowledgements
We would like to express our gratitude for those who directly and indirectly stretch their effort to complete this research. We honoured Ambo University, Research and Community service Office who facilitate the project’s approval and furnish financial disbursement through the college research coordinator office. Furthermore, we acknowledge our college who provided vehicle services, assure a letter of support, and settled the budget. Finally, we thank district agricultural experts for auxiliary facilitation during field survey data collection and exerted their expertise to complete the work timely.
Novelty Statement
Cluster crop production is a new farming practice in Oromia National Regional State, Ethiopia. Thus, the findings paved way to interfere further assessment of the practices by identifying determinants of farmers’ decision to participate in cluster crop production.
Author’s Contribution
Chala Hailu Hussen and Fikiru Temesgen Geleta designed the research project, drew a questionnaire, supervised data collection, analyzed the data, and wrote up the research report.
Conflict of interest
The authors have declared no conflict of interest.
References
Alphonse, N., O. Morris, Omondi, Z. Xu, L. Li, G.J. Pan and Stephen. 2017. Direct Factors influencing farmers’ participation in crop intensification program in Rwanda. J. Integ. Agric., 16(6): 1406–1416 RESEARCH ARTICLE Available online at www.sciencedirect.com Science, https://doi.org/10.1016/S2095-3119(16)61555-1
Amsalu, A., and J. De-Graaff. 2007. Determinants of adoption and continued use of stone terraces for soil and water conservation in an Ethiopian highland watershed. Ecol. Econ., 61: 294–302. https://doi.org/10.1016/j.ecolecon.2006.01.014
Anderson, L. and T. Reynolds. 2009. Agribusiness development clusters, Sezs and incubators: Lessons learned for smallholder-focused agricultural development. Evans School of Public Affairs, University of Washington. Pre. Agric. Dev. Team Bill Melinda Gates Found. April 29, 2015.
ATA (Agricultural Transformation Agency). 2017. Ethiopian Agriculture and Strategies for Growth: Review paper presented for Norway Agribusiness Seminar. November 2017.
Baodan, Y., L. Wei, H. Yuxiang and Z. Ruixiang. 2015. Influence factors analysis of farmers participation in agricultural machinery cooperative management. Int. Conf. Logistics Eng. Manage. Comput. Sci., pp. 690-694.
BWAO (Bako-Tibe Woreda Agricultural Office). 2020. Annual Report Document for the year 2019/2020 production period.
Castle, E.N., M.H. Becker and A.G. Nelson. 1987. Farm business management: The decision making process. New York: MacMillan Publishing Company.
CSA (Central Statistical Agency). 2007. Summary and statistical report of 2007 population and housing census. Federal Democratic Republic of Ethiopia population and census commission. pp. 1650- 1680.
CSA (Central Statistics Authority). 2016. Key findings of the 2015/2016 agricultural sample survey. Addis Ababa, Ethiopia: FDRE Central Statistical Authority (CSA) country summary, July 2016.
Dadan, W., L. Rico and H. Wim. 2015. The effects of agro-clusters on rural poverty: A spatial perspective for west java of Indonesia. Paper prepared for presentation at the 150th EAAE Seminar ‘The spatial dimension in analyzing the linkages between agriculture, rural development and the environment’ Edinburgh, UK, October 22-23, 2015.
Dadan, W., L. Rico and H. Wim. 2017. Transformation in agricultural and food economy in Asia 11-13 January 2017 Bangkok, Thailand. The 9th ASAE International Conference: Farmer Cooperation in the Context of Agro-clusters, west Javan farmers, Indonesia.
Damena, D., 2012. Determinants of farmers land management practices: The case of Tole District, South West Shewa Zone, Oromia National Regional State, Ethiopia. J. Sustain Dev. Afr., 14(1): 76–96.
ELAO (Ejersa -Lefo Agricultural Office). 2020. Annual report document on production year of 2019/2020.
FAO (Food and Agricultural Organization). 2010. Agro-Based clusters in developing countries: Staying competitive in a globalized economy. Agricultural management, marketing and finance occasional paper No. 25, Rome, Italy.
Gálvez, E. and Nogales. 2010. Agro-based clusters in developing countries: Staying competitive in a globalized economy. Occasional Papers No. 25, FAO-Agricultural Management, Marketing and Finance, Rome, Italy.
Greene, W.H., 2003. Econometric analysis, 4th ed., Prentice-Hall, pp.640 – 642.
Hagos, K., T. Lemma and T. Girmay. 2017. Determinants of smallholder farmers’ participation in seed producing cooperatives in Southern Zone of Tigray, Ethiopia. J. Agric. Ext. Rural Dev., https://doi.org/10.5897/JAERD2017.0868
Holtzman, J., R. Abbott, D. Shaffer and R. Koskella. 1997. Innovative approaches to agribusiness development in Sub-Saharan Africa. Volume 2: Secondary Research Findings. USAID Technical Paper No. 79.
ITC (International Trade Center). 2006a. Bringing the poor into the export process: Is linking small producers and big exporters a solution? India trade promotion organization. ITC Executive Forum, International Trade Centre UNCTAD/WTO. Geneva, Switzerland.
Lioutas, E., D., Tzimitra-Kalogianni and C., Charatsari. 2010. Small ruminant producers’ training needs and factors discouraging participation in agricultural education/training programs. Livest. Res. Rural Dev., pp. 22-26.
Porter, M., 1998. Clusters and the new economics of competition. Harvard Business Review. Available at: http://hbr.org/product/clusters-and-the-new-economics-of-competition/an/98609-PDF-ENG.
Prince, M.E., D. Wilson, N.W. Alexander, M. Edward, E. Eunice, K.O. Robertand W. Esther. 2013. Factors influencing farmer’s participation in agricultural projects: The case of the agricultural value chain mentorship project in the northern region of Ghana. J. Econ. Sustain. Dev., Vol. (4) No.10.
Reardon, T., C.B. Barrett, J.A. Berdegué and J.F. Swinnen. 2009. Agrifood industry transformation and small farmers in developing countries. World Dev., 37(11): 1717-1727. https://doi.org/10.1016/j.worlddev.2008.08.023
Roy, D. and A. Thorat. 2008. Success in high-value horticultural export markets for small farmers: The case of Mahagrapes in India. World Dev. 36(10): 1874–1890. https://doi.org/10.1016/j.worlddev.2007.09.009
Saegaert, J., E. Khrenov and N. Díez. 2004. Competitiveness through export clusters that work. Background paper presented at the ITC UNCTAD/WTO Executive Forum 2004. Competitiveness through Public-Private Partnership: Successes and Lessons Learned. Geneva, Switzerland.
Salihu, A.A., M.M. Binta, B.A. Maryam, M. Abdullahi and M. Dalha. 2020. Analysis of factors influencing participation of farm households in watermelon production in some selected local government areas of Sokoto State, Nigeria.
Tizale, C., 2007. The dynamics of soil degradation and incentives for optimal management in Central Highlands of Ethiopia. South Africa: University of Pretoria; 2007.
World Bank, 2007. World development report, 2008. Agriculture for development. The World Bank. Washington, D.C.
World Bank. 2012. Vietnam-agriculture competitiveness project. Washington, DC: World Bank Group. http://documents.worldbank.org/curated/en/2014/11/20467615/vietnam-agriculture-competitiveness-project.
WSZADO (West Shewa Zone Agricultural Development Office). 2018. Field report on annual crop production during production period of 2018.
Yamane, T., 1967. Statistics: An introductory analysis, 2nd Ed., New York: Harper and Row.
Zhang, T.H. and Y.L. Wu. 2009. The development mode and evolution mechanism of agricultural clusters. East China Econ. Manage., 23: 15-18.
To share on other social networks, click on any share button. What are these?


