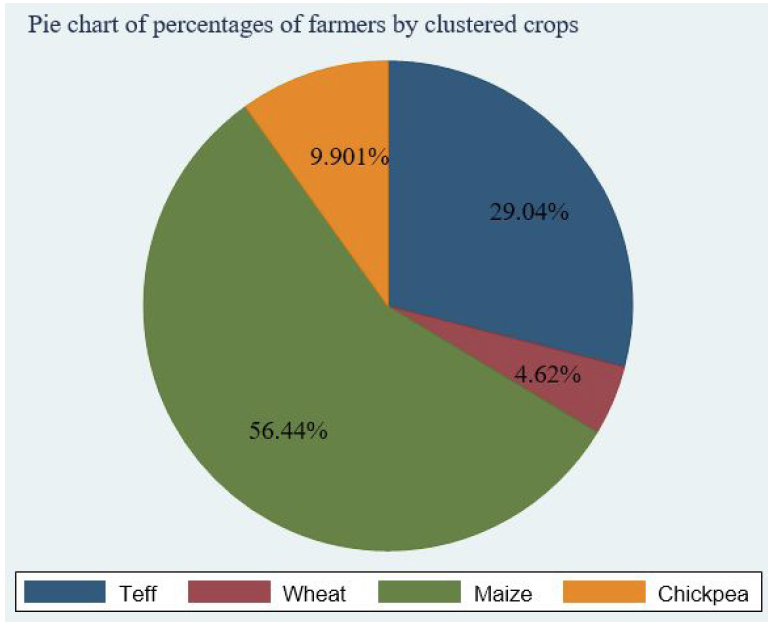
Pie chart of clustered crops by percentages of farmers; Source: Own computation from filed survey data (2020).