View larger version:
Download Original File
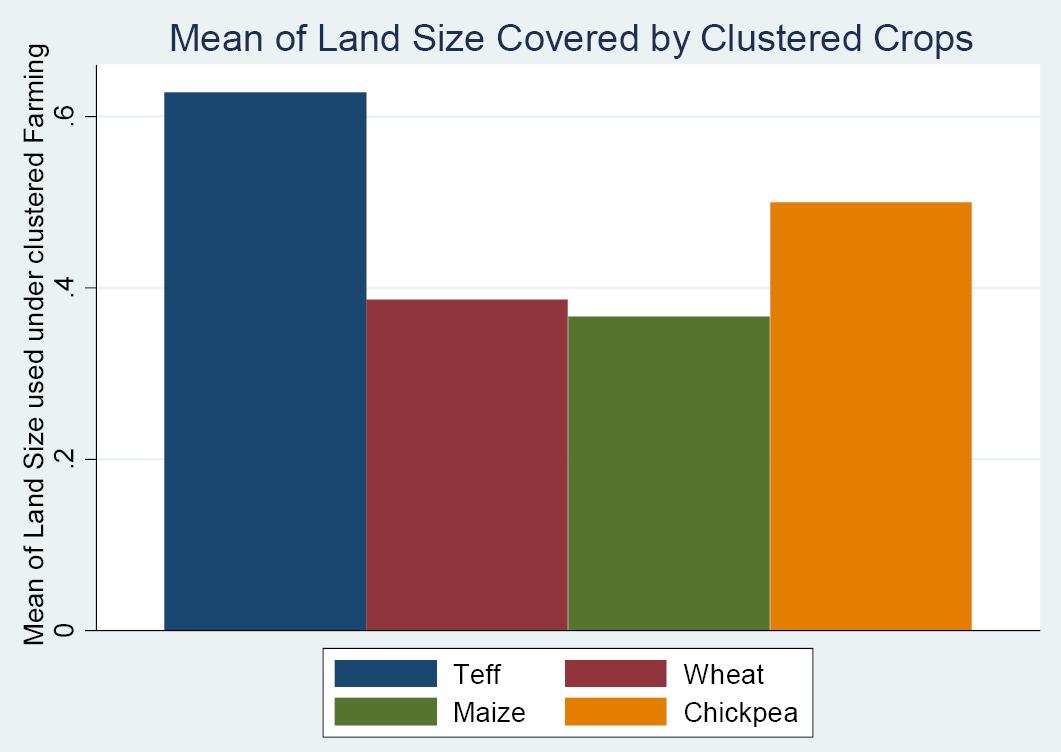
Figure 3:
Bar graph of mean land size allocated by clustered crops.
Source: Own computation from filed survey data (2020).
