

Expression, Purification and Enzymatic Activity of α-1,2 Mannosidase I Derived from Trichoderma reesei in Pichia pastoris


Expression, Purification and Enzymatic Activity of α-1,2 Mannosidase I Derived from Trichoderma reesei in Pichia pastoris
Siqiang Li1,2, Tiantian Wang1, Peng Sun1, Airong Gao1, Xin Gong1, Yuanhong Xu2, Baogen Wang2, Jun Wu1* and Bo Liu1*

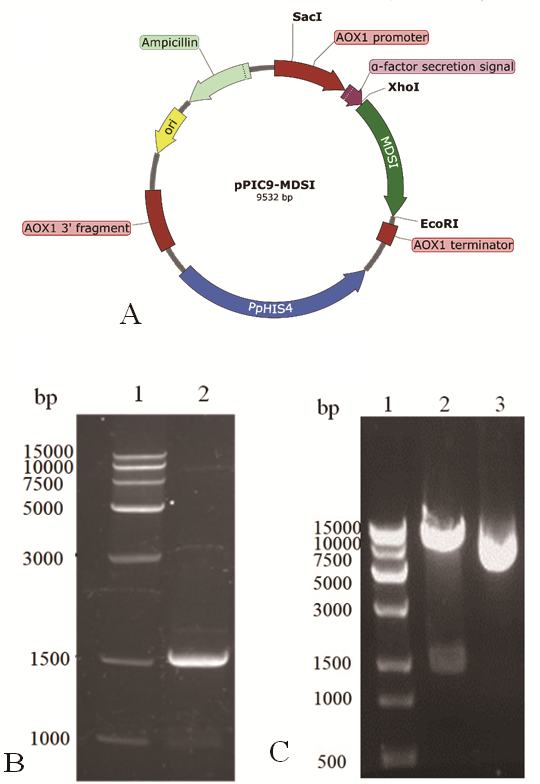
Construction of the expression vector pPIC9-α-M, A) schematic diagram of the expression vector pPIC9-α-M; B) PCR amplification of mds I gene from pAO815α-M, molecular marker (lane 1), mds I gene (lane 2); C) dentification of pPIC9-α-M by enzyme digestion, molecular marker (lane 1), pPIC9-α-M digested by EcoR I and XhoI (lane 2) and circle plasmid pPIC9-α-M as control (lane 3).
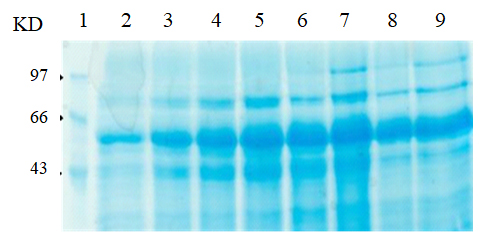
Expression level analysis of the MDS I in the 5-liter fermentation culture supernatant at different time points by SDS-PAGE, molecular marker (lane 1), 12 h (lane 2), 24 h (lane 3), 48 h (lane 4), 60 h (lane 5), 72 h (lane 6), 84 h (lane 7), 96 h (lane 8), 108 h (lane 9).
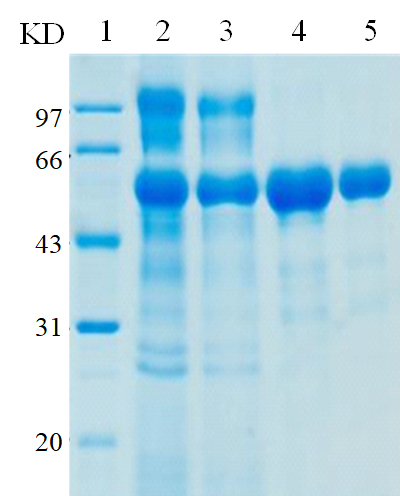
SDS-PAGE analysis of the purified MDS I, molecular marker (lane 1), 10 µL MDS I from raw liquid (lane 2) and each elution after purification from ammonium sulphate precipitation (lane 3), Phenyl-HP (lane 4), Sephadex G25 (lane 5) was subjected to the 12% SDS-PAGE and stained by Coomassie blue.
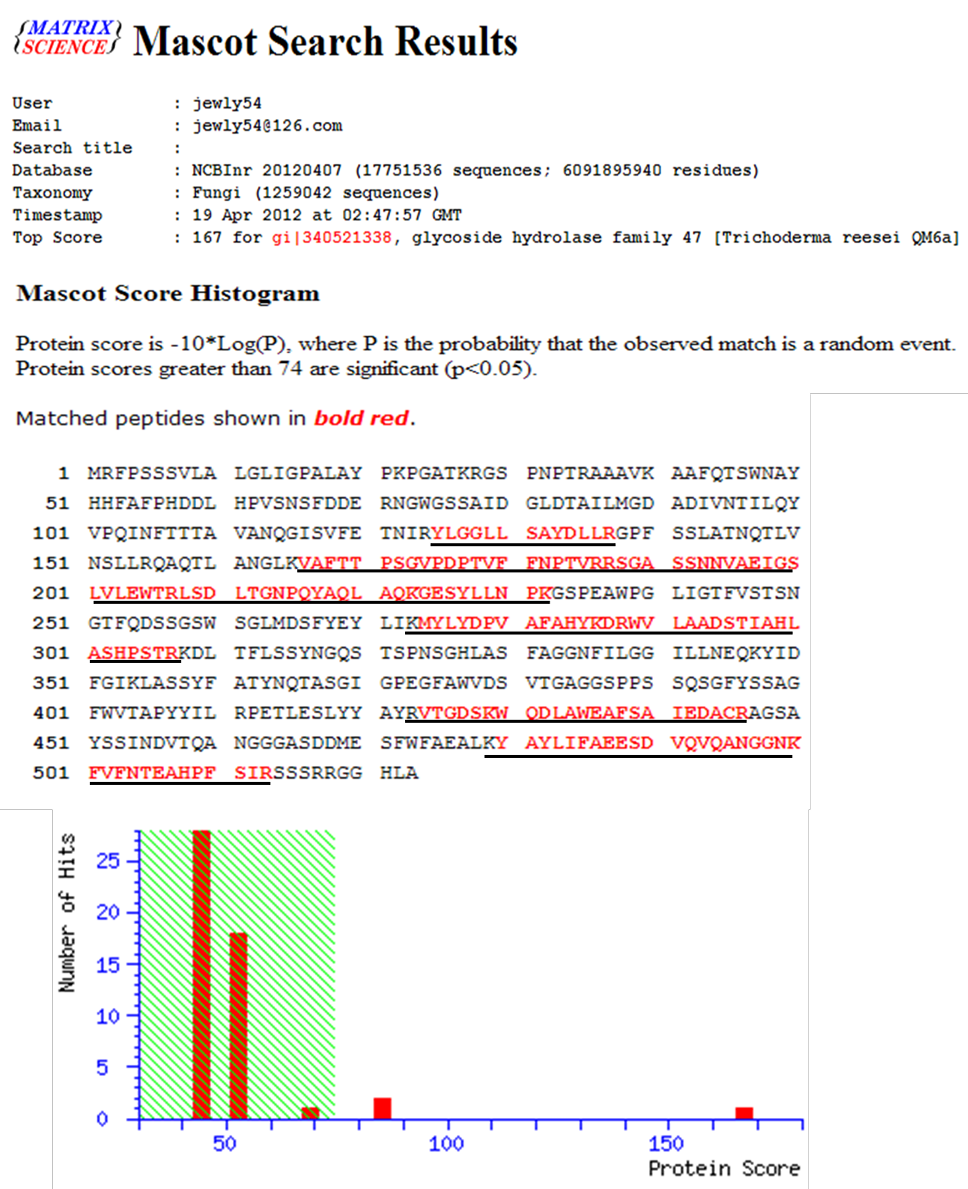
PMF analysis of the expressive product.
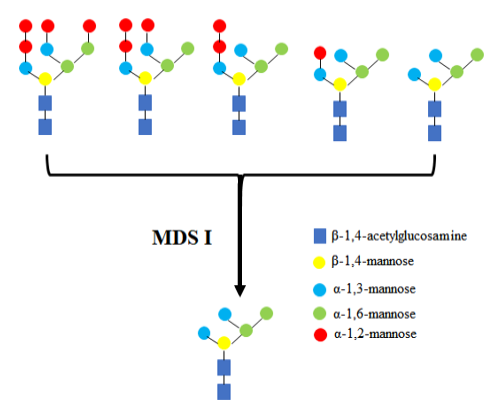
Five glycoforms of RNase B and MDS I catalyze reaction.

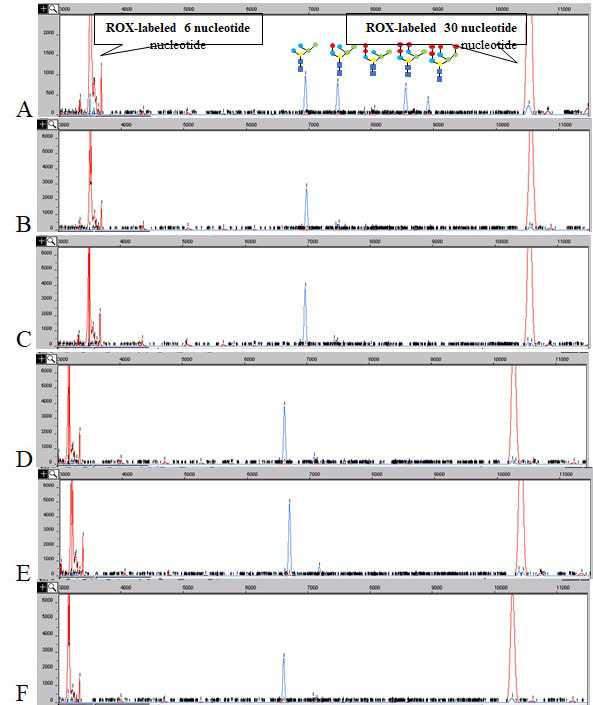
The effect of metallic ions on the activity of MDS I, Cu2+ (A), Co2+ (B), Zn2+ (C), Mn2+ (D), control (E), Mg2+ (F) and Ca2+ (G).

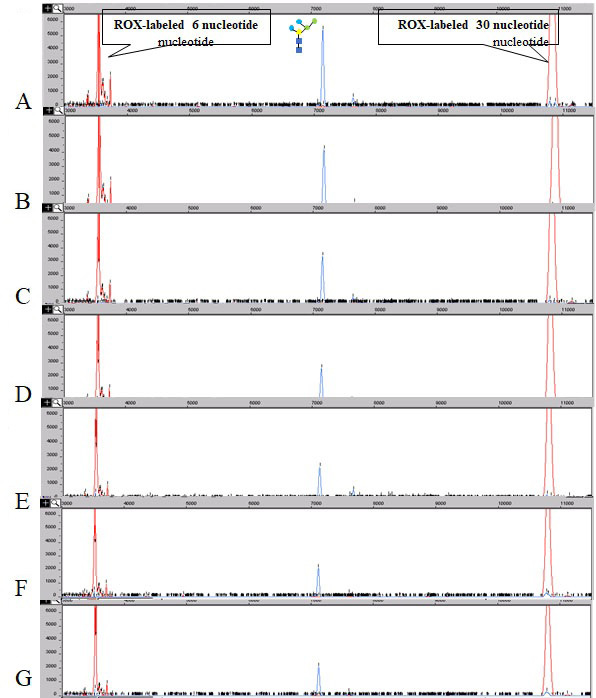
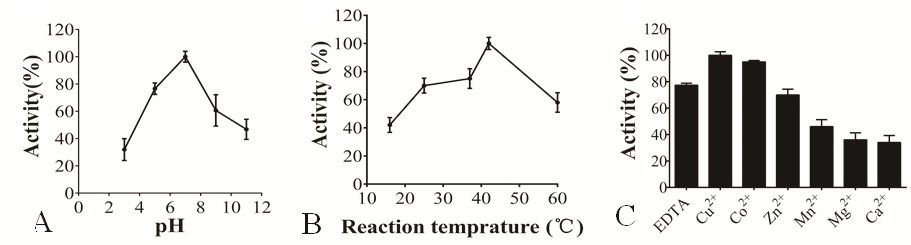
The influence of pH (A), temperature (B), cation (C) on the reaction of RNase B N-glycans catalyzed by MDS I.
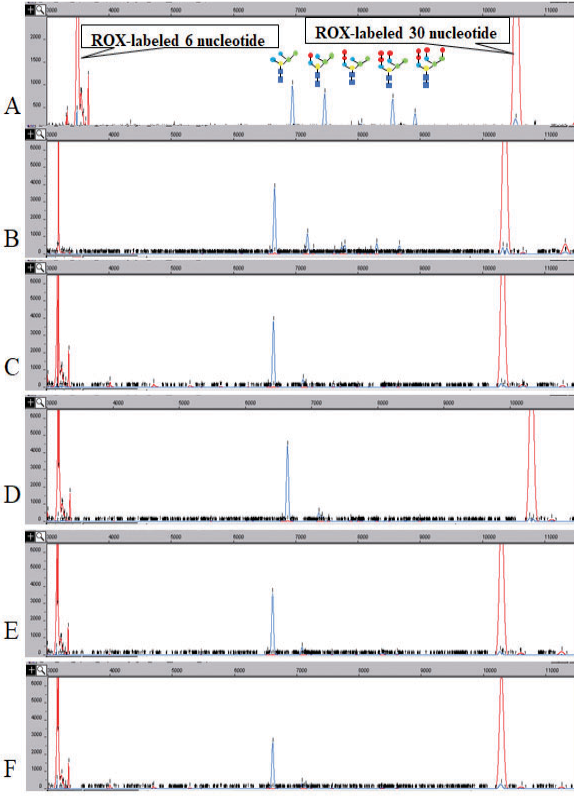
The effect of temperature on the activity of MDS I, control (A), 16 ℃ (B), 25 ℃ (C), 37 ℃ (D), 42 ℃ (E) and 60 ℃ (F).


