
Evaluating the Impact of Various LED Light Spectrums on Dendrobium officinale Tissue Culture Seedlings


Evaluating the Impact of Various LED Light Spectrums on Dendrobium officinale Tissue Culture Seedlings
Hafiz Ishtiaq Ahmad1, Jinlong Zhang1, Fuxun Luo1, Owais Iqbal2 and Yuying Wang1*
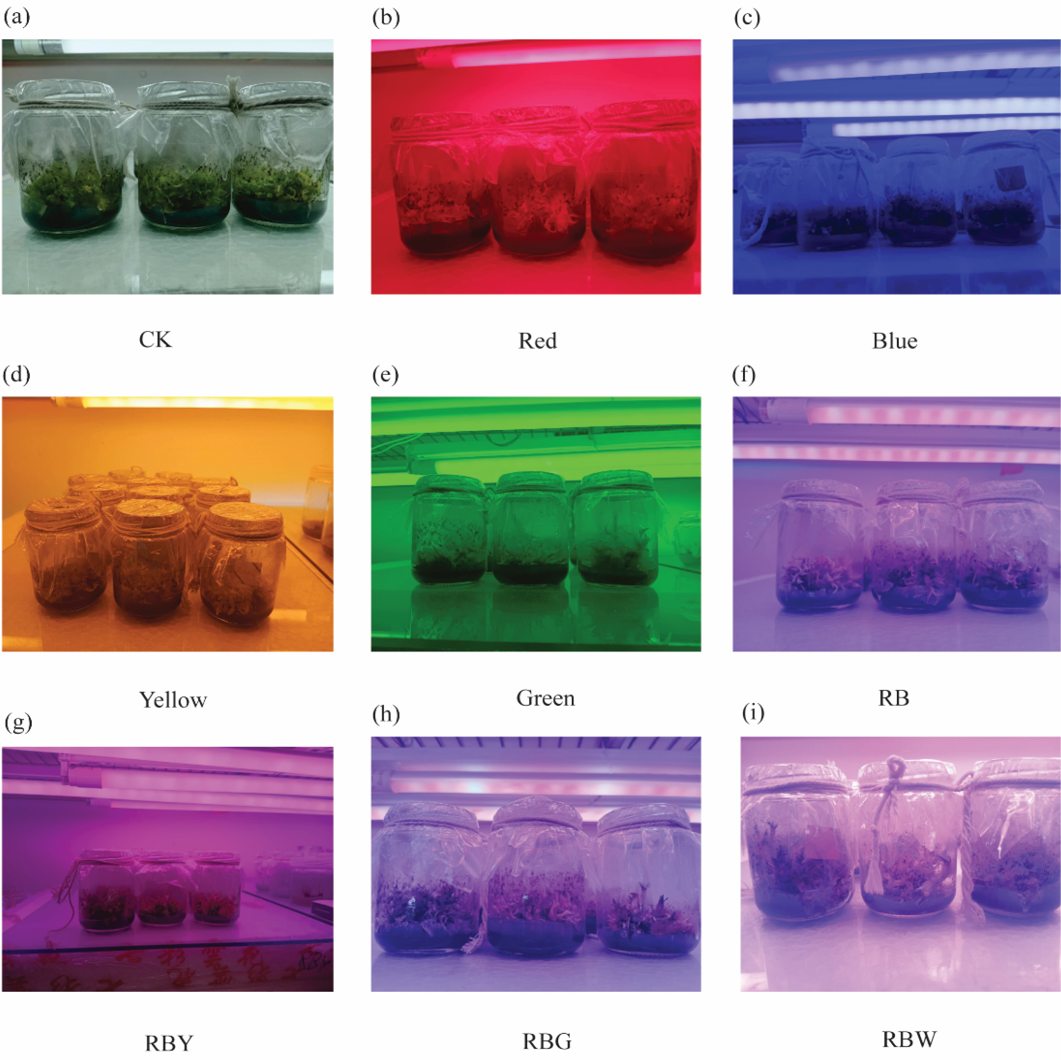
Dendrobium officinale tissue culture seedlings were illuminated under different LED light qualities condition. Different letters indicate various color of light spectrum.
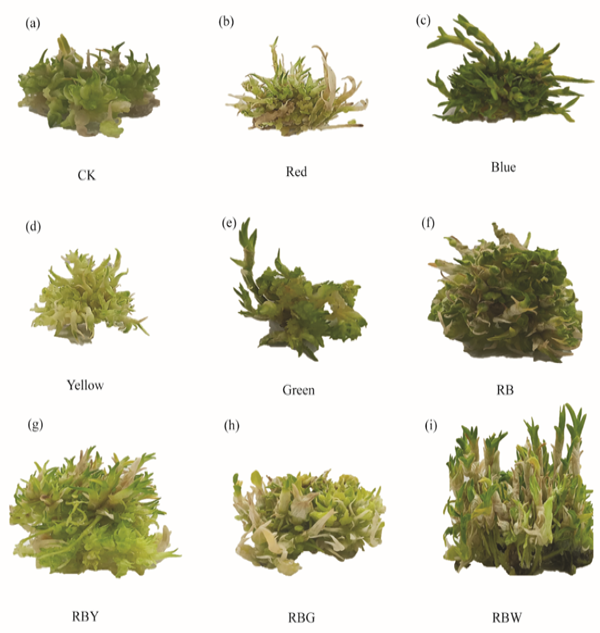
Dendrobium officinale tissue culture seedlings were irradiated under different light sources, including red, blue, yellow, green, combined red and blue (RB), mixture of red, blue, and yellow (RBY), a combination of red, blue, and green (RBG), a blend of red, blue, and white (RBW) compared with fluorescent white light (CK)
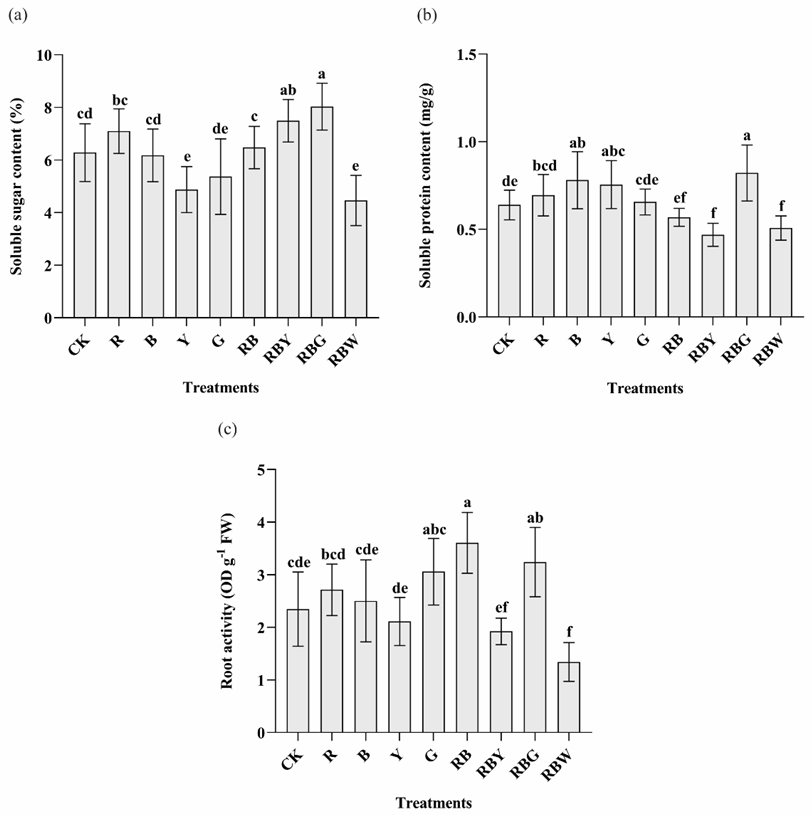
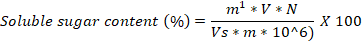
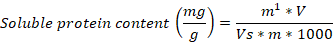
Soluble sugar content, soluble protein content, and root activity in tissue culture seedlings of D. officinale under different light qualities. Different letters (a, b, c, d, e, f) indicate significant differences between treatments at P≤0.05 by using Duncan’s test. Vertical bars represent the standard deviation of the means (n = 10) in soluble sugar and protein, whereas the standard deviation of the means (n = 6) in root activity.
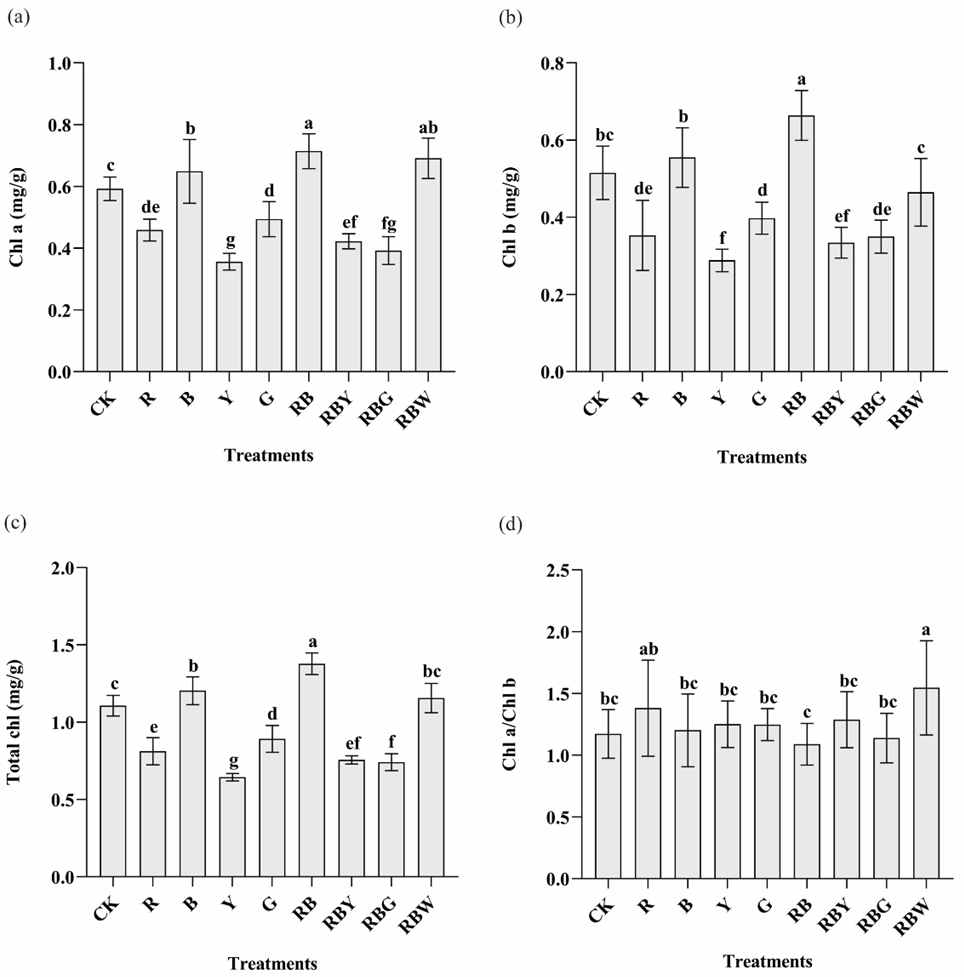
Chlorophyll a, chlorophyll b, total chlorophyll, and Chl a/Chl b ratio in tissue culture seedlings of D. officinale under different light qualities. Different letters (a, b, c, d, e, f, g) indicate significant differences between treatments at P≤0.05 by using Duncan’s test. Vertical bars represent the standard deviation of the means (n = 10).
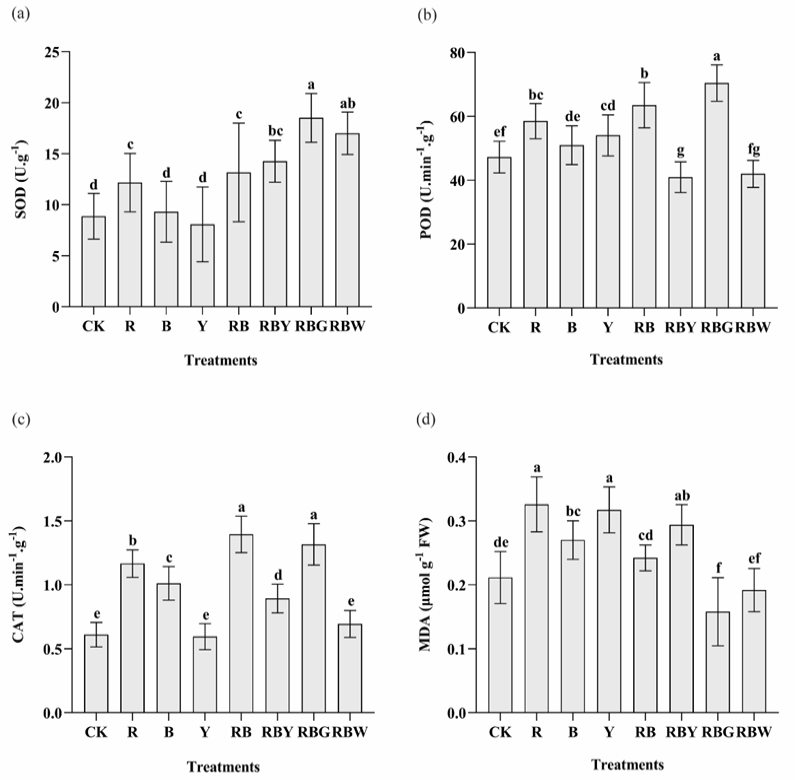
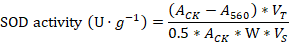
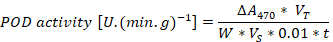
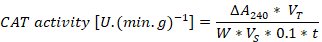
Superoxide dismutase, peroxidase, catalase, and malondialdehyde enzyme activity in tissue culture seedlings of D. officinale under different light qualities. Different letters (a, b, c, d, e, f, g) indicate significant differences between treatments at P≤0.05 by using Duncan’s test. Vertical bars represent the standard deviation of the means (n = 10) in superoxide dismutase, peroxidase, and catalase whereas the standard deviation of the means (n = 6) in malondialdehyde.


