

Energy Requirement for Growing Mink Fed on Diets of Different Energy Levels


Energy Requirement for Growing Mink Fed on Diets of Different Energy Levels
Ying Yang 1,2,3, Tietao Zhang 1,2,3, Min Rong 1,2,3, JiaPing Xu 1,2,3 and Xiumei Xing 1,2,3*
1Institution of Special Animal and Plant Sciences, Chinese Academy of Agricultural Sciences, No. 4899, Juye Street, Jingyue Economic Development Zone, Changchun, Jilin, China
2State Key Laboratory of Special Economic Animal Molecular Biology, Changchun, Jilin, China
3Key Laboratory of Special Economic Animal Genetic Breeding and Reproduction, Ministry of Agriculture, Changchun, Jilin, China
ABSTRACT
The requirement of energy for growth was studied in 176 pastel farm-raised mink (88♂+88♀). Diets formulated with 32% of crude protein and increasing bean oil contents were fed to eight groups of mink. It were fed containing approximately 3, 6, 9, 12, 15, 18, 21 or 24% bean oil in the complete dry power respectively. Mink were voluntary feed intake was found to be dependent upon dietary energy content. Body weights were regulated by energy intake tended to increase at first and then decreased as the energy level was increased. The growth rate and voluntary feed intake regression coefficients for energy and the growth responses from weaning to the age of 26 weeks were studied in male and female mink receiving diets varying in energy level content. The apparent digestibility was digested better by male than by female. The energy levels affected the performances of female mink to a lesser degree than those of male mink. Diets containing energy at levels below 15.06KJ/kg and exceed 29.06 KJ/kg of dry matter did not support optimum growth of male, but energy levels at least as low as 17.81KJ/kg and no more than 29.06 KJ/kg appeared to be satisfactory for the growth of female.
Article Information
Received 05 June 2019
Revised 29 July 2019
Accepted 11 September 2019
Available online 30 July 2021
Authors’ Contribution
YY and TZ designed the study and performed the experiments. MR and JPX analyzed the data. XX wrote the manuscript.
Key words
Mink (Mustela vison), Energy, Body weight, Feed intake, Crude protein, Fat
DOI: https://dx.doi.org/10.17582/journal.pjz/20190605040624
* Corresponding author: [email protected]
0030-9923/2021/0005-1905 $ 9.00/0
Copyright 2021 Zoological Society of Pakistan
INTRODUCTION
As is well known, minks are a small, precious furry animals. They have commonly been fed on such raw foods as horse meat, whale meat, fish and slaughter house by-products. Therefore, several difficulties, such as high transportation costs due to the high water content of the foods and the necessity for refrigeration equipment, have been encountered. In addition, much labor is required for cooking, blending and feeding (Kumeno et al., 1970). Use of a dried complete power diet to solve the above problems has been investigated.
Nutrient composition and digestibility are of crucial importance for health and well-being of animals (Krogdahl et al., 2004). There is limited information available concerning the nutritional requirements of mink compared to other animals. Several studies on the nutrient digestibility, nitrogen balance and mineral requirement in growing mink have been reported (Ahlstrøm Ø., 1995; Hellwing et al., 2005; Zhang et al., 2012, 2013, 2014; Wu et al., 2014, 2015).
Energy balance is the key characteristic of nutrient digestibility and nitrogen balance. Energy is the property possessed by fats, carbohydrates and proteins. Very few studies have been done on energy in fur animals (Borsting et al., 1998; Polonen et al., 2000; Hellwing et al., 2005; Burlikowska and Szymeczko, 2007; Kopczewski et al., 2001). However, the data available on energy requirement of mink is not only less accurate but also not enough.
This study was carried out in order to determine the effect of dietary energy level on growth and nutrient digestibility in young mink, based on growth and health parameters, i.e. the body weight, the growth rate, the voluntary daily feed intake, and nutrients digestibility. The growth rate and voluntary feed intake regression coefficients for energy level were also determined and the growth responses and nutrient digestibility were interpreted as a function of the energy level of diets. The nutrient digestibility correlations were also investigated.
MATERIALS AND METHODS
Animals used in this study were cared for and handled following the guidelines established by the Ministry of Agriculture Experiment Station Fieled Observation Changbai, Jilin, China. (44°2′23.75″N, 126°4′37″E; annual mean temperature 0.9℃, the temperature ranged between 25℃ to -30℃ during the course of the experiment). The use of minks in this study followed guidelines similar to those laid out by the Canadian Council on Animal Care (1993). Animals were housed outdoors individually in conventional cages (0.90*0.30*0.45 m) in a two-row shed. 176 mink kits (male body weight (BW) =1.03 ±0.09 kg and female BW =0.76 ±0.03 kg) of the standard black colour type were randomly allotted to eight groups. The animals were allocated to eight different diets according to weight at the start of the experiment. The mink were allowed a one-week period to adapt to the cage environment and experimental diets. Mink kits were born during May 3 to 7 and accustomed to individual cages for a few weeks prior to starting the test on July, 2011 (phase I), phase II was conducted in September. Kits were subjected to the experimental diets at about 6 weeks of age without a preliminary period.
Table I. Composition of experimental diets (g/kg).
|
Ingredients/Groups |
A |
B |
C |
D |
E |
F |
G |
H |
|
Extruded corn |
402 |
372 |
352 |
322 |
292 |
255 |
230 |
190 |
|
Soybean meal |
90 |
90 |
60 |
60 |
45 |
50 |
35 |
45 |
|
Corn protein meal |
70 |
80 |
80 |
80 |
90 |
90 |
90 |
90 |
|
Fish meal |
130 |
120 |
150 |
160 |
160 |
160 |
170 |
170 |
|
Bone meat meal |
175 |
170 |
180 |
170 |
170 |
170 |
170 |
170 |
|
Cheese meal |
65 |
70 |
50 |
50 |
50 |
50 |
50 |
50 |
|
Hydrolyzed feather meal |
10 |
10 |
10 |
10 |
15 |
15 |
15 |
15 |
|
Dried blood |
10 |
10 |
10 |
10 |
10 |
12 |
12 |
12 |
|
Premixa of mink |
10 |
10 |
10 |
10 |
10 |
10 |
10 |
10 |
|
Soybean oil |
30 |
60 |
90 |
120 |
150 |
180 |
210 |
240 |
|
Lysine |
3 |
3 |
3 |
3 |
3 |
3 |
3 |
3 |
|
Methionine |
3 |
3 |
3 |
3 |
3 |
3 |
3 |
3 |
|
Salt |
2 |
2 |
2 |
2 |
2 |
2 |
2 |
2 |
a Contained the following per kg of premix- VA 200,000 IU; VD3 40,000 IU; VE 5,000 IU; VB1 125 mg; VB2 200 mg; VB6 200 mg; VB12 2.5 mg; VK3 40 mg; VC 7,500 mg; niacin acid 500 mg; pantothenic acid 800 mg; folic acid 100 mg; choline 10,000 mg; biotin 7.5 mg; Fe 2,000 mg; Cu 500mg; Mn 400 mg; Zn 1,500 mg; I 15 mg; Se 5 mg; Co 7.5 mg.
The diets (Table I) consisted of animal protein sources, a mineral and vitamin supplement. The mineral and vitamin supplement, composition of which is shown in a footnote to Table I The composition of the experimental diets is given in Table II. All diets met the nutrient requirements of growing minks (NRC, 1982). Eight energy levels were obtained by addition of 3, 6, 9, 12, 15, 18, 21 or 24% bean oil. The experimental diets consisted of fish meal, bone meat meal, soybean meal and premix of mink, vitamin and mineral supplements. All experimental groups were fed pulverous complete diet, which contained appropriate proportion of oil, dry power, and water mixed well before feeding. Minks had free access to drinking water and were fed twice a day with the experimental diet.
Table II. Chemical composition of experimental diets on dry matter.
|
Proximate analysis |
A |
B |
C |
D |
E |
F |
G |
H |
|
CP(%) |
32.66 |
32.34 |
32.43 |
32.37 |
32.50 |
32.50 |
32.22 |
32.31 |
|
EE(%) |
8.19 |
11.15 |
15.06 |
17.81 |
20.41 |
23.58 |
26.08 |
29.06 |
|
ME(MJkg-1) |
12.57 |
13.14 |
13.81 |
14.41 |
15.00 |
15.57 |
16.19 |
16.75 |
|
Lys(%) |
1.68 |
1.65 |
1.65 |
1.66 |
1.64 |
1.64 |
1.64 |
1.66 |
|
Met(%) |
0.88 |
0.87 |
0.89 |
0.90 |
0.90 |
0.90 |
0.91 |
0.91 |
|
Ca(%) |
3.05 |
3.04 |
3.12 |
3.06 |
3.05 |
3.06 |
3.08 |
3.09 |
|
TP(%) |
2.05 |
2.04 |
2.09 |
2.08 |
2.06 |
2.06 |
2.08 |
2.07 |
|
% of ME |
||||||||
|
protein* |
35.24 |
33.58 |
32.79 |
31.27 |
30.07 |
28.24 |
27.73 |
26.27 |
|
fat* |
19.05 |
24.39 |
27.89 |
33.69 |
38.94 |
46.22 |
47.34 |
53.46 |
CP, crude protein; EE, ether extract; ME, metabolizable energy; *Values of % of ME(protein,fat)were calculated.
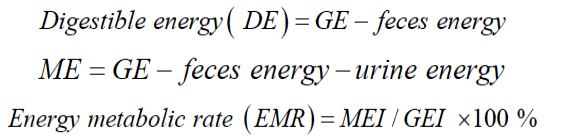
Body weights (BW) of the animals were recorded every 15 days. The digestibility of protein and energy were determined with each animal twice during the growth period: (1) at 11 weeks of age (phase I), a period of rapid growth, and (2) at 21 weeks of age (phase II), which was a few days after winter fur production had begun. Sixteen minks in each group were moved to metabolism stalls to ensure the complete collection and separation of feces and urine. Feed intakes and total output of feces and urine were recorded daily for every mink for 3 d. Urine, feces and feed were sampled daily and refrigerated (4℃) for the 3-d experiment. Samples of the diet and feces were dried at 60℃ for 48 h in a forced-air oven, and then ground through a 2-mm screen in a sample mill. The chemical composition of diets and feces was analyzed by standard methods. Wet samples of diets and feces were analyzed for dry-matter (DM) and N, while the freeze-dried samples were homogenized and analyzed for ash, fat and gross energy (GE). Crude protein (CP) was determined using an automated Kjeltecl 8400 analyzer unit (Foss 8400, Denmark). A bomb calorimeter (IKAC, 2000 basic, Germany) was utilized to determine gross energy, feces energy (FE), urine energy (UE) and metabolic energy (ME).
The growth rates were determined by using the formula for instantaneous percentage growth rate described by Brody.

Where R is the growth rate; W2and W1 are the individual weights at the beginning and end, respectively, of a period; and t2-t1 is the duration of the period in weeks.
The apparent digestibility (AD) of nutrients and energy was calculated as follows (Geng et al., 2012):
AD=(A-B) /A x 100
Where A is the intake of nutrient from the diet and B the nutrient in the feces.
Data were analyzed by the analysis of variance using the general linear models (GLM) procedure of SAS (SAS Institute, 2002). Differences between groups were tested using Duncan test. P-values <0.05 were set as the criterion for statistical significance. Data were presented as mean ±SD. The following model was used:
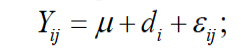
where Yij is the observation; μ is the general mean; di is the effect of energy level (i=1, …, 5); and εij is the random error.
RESULTS
All results regarding nutrient digestibility and protein and energy metabolism data are presented in relation to the metabolic body size of the animals (kg0.75). Metabolic body size was used as a reference to facilitate comparison among balance periods, and because the animals used in the experiment differed in live weight.
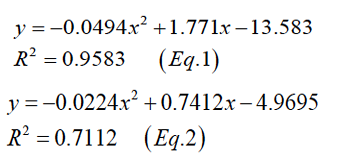
Figure 1A describes the relationships between energy levels content of food and body weights. The resulting curve shows low body weight at low dietary energy density, which increased with increasing energy levels and decreased after reaching a maximum (Equation 1, male; Equation 2, female).
Consequently, the growth rates at dietary energy density were male and female respectively are shown in Figure 1B. The growth rate curve first increases to the maximum and then decreases with the increase of the energy level. The pattern of growth rates can be expressed by a quadratic curve with the following general equation (Equation 3, male; Equation 4, female).
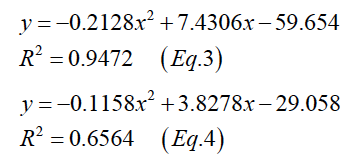
Figure 2 describes the relationships between body weights and the total energy of daily voluntary feed intake of mink in two phases. The pattern of growth rates can be expressed by a quadratic curve with the following general equation (Equation 5, phase I male; Equation 6, phase I female; Equation 7, phase II male; Equation 8, phase II female).
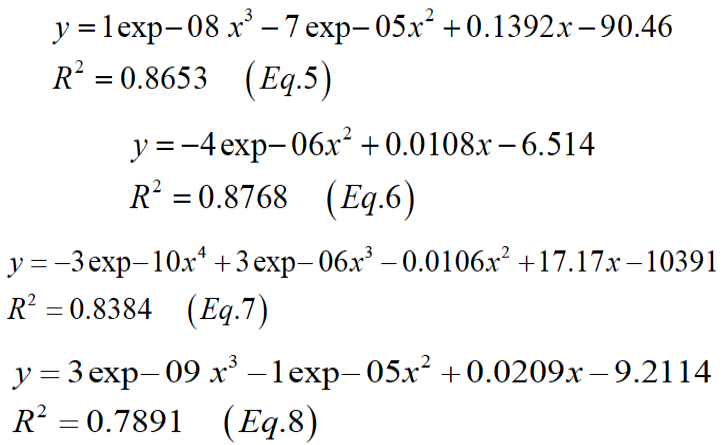
Figure 3 describes the relationships between energy density content of food and the daily voluntary feed intake of mink per kg0.75 of BW. The resulting curve shows low feed intake (y, g/ kg0.75/day) at low dietary energy density, which increased with increasing energy (Equation 9, Phase I; Equation 10, Phase II)
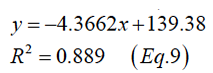
y=-12.452x+267.5
R2=0.9522 (Eq.10)
Effects of dietary energy levels on apparent digestibility of nutrients are shown in Table III. Dry matter and energy digestibility reflect the digestibility values of the main nutrients. Digestibility of main nutrients differ significantly among foods within each groups. DM digestibility ranged from 52.29 to 69.11% in phase I and from 66.01 to 70.09% in phase II. CP digestibility was 57.27 – 69.09% and 67.31 – 69.94% in phase I and in phase II, respectively. EE digestibility ranged from 47.95 to 88.96% in phase I and from 84.17 to 91.76% in phase II. Corresponding figures for energy digestibility were 62.93 – 80.01% in phase I and 73.05 – 80.73% in phase II. E group minks tended to improve the apparent digestibility values of DM (p=0.0006; p=0.1109) and CP (p=0.0017; p=0.8356) in two periods. In phase I, there was significant difference between groups .and in phase II was no significant difference. Apparent digestibility of fat was significantly higher than those of other groups on group H (p<.0001, phase I) and group G and E (p<.0001, phase II) . For the whole study group, there was remarkable difference in digestibility of energy, the best digestibility being recorded for E group minks in phase I (p<.0001) and G group in phase II (p<.0001). The digestibility of main nutrients (DM, CP, EE and energy) male mink was higher than that of female throughout the experiment.
Data pertaining to N-balance are presented in Figure 4. The N-balance split into N intake input, outputs of N in feces (phase I, p<.0001; phase II, p<.0001)and in urinary. The N intake (phase I, p<.0001; phase II, p<.0001) and urinary N (phase I, p=0.3819; phase II, p=0.0001) declined firstly and then increased as the oil content of the diet increased in both periods. The amount of feed had significant effect on the efficiency of retained N in phase II (p=0.0004) and not significant difference in phase I (p=0.1979). N retained in minks fed at E group diets was greater than the others in both periods. In Figure 4, it is obvious that the N retained by male mink is significantly higher than that of female mink.
Table III. Parameters on the apparent digestibility of nutrients (%).
|
DM |
CP |
EE |
ME |
||||||
|
I |
II |
I |
II |
I |
II |
I |
II |
||
|
Group |
A |
52.29 ±15.72Cc |
66.01 ±2.31 |
57.50 ±9.61Bc |
67.44 ±7.09 |
47.95 ±23.22Bc |
87.25 ±6.89bc |
62.93 ±12.95Cb |
73.05 ±2.56De |
|
B |
56.64 ±12.51BCbc |
66.95 ±3.02 |
57.27 ±9.11Bc |
69.94 ±7.26 |
56.96 ±23.22Bc |
85.25 ±7.84Ba |
66.97 ±9.58BCb |
73.86 ±2.71Dde |
|
|
C |
64.03 ±10.21ABab |
67.26 ±2.20 |
64.92 ±8.43ABab |
68.14 ±6.08 |
76.11 ±12.42Ab |
87.40 ±4.18ABbc |
74.39 ±6.96ABa |
75.51 ±2.15CDcd |
|
|
D |
67.32 ±6.00ABa |
68.93 ±2.44 |
67.15 ±5.86Aab |
69.13 ±3.73 |
86.32 ±4.97Aab |
84.17 ±7.03Ba |
78.26 ±4.24Aa |
77.38 ±2.62BCbc |
|
|
E |
69.11 ±4.99Aa |
69.48 ±2.60 |
69.09 ±4.35Aa |
69.42 ±5.78 |
86.88 ±6.69Aab |
88.10 ±2.44ABabc |
80.01 ±3.69Aa |
78.51 ±1.61ABab |
|
|
F |
65.37 ±10.42ABa |
68.47 ±2.24 |
62.56 ±9.14ABabc |
67.31 ±7.53 |
78.47 ±20.16Aab |
91.68 ±1.76Aa |
76.29 ±8.99Aa |
79.76 ±1.64ABa |
|
|
G |
66.19 ±10.66ABa |
70.09 ±2.63 |
65.25 ±7.94ABab |
68.77 ±6.07 |
82.21 ±15.29Aab |
91.76 ±2.03Aa |
78.10 ±8.56Aa |
80.73 ±2.01Aa |
|
|
H |
64.09 ±14.53ABab |
68.48 ±8.89 |
61.78 ±13.54ABbc |
65.59 ±12.55 |
88.96 ±6.12Aa |
91.32 ±3.04Aab |
78.57 ±8.97Aa |
79.92 ±5.36ABa |
|
|
Sex |
♂ |
71.07 |
69.33 |
67.06 |
73.39 |
85.41 |
89.23 |
80.22 |
77.63 |
|
♀ |
55.53 |
67.16 |
59.59 |
63.29 |
65.58 |
87.50 |
68.74 |
77.09 |
|
|
P |
0.0006 |
0.1109 |
0.0017 |
0.8356 |
<.0001 |
<.0001 |
<.0001 |
<.0001 |
|
|
SEM |
0.357771 |
0.164949 |
0.317522 |
0.05 |
1.26472 |
0.486 |
0.735219 |
1.484 |
|
Within the same column values with different capital letter letters extremely significantly different (P <0.01). Within the same column values with different small letter letters extremely significantly different (P <0.05).
Table IV. Nutrient digestibility correlations (lower triangle) between feed different energy levels over all groups of minks.
|
Phases |
CP |
EE |
Energy |
|
DM |
0.80149 |
0.72217 |
0.93746 |
|
CP |
0.51943 |
0.68476 |
|
|
EE |
0.81711 |
||
|
P-value |
<.0001 |
<.0001 |
<.0001 |
DM, dry matter; CP, crude protein; EE, crude fat.
There was a significantly positive correlation in nutrient digestibility (Table IV). DM was more closely related to the energy (r=0.93746; P<.0001) and CP digestibility (r=0.80149; P<.0001) than to EE (r=0.72217; P<.0001) and energy (r=0.51; P<.0001). However, EE (r=0.51943; P<.0001) and energy (r=0.68476; P<.0001) only showed a weak negative correlation to CP. There was a more significant positive correlation between EE and energy (r=0.81711; P<.0001).
DISCUSSION
It was traditional or classical energy metabolism studies in which animals are fed a variety of rations and their energy balances are used to calculate the efficiency of the various forms of production. These studies are presumably intended to support the search for energy requirements of animals and the energy supplied by feeds.
Mink is asmall fur animal, for which the summer period to the period of molting in November is the most vigorous period of growth and development. Mink increase their feed intake and body weight gain. In production systems, the mink industry promotes intense selection for big body size as these determine profitability (Lagerkvist, 1997). Feeding practices encourage maximum body weight gain in the fall (Korhonen and Niemelä, 1998). High energy feed contribute to the mink having a high body weight at pelting.
In the present investigation, the growth of mink body weights and growth rate was regulated by energy intake which increased at first and then decreased as the energy level was increased. A similar effect of decreasing dietary energy level in fox was shown by Ahlstrøm (1995) and Kopczewski et al. (2001) who reported that an increase in feed energy content caused a significant increase in the body weight.
Mink adjust voluntary feed intake according to the energy level, but animals get nutrients from feed is directly related to feed intake. It can be seen from Figure 3 that when the dietary energy level increased, the voluntary daily feed intake decreased linearly. Excessively high energy leads to low intake, nutrient deficiency and decreased the growth ofminks and its performance. It shows that the energy can increase the weight of mink in a certain range, and the energy is too high to inhibit its growth. Clausen et al. (2014) reported the requirement of the dietary energy during the growing phase. In that study, the mink was able to gain more weight in July, the energy distribution in the feed for kits required that the metabolic energy from protein should be at least 32%, the fat should be between 53% and 56%, and carbohydrate should be no more than 18% of ME.
Our results demonstrate that the voluntary feed intake of mink is related to the actual useful metabolic energy content of the specific diet within a certain range. With the increase of feeding energy level, the mink voluntary intake decreased. When fed unbalanced foods under no-choice conditions, mink were forced to trade off eating more of lipid against eating less of the other macronutrient relative to what they would eat if they were able to reach the intake target. Nutrient digestibility is dependent on the availability of the feed ingredients (Mayntz et al., 2009). Dietary ingredients that change the feed transit time through the gastrointestinal tract may, therefore, lead to changes in nutrient digestibility (Hellwing et al., 2005). There was a direct relation between the feed amount and the apparent digestibility of the feed of mink (Sinclair el al., 1962). Ahlstrøm (1995) showed that as the energy level increased, the apparent digestibility of the nutritive substances of mink increased.
The apparent digestibility of CP and EE in this trial was slightly lower compared to values reported in other trials (Ahlstrom et al., 1998; Hellwing et al., 2005; Zhang et al., 2012). This is likely due to the composition of the diet. A major factor influencing the digestibility of nutrients is the diet composition. It has been found that in the Arctic fox, nutrients from diets composed of animal meals were characterized by lower digestibility compared to components of fresh feed (Vhile et al., 2005; Gugolek et al., 2010). The increase in dietary fiber and fat contents may interfere with the apparent digestibility of CP and EE in the present experiments. Suvegova et al. (2001) reported that the digestibility of CP and fats decreased with increasing percent proportion of poultry shanks in feed rations for minks for CP from 80.75 to 70.35%, and for fats from 90.14 to 84.24%. In our study, the apparent digestibility of DM, CP and energy increased then declined as the oil content of the diet increased. All results pertaining to nutrient digestibility were significantly higher in phase II than those in phase I in mink. This would imply a slightly more efficient utilization for nutrients in phase II. Significant differences were found in sexes in the nutrients digestibility of energy levels from the diet fed. The apparent digestibility was better in male than in female. A similar effect of increasing dietary fat level was shown in blue foxes by Geng et al. (2012) who reported that the energy digestibility values ranged from 74.3% to 90.3% (phase 1) and from 78.9% to 90.1% (phase 2) when diet fat levels ranged from 12% to 54%, and nitrogen digestibility values varied from 72.9% to 85.5% (phase 1) and from 72.7% to 84.8% (phase 2).
Conventional mink diets are largely based on by-products from the fishing industry and abattoirs and, therefore, are rich in protein and other N-containing constituents; their protein content usually exceeds the animals’ requirement. The mink has a very short intestine and a feed passage time of only 4-6 h (Hansen, 1978; Szymeczko and Skrede, 1990). Thus, ingested dietary protein is rapidly digested and absorbed, the excess being metabolized to C fragments used for energy metabolism and to N-containing end products which are excreted in the urine. Therefore, in fed animals, the urinary load of N metabolites is high, with urea accounting for the vast majority of osmotically-active substances.
Nitrogen metabolism is the basis of the study of animal protein requirement. Full understanding of the nitrogen metabolism of animal helps to ensure the requirement fo the nutritional needs of fur animal protein, as far as possible to reduce nitrogen discharge pollution to the environment. The energy of daily grain affects the protein digestibility, and when the energy supply is insufficient, it may result in mink failing to maintain themselves. So it needs to eat more to meet the need for energy, causing protein waste. Therefore, the amount of protein and energy diet should be appropriate. Mayntz et al. (2009) reported that when fed unbalanced foods under no-choice conditions, mink were forced to tradeoff eating more of either protein or lipid against eating less of the other macronutrient relative to what they would eat if they were able to reach the intake target. In the phase II, we found the diets under less energy levels (A, B, C groups) where more N-intakes was eaten. The high energy levels of diets were just opposite. It is possible that this initial trial (phaseⅠ) fed unbalanced diets resulted in little mink being unhealthy. The bases exist for selection pressure on predators to demonstrate a capacity for nutritional regulation in the field. Regulation of nutrient intake might occur by choosing among prey of different nutrient composition, by eating different amounts of prey depending on nutrient composition, or by feeding on specific parts of a prey, such as on protein-rich muscles or fat-rich tissues and organs (Maynt et al., 2005).
CONCLUSIONS
Voluntary feed intake of mink was found to be dependent upon dietary energy content. Body weights were regulated by energy intake tended to increase at first and then decreased as the energy level was increased. The apparent digestibility was better in male than in female. The energy levels affect the performance of female mink to a lesser degree than those of male mink. Diets containing energy at levels below 15.06KJ/kg and exceed 29.06 KJ/kg of dry matter did not support optimum growth of male, but energy levels at least as low as 17.81KJ/kg and no more than 29.06 KJ/kg appeared to be satisfactory for the growth of female.
ACKNOWLEDGEMENTS
The staff of Feed Research Institute, Chinese Academy of Agricultural Sciences is gratefully acknowledged for their valuable help in carrying out these experiments. Special thanks to Dr. Guangyu Li who supervised and provided valuable guidance at every stage of this experiment. The core funding for this study was from Special Fund for Public Welfare Technology Research of Agricultural Industry (No.200903014).
Statement of conflict of interest
The authors declare that there is no conflict of interest.
REFERENCES
Ahlstrøm, Ø., 1995. Feed with divergent fat: carbohydrate ratios for blue foxes (Alopex lagopus) and mink (Mustela vison) in the growing-furring period. Norway J. agric. Sci., 9: 115-126.
Ahlstrom, O. and Skrede, A., 1998. Comparative nutrient digestibility in dogs, blue foxes, mink and rats. J. Nutri., 128: 2676-2677. https://doi.org/10.1093/jn/128.12.2676S
Ahlstrøm, Ø., Tauson, A.H., Frydendahl Hellwing, A. L., Mydland, L.T. and Skrede, A., 2006. Growth performance,nitrogen balance and urinary purine derivatives in growing-furring mink (Mustela vison)fed bacterial protein produced from natural gas. J. Anim. Feed Sci., 15: 491-504. https://doi.org/10.22358/jafs/66919/2006
Borsting C.F., Engberg R.M., Jensen S. K. and Damgaard B.M., 1998. Effects of high amounts of dietary fish oil of different oxidative quality on performance and health of growing-furring male mink (Mustela vison) and of female mink during rearing, reproduction and nursing periods. J. Anim. Physiol. Anim. Nutri., 79: 210-223. https://doi.org/10.1111/j.1439-0396.1998.tb00644.x
Burlikowska, K. and Szymeczko, R., 2007. Ileal digestibility of fat and fatty acids in polar foxes (Alopex lagopus L.) feed diets used during the reproductive period. Acta Agric. Scand., 57: 136-141. https://doi.org/10.1080/09064700701801200
Canadian Council on Animal Care., 1993. Guide to the care and use of experimental animals: 2nd edn. CCAC, Ottawa.
Clausen, T.N. and Sandbøl, P., 2014. Feed with different energy distribution to mink kits from July to mid September. 65th Annual Meeting of the European Federation of Animal Science
Geng, Y.Y., Yang F.H., Xing X.M. and Gao X.H., 2012. Effects of dietary fat levels on nutrient digestibility and production performance of growing-furring blue foxes (Alopex lagopus). J. Anim. Physiol. Anim. Nutri., 96: 610-617. https://doi.org/10.1111/j.1439-0396.2011.01186.x
Gugolek, A., Zabockli, W., Kowalska, D., Janiszewski, P., Kons-tantynowicz, M. and Strychalski, J., 2010. Nutrient digestibility in Arctic fox (Vulpes lagopus) fed diets containing animal meals. Arq. Brasil. Med. Vet. Zootec., 62: 948-953. https://doi.org/10.1590/S0102-09352010000400026
Hansen, N.E., 1978. The inflenence of sulfuric acid preserved herring on the passage of time through the gastro-intestinal tract of mink. Z. Tierphysiol. Tierernah Futtermittelk., 40: 285-291. https://doi.org/10.1111/j.1439-0396.1978.tb00550.x
Hellwing, A.L., Tauson, A.H., Ahlstrøm, O. and Skrede, A., 2005. Nitrogen and energy balance in growing mink (Mustela vison) feed different levels of bacterial protein meal produced with natural gas. Arch. Anim. Nutri., 59:335-352. . https://doi.org/10.1080/17450390500247873
Kopczewski, A., Nozdryn-Płotnicki, Z., Ondrašovič, M., Bis - Wencel, H., Saba, L., Zon, A., Slawon, J., Strzalkowski, L. and Ulewicz, W.F., 2001. The effect of feed with various high-energy levels on anatomical and histopathological changes in arctic foxes. Folia Vet., 45: 134-138.
Koskinen, N., Tauson, A.H. and Sepponen, J., 2008. Energy metabolism of growing blue foxes. Scientifur, 32: 149-150.
Korhonen, H. and Niemälä, P., 1998. Effect of ad libitum and restricted feeding on seasonal weight changes in captive mink (Mustela vison). J. Anim. Physiol. Anim. Nutr., 79: 269–280. https://doi.org/10.1111/j.1439-0396.1998.tb00650.x
Krogdahl, A., Ahlstrøm, Ø. and Skrede, A., 2004. Nutrient digestibility of commercial dog foods using mink as a model. J. Nutri.,134: 2141S-2144S. https://doi.org/10.1093/jn/134.8.2141S
Kumeno, F., Itoyama, K., Hasegawa, J. and Aoki, S., 1970. Effect of protein and fat levels in complete pelleted diets on the growth of mink kits. J. Anim. Sci., 31: 894-899. https://doi.org/10.2527/jas1970.315894x
Lagerkvist, G., 1997. Economic profit from increased litter size, bodyweight and pelt quality in mink (Mustela vison). Acta Agric. Scand. Sect. A., 47: 57–63. https://doi.org/10.1080/09064709709362370
Mayntz, D., Raubenheimer, D., Salomon, M., Toft, S. and Simpson, S.J., 2005. Nutrient-specific foraging in invertebrate predators. Science, 307: 111-113. https://doi.org/10.1126/science.1105493
Maynt, D; Nielsen V H; Allan S; Toft S; Raubenheimer D; Hejlesen C; Simpson S. J., 2009. Balancing of protein and lipid intake by a mammalian carnivore,the mink, Mustela vison. Anim. Behav., 77: 349-355. https://doi.org/10.1016/j.anbehav.2008.09.036
NRC, 1982. Nutrient Requirements of Mink and Foxes. Washington, D. C. National Academy Press.
Polonen, I., Kakela, R., Miettinen, M. and Asikainen, J., 2000. Effects of different fat supplements on liver lipids and fatty acids and growth of mink. Scientifur, 24: 92-94.
SAS, 2002. Statistical analysis system. SAS Institute, Cary.
Sinclair, D.G., Evans, E.V. and Sibbald, I.R., 1962. The influence of apparent digestible energy and apparent digestible nitrogen in the diet on weight gain, feed consumption and nitrogen retention of growing mink. Can. J. Biochem. Physiol., 20: 257-264. https://doi.org/10.1139/y62-154
Suvegova, K., Mertin, D., Flak, P., Ceresnakova, Z. and Tocka, I., 2001. Digestibility of crude protein and fat in feeds for minks with various proportions of poultry shanks, beef meat and fish by-products. Czech J. Anim. Sci., 46: 122-125.
Szymeczko, R. and Skrede, A., 1990. Protein digestion in mink. Acta Agric. Scand., 40: 189-200. https://doi.org/10.1080/00015129009438018
Vhile, S.G., Skrede, A., Ahlstrom, O., Szymeczko, R. and Hove, K., 2005. Ileal and total tract nutrient digestibility in blue foxes (Alopex lagopus) fed extruded diets containing different protein sources. Arch. Anim. Nutri., 59: 61–72. https://doi.org/10.1080/17450390512331342395
Wu, X.Z., Liu, Z., Zhang, T.T., Yang, Y., Yang, F.H. and Gao X.H., 2014. Effects of dietary copper on nutrient digestibility, tissular copper deposition and fur quality of growing-furring mink (Mustela vison). Biol. Trace. Elem. Res., 158: 166-175. https://doi.org/10.1007/s12011-014-9933-7
Wu, X.Z., Yang, Y., Liu, H.T., Yue, Z.Y., Gao, X.H., Yang, F.H. and Xing, X., 2014. Effects of dietary copper supplementation on nutrient digestibility, serum biochemical indices, and growth rate of young female mink (Neovison vison). Czech J. Anim. Sci., 59: 529–537. https://doi.org/10.17221/7734-CJAS
Wu, X.Z., Zhang, T.T., Guo, J.G., Liu, Z., Yang, F.H. and Gao, X.H., 2015. Copper bioavailability, blood parameters, and nutrient balance in mink. J. Anim. Sci., 93: 176–184. https://doi.org/10.2527/jas.2014-8026
Zhang, H.H., Li, G.Y., Xing, X.M., Ren, E.J., Yang, Y. and Yang, F.H., 2012. Effect of low-protein diet with supplementing different levels of DL-methionine on production performance of minks in growing-furring period. J. Forest. Res., 23: 151-155. https://doi.org/10.1007/s11676-012-0221-0
Zhang, H.H., Zhou, N. Zhang, T.T., Bao, K., Xu, C., Song, X.C. and Li, G.Y., 2014. Effects of different dietary manganese levels on growth performance and n balance of growing mink (Neovision vision). Biol. Trace. Elem. Res.,160: 206–211. https://doi.org/10.1007/s12011-014-0008-6
Zhang, T.T., Zhang, Z.Q., Gao, X.H., Yang, F.H. and Xing, X.M., 2013. Effect of dietary protein levels on digestibility of nutrtients and growth performance in young female mink. J. Anim. Physiol. Anim. Nutri., 97: 271-277. https://doi.org/10.1111/j.1439-0396.2011.01267.x
To share on other social networks, click on any share button. What are these?


